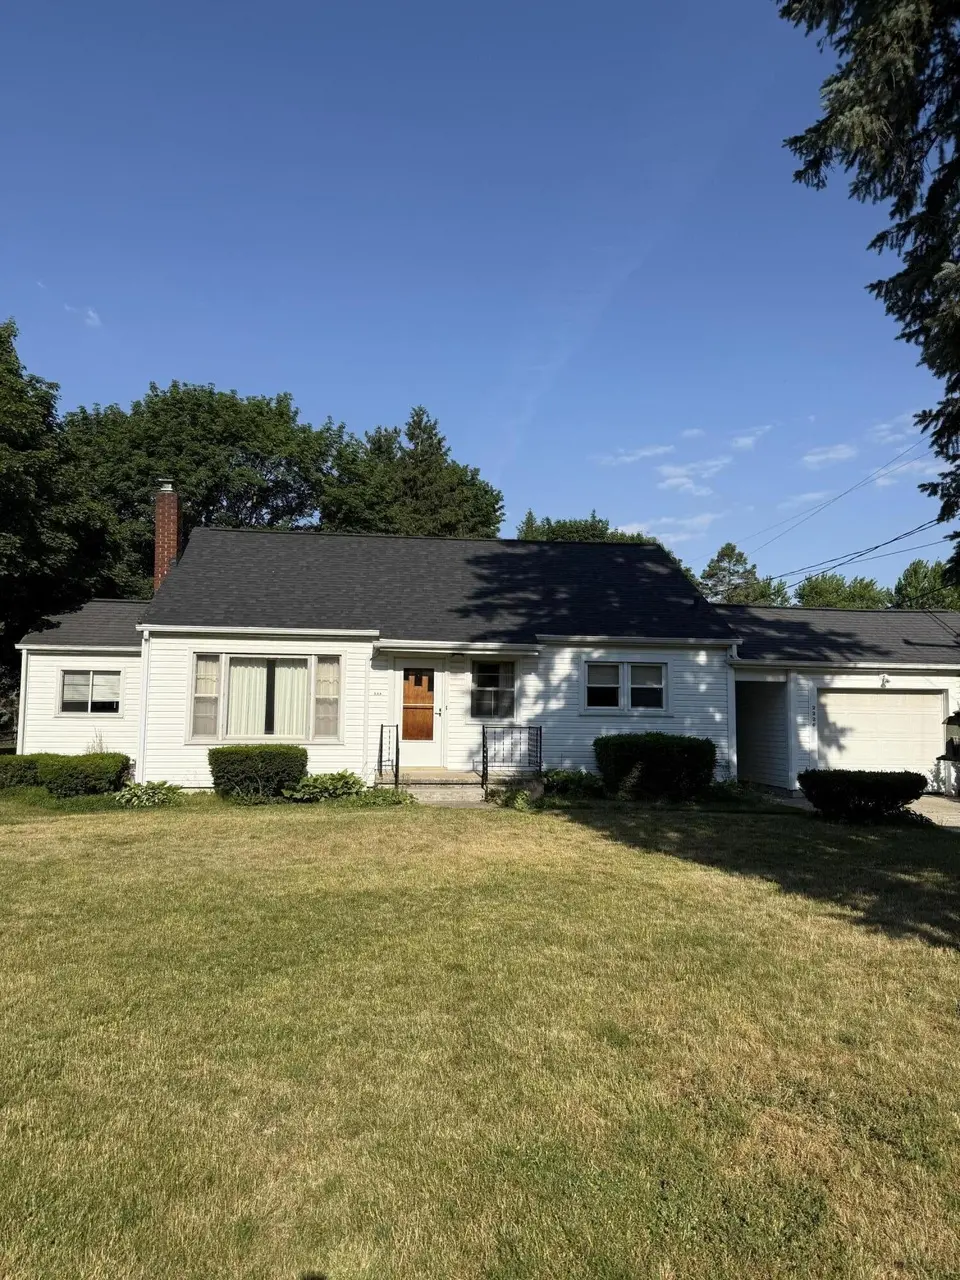
2326 Sunset Ln · Madison, MI
Flood risk 1/10 · Minimal
- FEMA flood zone
- X (unshaded)
- Chance of flooding over 30 yrs
- 0.0%
- Est. flood insurance / yr
- $473 – $860
Fire risk 1/10 · Minimal
- Est. fire insurance / yr
- $784 – $1,456
Heat risk 3/10 · Minor
- Hot days now (above 98°F)
- 7 days/yr
- Hot days in 30 yrs
- 16 days/yr
Wind risk 2/10 · Minimal
- Chance of severe wind over 30 yrs
- —
Air-quality risk 2/10 · Minimal
- Unhealthy air days now
- 1 days/yr
- Unhealthy air days in 30 yrs
- 2 days/yr
Risk factors via First Street. Map © Google.
Why this score? — see what drove the F grade
The composite is a weighted blend of 9 inputs, each scored 0–100. Each bar is that input's sub-score; the figure is the points it added to the 100-point composite (weight × sub-score).
- Cash flow +16.3/30.0
- DSCR +5.0/10.0
- 1% rule +3.3/10.0
- Rent growth +2.5/5.0
- Schools +2.5/10.0
- Livability +2.5/5.0
- Condition / age +2.5/5.0
- ARV discount +0.0/15.0
- Appreciation +0.0/10.0
$225,000
🖨 Deal sheet (PDF) 📄 Offer letter ✓ Due diligence
Listing remarks MLS
Step into this charming 3-bedroom, 1-bath home located in the desirable Airport Subdivision--a neighborhood known for its convenience and welcoming community feel. With 1,080 sq. ft. of well designed living space, this home offers comfort, functionality, and room to grow. Sitting on a large, partially fenced lot, the property provides the perfect blend of privacy and outdoor potential. Whether you're dreaming of a garden, a play area, or space for pets to roam, this yard delivers. Inside, the layout offers bright living spaces, comfortable bedrooms, and a cozy atmosphere ready for your personal touch. This home is ideal for first time buyers, downsizers, or anyone looking for a solid property in a great location. Don't miss your chance to make this Airport Subdivision gem your own.
Key facts
- Partially fenced lot
- Large yard
- Bright living spaces
Tags
Property features AI
Exterior
- Parking: Attached garage (1 car)
- Utilities: Public water; Natural gas connected
- Home design: Ranch-style single-family home; Built in 1951
- Construction: Vinyl siding; Shingle roof; Built in 1951
- Exterior features: Paved road access; Shed(s)
Interior
- Kitchen: Kitchen (approx. 12 x 9); Oven; Range; Refrigerator
- Bedrooms: Primary bedroom (approx. 16 x 12); Bedroom 2 (approx. 13 x 9); Bedroom 3 (approx. 12 x 7)
- Bathrooms: 1 full bathroom (approx. 9 x 9)
- Heating & cooling: Forced air heating; Has heating; Has cooling
- Interior features: Garage door opener; Full basement; 7 total rooms
- Laundry & utility: Washer; Dryer; Natural gas water heater
Neighborhood map
What this means for you Summary
Snapshot
- This is a 3-bed/1.0-bath single-family listed at $225k.
Deal economics
- At list price, monthly cash flow is $122 ($1k/yr) — positive.
- The deal already cash-flows at list — no discount required.
- To meet the 1% rule (rent ≥ 1% of price), the offer needs to be $188k (16.6% below list).
- Recommended offer: $188k (16.6% below list) — sets the bar for 1% rule.
Location & tenants
- Location reads: area grade F — affects rentability + tenant quality, not the cash-flow math above.
- Adrian School District (town): math 25% / reading 35% proficiency, ranked #370 of 540 in MI (top 68%) — families likely to look elsewhere, expect single-tenant / working-renter base with shorter leases.
- Zoned schools: Prairie Elementary School (math 17% / reading 27%, grade F, #1,035 of 1,397 statewide, top 77%, 224 students, 80% FRL); Springbrook Middle School (math 29% / reading 38%, grade F, #303 of 493 statewide, top 62%, 641 students, 71% FRL); Adrian High School (math 22% / reading 42%, grade F, #405 of 713 statewide, top 59%, 781 students, 63% FRL).
- Market conditions: 212 active listings in the ZIP; 2 comparable units currently listed for rent nearby; 137 units permitted in Lenawee County in 2024 (0 in 5+ unit buildings).
Forward outlook
- Local home prices are declining (-3.0%/yr); year-one equity from $2k of loan paydown is wiped out by about $7k of value loss. Plan a longer hold.
- Lenawee County population projected at -18% by 2050 — secular population decline; favor cash flow + early exit over multi-decade hold.
Negotiation context
- Only 13 days on market — expect competitive offers; lowballing is unlikely to land.
- 3 sale attempts with the ask held roughly flat each time — persistent listings suggest the price (not the market) is what's stuck; bring a comps-based counter.
Risks & watch-outs
- Watch-outs: built in 1951 — expect roof / HVAC / electrical / plumbing capex.
Questions for the listing agent
- Built in 1951 — when were the roof, HVAC, electrical panel, plumbing, and water heater last replaced?
- Is there a deadline driving the sale (1031 exchange, divorce, estate, relocation)? That informs how much negotiation room exists.
- The area grade is low — what's the realistic commute time and amenity access for the typical tenant pool here? Any planned neighborhood developments (good or bad) we should know about?
- What's the average days-on-market for RENTAL listings here right now (not sales)? A rising rental-DOM trend means longer vacancies and softer asking-rent achievability than the comps imply.
- What's the recent tenant-quality profile in this submarket — average credit score on applications, eviction rate, late-payment / NSF rate, and stable-employment percentage? A property-management company in the area should have these aggregated.
- How much new for-sale + rental construction is in the pipeline within 1–3 miles? Heavy new supply typically softens prices + rents 12–24 months out; constrained supply supports both.
Investment metrics
- 1% rule
- 0.83% ✗
- Cap rate
- 6.95%
- Cash-on-cash
- 2.33%
- DSCR
- 1.10
- GRM
- 10.0
CMA / ARV
- ARV (on-the-fly)
- $186,840
- Comps found
- 12
Show comp detail 12 sales within ~0.75 mi
| Address | Dist | Beds/Ba | Sqft | Sold | Price | $/sf | Match |
|---|---|---|---|---|---|---|---|
| 2281 Fairview Dr | 0.19mi | 3/2.0 | 1,090 (+1%) | 5mo | $192,000 | $176 | 82 |
| 2285 Fairview Ave | 0.19mi | 2/1.0 (-1) | 1,145 (+6%) | 14mo | $177,400 | $155 | 64 |
| 2725 Sharon Dr | 0.48mi | 3/1.0 | 1,152 (+7%) | 9mo | $220,000 | $191 | 59 |
| 437 Oden Way | 0.69mi | 3/1.0 | 1,001 (-7%) | 1mo | $162,000 | $162 | 55 |
| 1227 Sherman St | 0.46mi | 4/1.0 (+1) | 1,178 (+9%) | 7mo | $140,000 | $119 | 53 |
| 2894 Park Dr | 0.63mi | 3/1.0 | 1,008 (-7%) | 10mo | $220,000 | $218 | 51 |
| 1840 Taylor Dr | 0.64mi | 3/1.0 | 1,188 (+10%) | 4mo | $210,000 | $177 | 51 |
| 2741 Sharon Dr | 0.50mi | 3/1.0 | 920 (-15%) | 5mo | $158,000 | $172 | 48 |
| 1902 Cadmus Rd | 0.70mi | 3/1.0 | 960 (-11%) | 6mo | $168,000 | $175 | 44 |
| 421 S Madison St | 0.63mi | 3/2.0 | 1,201 (+11%) | 7mo | $192,000 | $160 | 42 |
| 1062 Petoskey Ct | 0.70mi | 4/1.0 (+1) | 1,041 (-4%) | 17mo | $180,000 | $173 | 42 |
| 1103 Petoskey Ct | 0.68mi | 3/1.0 | 1,198 (+11%) | 10mo | $180,000 | $150 | 42 |
Match score weights: distance 35% · size 25% · config 20% · recency 20%. Top-matched comps best support the ARV.
Projected returns pro-forma
-3.0% appreciation · 3.0% rent growth · sell at horizon
- IRR
- -12.7%
- Equity multiple
- 0.54×
- Total profit
- $-28,749
- Equity at exit
- $33,548
- IRR
- -3.7%
- Equity multiple
- 0.76×
- Total profit
- $-15,359
- Equity at exit
- $19,454
Cash invested: $63,000 (down + closing). Projections, not guarantees.
Landlord ↔ Tenant lean methodology
- Overall (STATE)
- 62 Landlord-Friendly
- State Michigan
- 62 Landlord-Friendly · EVEN
- County
- — inherits STATE
- City
- — inherits STATE
ZIP-level market 49221
- Active inventory
- 212
- Price-to-rent
- 10.0×
Monthly cashflow live
- Estimated rent
- $1,877 medium interval (Pro) →
- Mortgage (P&I)
- −$1,180
- Tax from tax record
- −$87 /mo · $1,039/yr
- Insurance
- −$94
- HOA
- −$0
- Vacancy / Maint / Mgmt
- −$394
- Net cashflow
- $122
Break-even live
Sensitivity live
| Price | -10% $250 | -5% $186 | +0% $122 | +5% $59 | +10% $-5 |
|---|---|---|---|---|---|
| Rent | -10% $-26 | -5% $48 | +0% $122 | +5% $197 | +10% $271 |
| Rate | -1.0pp $236 | -0.5pp $180 | base $122 | +0.5pp $64 | +1.0pp $5 |
UW: 25.0% down · 7.5% · 30yr · 1.5% tax · 5.0% vac · 8.0% maint · 8.0% mgmt
Financing live
Cash to close
- Down payment
- $56,250
- Closing costs
- $6,750
- Reserves months
- —
- Total cash needed
- —
Loan-product check · same deal, 3 products live
Conventional
25% down · 7.5% · 30yr
- Down + closing
- —
- Monthly P&I
- —
- Monthly cashflow
- —
- DSCR
- —
- Eligible?
- —
Personal DTI + credit; lowest rate.
DSCR
20% down · 8.5% · 30yr
- Down + closing
- —
- Monthly P&I
- —
- Monthly cashflow
- —
- DSCR
- —
- Eligible?
- —
No personal income docs; deal must DSCR.
Hard money
10% down · 12.0% · 12mo
- Down + closing
- —
- Monthly P&I
- —
- Monthly cashflow
- —
- DSCR
- —
- Eligible?
- —
Short-term bridge; refi at stabilization.
Rent comps 2 comps
| Address | Beds | Baths | Sqft | Rent | $/sqft | DOM | Units | Dist |
|---|---|---|---|---|---|---|---|---|
| 1962 W Cadmus Rd Adrian, MI | 3.0 | 2.0 | 1170 | $2,250 | $1.92 | 23d | 1 | 0.72mi |
| 174 Sand Creek Hwy Adrian, MI | 2.0 | 2.0 | 986 | $1,150 | $1.17 | 45d | 1 | 1.39mi |
Listing history 10 events
-
2026-06-21days on market $225,000 Active 13 DOM
-
2026-06-21days on market $225,000 Active 12 DOM
-
2026-06-18days on market $225,000 Active 10 DOM
-
2026-06-17days on market $225,000 Active 9 DOM
-
2026-06-16days on market $225,000 Active 8 DOM
-
2026-06-15days on market $225,000 Active 7 DOM
-
2026-06-13days on market $225,000 Active 5 DOM
-
2026-06-12days on market $225,000 Active 4 DOM
-
2026-06-09remarks 699-char remark
-
2026-06-09$225,000 Active 1 DOM
ⓘ Source: listings_history table (triggers on properties + properties_extension) + one-shot
backfill from property_details.listing_events for pre-trigger history.
Tax reassessment forecast MI · Partial reset (capped growth)
- Current annual tax
- $1,039 · $87/mo
- Projected year-2 tax
- $2,252 · $188/mo
- Expected delta
- +$1,213/yr (+$101/mo · 116.7%)
ⓘ Screening estimate from a state-policy table — verify with the county assessor before closing.
Climate risk First Street
- Flood 1/10 Low FEMA zone X (unshaded) · 0% chance over 30 yrs
- Wildfire 1/10 Low
- Heat 3/10 Moderate 7 d/yr ≥98°F today · 16 d/yr by 30 yrs out
- Wind 2/10 Low
- Air quality 2/10 Low 1 unhealthy d/yr today · 2 by 30 yrs out
Nearby sold comps map
Loading sold comps map…
Walkable amenities ~0.75 mi
Loading nearby amenities…
Taxation est. · year 1
- Rental income
- $22,523
- − Mortgage interest
- −$12,603
- − Property taxes
- −$1,039
- − Insurance
- −$1,125
- − Repairs & maintenance
- −$1,802
- − Management
- −$1,802
- − Depreciation
- −$6,545
- Taxable loss
- −$2,394
- Est. tax savings @ 24.0%
- +$575
- After-tax cash flow
- $2,044/yr
For passive investors: Depreciation is non-cash, so a rental often shows a tax loss while cash-flowing — sheltering income. Rental losses are passive: they offset passive income freely, and up to $25,000/yr can offset ordinary (W-2) income if you actively participate and your MAGI is under $100k (phasing out to $0 by $150k); unused losses carry forward. On sale, claimed depreciation is recaptured at up to 25%, and gains may owe capital-gains tax (a 1031 exchange can defer both). Figures are a year-1 estimate at your 24.0% rate — not tax advice; consult a CPA.
Schools (NCES district)
- District
- Adrian School District
- NCES district ID
- 2601950
- Math proficiency
- 25% ▼ -1.00%
- Reading proficiency
- 35% ▼ -2.00%
- Median HH income
- $41,288
- Composite
- 25.33/100
- National rank
- #7480
- State rank
- #370 of 540 in MI
Livability — Madison
No livability data for this city. (Only ~50 U.S. cities are tracked.)
Census & demographics
- Population (ZIP)
- 41,041
Population outlook (Lenawee County) Hauer SSP2
- Today (2025)
- 95,497 people
- By 2030
- 92,722 · -2.9%
- By 2040
- 85,641 · -10.3%
- By 2050
- 77,971 · -18.4%
- By 2075
- 60,043 · -37.1%
- By 2100
- 41,468 · -56.6%
Race, ethnicity, and origin ACS 2023
- Neighborhood character
- Predominantly White (77%)
- Race & ethnicity
- White 77% Hispanic / Latino 14% Two or more races 8% Black 4%
- Hispanic origin (detail)
- Mexican 12%
- Common ancestry
- Romanian 3% Lithuanian 3% Italian 2%
- Foreign-born
- 3% · Canada
- Languages at home
- 93% English-only · Spanish 6% Arabic 1%
Political lean MEDSL · Lenawee
- 2024 margin
- Strong R (+23.0) · D 37.8% · R 60.8% · Other 1.4%
- 2008→2024 swing
- -28.1pp toward R · 2008: 5.1pp · 2024: -23.0pp
- All cycles
- 2024: R+23.0 2020: R+19.9 2016: R+21.1 2012: R+1.3 2008: D+5.1
Not yet ingested
- Civics
- —
Market trends
- HPI YoY
- ▼ -143.64%
- Current HPI
- 237.3796
- Rent YoY
- —
- Metro
- —
- State GDP YoY
- ▲ 1.37%
- F500 in state
- 28
Industry mix (Fortune 500 HQ in MI)
| Industry | F500 HQs | Revenue |
|---|---|---|
| Automotive Parts | 3 | $48B |
|
||
| Automotive | 2 | $372B |
|
||
| Chemicals | 1 | $45B |
|
||
| Automotive Retail | 1 | $29B |
|
||
| Healthcare / Medical Devices | 1 | $23B |
|
||
| Automotive Technology | 1 | $20B |
|
||
Price history
+0.0% since first listed3 events — show timeline
- 2026-06-08 Listed $225,000 MiRealSource-MiMLS
- 2026-06-08 Listed $225,000 REALCOMP
- 2026-06-08 Listed $225,000 SW Michigan MLS
Property tax history
-2.1%/yrLatest (2025): $1,039 · -40.8% YoY. Source: county tax records.
Cash-flow waterfall
monthlySold comps — $/sqft
last 12 mo · ≤1 miLoading sold comps…