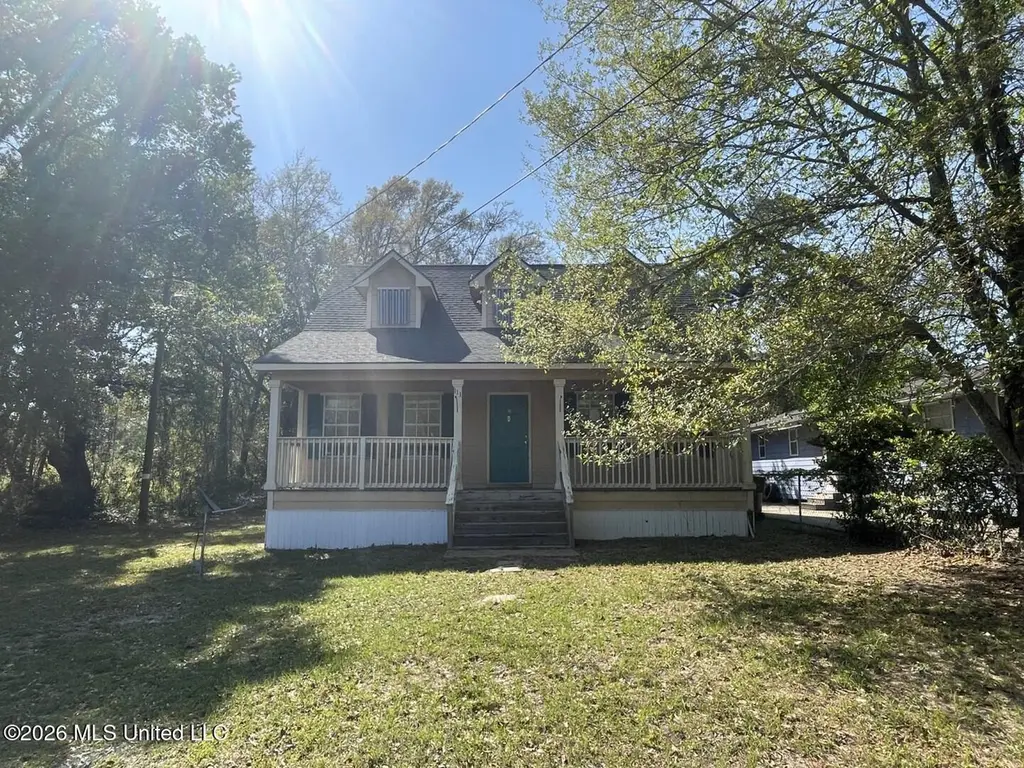
111 N Lang Ave · Long Beach, MS
Flood risk 1/10 · Minimal
- FEMA flood zone
- X (unshaded)
- Chance of flooding over 30 yrs
- 0.0%
- Est. flood insurance / yr
- $507 – $1,088
Fire risk 1/10 · Minimal
- Est. fire insurance / yr
- $1,241 – $2,305
Heat risk 10/10 · Severe
- Hot days now (above 106°F)
- 7 days/yr
- Hot days in 30 yrs
- 23 days/yr
Wind risk 9/10 · Severe
- Chance of severe wind over 30 yrs
- 99.0%
Air-quality risk 1/10 · Minimal
- Unhealthy air days now
- 0 days/yr
- Unhealthy air days in 30 yrs
- 0 days/yr
Risk factors via First Street. Map © Google.
Why this score? — see what drove the B+ grade
The composite is a weighted blend of 9 inputs, each scored 0–100. Each bar is that input's sub-score; the figure is the points it added to the 100-point composite (weight × sub-score).
- Cash flow +30.0/30.0
- ARV discount +15.0/15.0
- DSCR +10.0/10.0
- 1% rule +9.2/10.0
- Schools +4.4/10.0
- Livability +3.5/5.0
- Rent growth +3.0/5.0
- Condition / age +2.5/5.0
- Appreciation +0.0/10.0
$135,000
🖨 Deal sheet 📄 Offer letter ✓ Due diligence
Listing remarks MLS
Whether you're looking for a coastal retreat or a permanent residence, this Long Beach gem offers the perfect blend of Southern charm. Bring your updates to this affordable home! This home is located just moments from the white sand beaches and the vibrant energy of downtown Long Beach. Step onto the inviting front porch, the perfect spot for your morning coffee. Inside, it features 3 bedrooms and 2 bathrooms, including a the primary bedroom and bathroom on the lower level for ultimate convenience. The back of the property overlooks a woodline, providing privacy. Schedule your private tour today and start living the coastal lifestyle!
Key facts
- 6,098 sq ft lot
- Built 1964
- Listed 84 days
Neighborhood map
What this means for you Summary
Snapshot
- This is a 3-bed/2.0-bath single-family listed at $135k.
Deal economics
- At list price, monthly cash flow is $544 ($7k/yr) — positive.
- The deal already cash-flows at list — no discount required.
- Meets the 1% rule at list price ($2k rent vs $135k).
- Recommended offer: $127k (6.0% below list) — sets the bar for market timing.
- Cap rate 11.1% vs local median 4.6% in Long Beach — top-decile yield for the area; either an underpriced asset or a hidden risk that comps aren't pricing in. Stress-test before assuming the spread holds.
Location & tenants
- Location reads 69/100 on livability (#52 in MS) — a middle-class / working-renter tenant base. Strengths: crime A+, cost of living A+, housing A+; Watch: amenities F, commute F, health & safety F.
- Long Beach School District (suburban): math 52% / reading 50% proficiency, ranked #9 of 130 in MS (top 7%) — acceptable for families but not a draw, mixed tenant base, ~2y average lease.
- Market conditions: Rents rising (+1.9%/yr); 311 active listings in the ZIP; 9 comparable units currently listed for rent nearby; rentals leasing fast (median 14d on market — plan ~1-2 weeks tenant-placement turnaround); 2,194 units permitted in Harrison County in 2024 (0 in 5+ unit buildings).
- This rent runs 33% of the median local income ($70k/yr) — at the standard rent-burdened threshold; future hikes will face affordability resistance.
Forward outlook
- Local home prices are declining (-3.0%/yr); year-one equity from $933 of loan paydown is wiped out by about $4k of value loss. Plan a longer hold.
- Harrison County population projected at +27% by 2050 — long-run rental-demand tailwind backs the buy-and-hold thesis.
- At projected returns (-3.0% appreciation + 1.9% rent growth), your $38k cash investment doubles in ~8 years — after that, you're playing with house money.
Negotiation context
- It's been on market 84 days — a 6% lower offer ($127k) is reasonable based on typical stale-listing flexibility.
- 2 sale attempts since 4y ago; this cycle's ask has dropped $15k (10%) from the opening price — seller is motivated, your offer sets the floor, not the list.
- Current owner paid $89k; list at $135k implies a 52% gain — meaningful room to come down on a strong offer.
Risks & watch-outs
- Climate carrying-cost: severe wind risk, 99% chance of damaging wind over 30y; extreme-heat days projected 7→23/yr by 2055 (HVAC capex compounding) — expect insurance premiums to compound above CPI over the hold.
Questions for the listing agent
- It's been on market 84 days. Have you received any prior offers? Is the seller open to a 6% concession, seller financing, or rate buy-down credit?
- Built in 1964 — when were the roof, HVAC, electrical panel, plumbing, and water heater last replaced?
- Why hasn't it sold? Are there any deal-killer items the seller is aware of (foundation, flood, title, zoning, code violations)?
- Is there a deadline driving the sale (1031 exchange, divorce, estate, relocation)? That informs how much negotiation room exists.
- Schools are B-rated — typically a magnet for longer-tenancy family renters. What's the average tenant stay here, and is there a school-zone premium baked into asking?
- What's the average days-on-market for RENTAL listings here right now (not sales)? A rising rental-DOM trend means longer vacancies and softer asking-rent achievability than the comps imply.
- What's the recent tenant-quality profile in this submarket — average credit score on applications, eviction rate, late-payment / NSF rate, and stable-employment percentage? A property-management company in the area should have these aggregated.
- How much new for-sale + rental construction is in the pipeline within 1–3 miles? Heavy new supply typically softens prices + rents 12–24 months out; constrained supply supports both.
Investment metrics
- 1% rule
- 1.42% ✓
- Cap rate
- 11.13%
- Cash-on-cash
- 17.28%
- DSCR
- 1.77
- GRM
- 5.9
CMA / ARV
- ARV (median comp)
- $255,286
- List price
- $135,000
- Delta
- -47.12%
- Verdict
- UNDERPRICED
- Comps
- 20 within 1.0 mi
Show comp detail 12 sales within ~0.75 mi
| Address | Dist | Beds/Ba | Sqft | Sold | Price | $/sf | Match |
|---|---|---|---|---|---|---|---|
| 205 Alyce Pl | 0.51mi | 3/2.0 | 1,435 (-0%) | 3mo | $164,900 | $115 | 74 |
| 259 Reinike Rd | 0.59mi | 3/2.0 | 1,415 (-2%) | 7mo | $191,000 | $135 | 64 |
| 216 West Ave | 0.62mi | 3/2.0 | 1,465 (+2%) | 6mo | $439,000 | $300 | 63 |
| 220 Oak Gardens Ave | 0.54mi | 3/2.0 | 1,488 (+3%) | 11mo | $489,000 | $329 | 60 |
| 305 Rita Ln | 0.44mi | 3/2.0 | 1,287 (-11%) | 3mo | $175,350 | $136 | 59 |
| 110 Oak Gardens Ave | 0.45mi | 3/2.0 | 1,324 (-8%) | 9mo | $265,000 | $200 | 58 |
| 909 Latil St | 0.46mi | 3/2.0 | 1,290 (-10%) | 8mo | $204,900 | $159 | 55 |
| 114 Olson Ave | 0.34mi | 4/3.0 (+1) | 1,600 (+11%) | 7mo | $259,000 | $162 | 51 |
| 134 Gandy Cir | 0.73mi | 3/2.0 | 1,400 (-3%) | 13mo | $179,000 | $128 | 51 |
| 117 Oak View Ave | 0.67mi | 3/2.0 | 1,339 (-7%) | 11mo | $369,750 | $276 | 48 |
| 135 Dearman Ave | 0.74mi | 4/2.0 (+1) | 1,512 (+5%) | 12mo | $429,000 | $284 | 42 |
| 117 Gandy Cir | 0.73mi | 3/1.0 | 1,300 (-10%) | 7mo | $133,000 | $102 | 40 |
Match score weights: distance 35% · size 25% · config 20% · recency 20%. Top-matched comps best support the ARV.
Projected returns pro-forma
-3.0% appreciation · 1.93% rent growth · sell at horizon
- IRR
- 7.4%
- Equity multiple
- 1.29×
- Total profit
- $10,805
- Equity at exit
- $20,129
- IRR
- 15.8%
- Equity multiple
- 2.22×
- Total profit
- $46,070
- Equity at exit
- $11,672
Cash invested: $37,800 (down + closing). Projections, not guarantees.
Landlord ↔ Tenant lean methodology
- Overall (STATE)
- 90 Strongly Landlord-Friendly
- State Mississippi
- 90 Strongly Landlord-Friendly · R+11
- County
- — inherits STATE
- City
- — inherits STATE
ZIP-level market 39560
- Home prices YoY
- -25.7%
- Rents YoY
- 1.9%
- Active inventory
- 311
- Price-to-rent
- 5.9×
Monthly cashflow live
- Estimated rent
- $1,912 high interval (Pro) →
- Mortgage (P&I)
- −$708
- Tax from tax record
- −$202 /mo · $2,426/yr
- Insurance
- −$56
- HOA
- −$0
- Vacancy / Maint / Mgmt
- −$402
- Net cashflow
- $544
Break-even live
UW: 25.0% down · 7.5% · 30yr · 1.5% tax · 5.0% vac · 8.0% maint · 8.0% mgmt
Financing live
Cash to close
- Down payment
- $33,750
- Closing costs
- $4,050
- Reserves months
- —
- Total cash needed
- —
Loan-product check · same deal, 3 products live
Conventional
25% down · 7.5% · 30yr
- Down + closing
- —
- Monthly P&I
- —
- Monthly cashflow
- —
- DSCR
- —
- Eligible?
- —
Personal DTI + credit; lowest rate.
DSCR
20% down · 8.5% · 30yr
- Down + closing
- —
- Monthly P&I
- —
- Monthly cashflow
- —
- DSCR
- —
- Eligible?
- —
No personal income docs; deal must DSCR.
Hard money
10% down · 12.0% · 12mo
- Down + closing
- —
- Monthly P&I
- —
- Monthly cashflow
- —
- DSCR
- —
- Eligible?
- —
Short-term bridge; refi at stabilization.
Rent comps 9 comps
| Address | Beds | Baths | Sqft | Rent | $/sqft | DOM | Units | Dist |
|---|---|---|---|---|---|---|---|---|
| 500 E Marigold Dr Long Beach, MS | 4.0 | 2.0 | 1800 | $2,300 | $1.28 | 13d | 1 | 0.16mi |
| 303 Twin Lakes Blvd Long Beach, MS | 3.0 | 2.0 | 1233 | $2,000 | $1.62 | 13d | 1 | 0.30mi |
| 1000 Arbor Station Dr Long Beach, MS | 1.0–3.0 | 1.0–2.0 | 1281 | $1,669 | $1.30 | 11d | 1 | 0.69mi |
| 1033 Enclave Cir Long Beach, MS | 4.0 | 2.0 | 1791 | $2,250 | $1.26 | 20d | 1 | 0.78mi |
| 4401 Beatline Rd Long Beach, MS | 2.0 | 2.0 | 1098 | $1,156 | $1.05 | 43d | 1 | 1.09mi |
| 4401 Beatline Rd Long Beach, MS | 2.0 | 2.0 | 1098 | $1,267 | $1.15 | 20d | 1 | 1.09mi |
| 4401 Beatline Rd Long Beach, MS | 2.0 | 2.0 | 1098 | $1,366 | $1.24 | 13d | 1 | 1.09mi |
| 2012 W Second St Long Beach, MS | 1.0–3.0 | 1.0–2.0 | 1125 | $1,550 | $1.38 | 2d | 17 | 1.18mi |
| 7 Oak Alley Ln Long Beach, MS | 2.0 | 2.5 | 1520 | $2,600 | $1.71 | 13d | 1 | 1.21mi |
Listing history 21 events
-
2026-06-18days on market $135,000 Active 84 DOM
-
2026-06-17days on market $135,000 Active 83 DOM
-
2026-06-16days on market $135,000 Active 82 DOM
-
2026-06-15days on market $135,000 Active 81 DOM
-
2026-06-14days on market $135,000 Active 79 DOM
-
2026-06-13days on market $135,000 Active 78 DOM
-
2026-06-10days on market $135,000 Active 76 DOM
-
2026-06-09days on market $135,000 Active 75 DOM
-
2026-06-08days on market $135,000 Active 74 DOM
-
2026-06-07days on market $135,000 Active 73 DOM
-
2026-06-05days on market $135,000 Active 70 DOM
-
2026-06-02days on market $135,000 Active 68 DOM
-
2026-06-01days on market $135,000 Active 67 DOM
-
2026-05-31days on market $135,000 Active 66 DOM
-
2026-05-30pricedays on market $135,000 Active 65 DOM
-
2026-04-29price $140,000 642-char remark
Show marketing remark (642 chars)
Whether you're looking for a coastal retreat or a permanent residence, this Long Beach gem offers the perfect blend of Southern charm. Bring your updates to this affordable home! This home is located just moments from the white sand beaches and the vibrant energy of downtown Long Beach. Step onto the inviting front porch, the perfect spot for your morning coffee. Inside, it features 3 bedrooms and 2 bathrooms, including a the primary bedroom and bathroom on the lower level for ultimate convenience. The back of the property overlooks a woodline, providing privacy. Schedule your private tour today and start living the coastal lifestyle!
-
2026-03-25$150,000 Active 642-char remark
Show marketing remark (642 chars)
Whether you're looking for a coastal retreat or a permanent residence, this Long Beach gem offers the perfect blend of Southern charm. Bring your updates to this affordable home! This home is located just moments from the white sand beaches and the vibrant energy of downtown Long Beach. Step onto the inviting front porch, the perfect spot for your morning coffee. Inside, it features 3 bedrooms and 2 bathrooms, including a the primary bedroom and bathroom on the lower level for ultimate convenience. The back of the property overlooks a woodline, providing privacy. Schedule your private tour today and start living the coastal lifestyle!
-
2022-02-02historical
-
2022-01-26price $125,000
-
2022-01-20$135,316 Active
-
2013-12-04soldstatus $89,000
ⓘ Source: listings_history table (triggers on properties + properties_extension) + one-shot
backfill from property_details.listing_events for pre-trigger history.
Tax reassessment forecast MS · Resets to sale price
- Current annual tax
- $2,426 · $202/mo
- Projected year-2 tax
- $2,426 · $202/mo
- Expected delta
- $0/yr ($0/mo · 0.0%)
ⓘ Screening estimate from a state-policy table — verify with the county assessor before closing.
Climate risk First Street
- Flood 1/10 Low FEMA zone X (unshaded) · 0% chance over 30 yrs
- Wildfire 1/10 Low
- Heat 10/10 Extreme 7 d/yr ≥106°F today · 23 d/yr by 30 yrs out
- Wind 9/10 Extreme 99% chance of damaging wind over 30 yrs
- Air quality 1/10 Low 0 unhealthy d/yr today · 0 by 30 yrs out
Nearby sold comps map
Loading sold comps map…
Walkable amenities ~0.75 mi
Loading nearby amenities…
Taxation est. · year 1
- Rental income
- $22,947
- − Mortgage interest
- −$7,562
- − Property taxes
- −$2,426
- − Insurance
- −$675
- − Repairs & maintenance
- −$1,836
- − Management
- −$1,836
- − Depreciation
- −$3,927
- Taxable income
- $4,685
- Est. tax owed @ 24.0%
- −$1,124
- After-tax cash flow
- $5,407/yr
For passive investors: Depreciation is non-cash, so a rental often shows a tax loss while cash-flowing — sheltering income. Rental losses are passive: they offset passive income freely, and up to $25,000/yr can offset ordinary (W-2) income if you actively participate and your MAGI is under $100k (phasing out to $0 by $150k); unused losses carry forward. On sale, claimed depreciation is recaptured at up to 25%, and gains may owe capital-gains tax (a 1031 exchange can defer both). Figures are a year-1 estimate at your 24.0% rate — not tax advice; consult a CPA.
Schools (NCES district)
- District
- Long Beach School District
- NCES district ID
- 2802670
- Math proficiency
- 52% ▼ -8.00%
- Reading proficiency
- 50% ▼ -7.00%
- Median HH income
- $50,548
- Composite
- 43.68/100
- National rank
- #2955
- State rank
- #9 of 130 in MS
Livability — Long Beach
- Score
- 69/100
- State rank
- #52
- US rank
- #8554
Category grades
Schools grade is shown separately in the Schools card above.
Census & demographics
- Census place
- Long Beach, MS
- County
- Harrison County · 178,171 people
- City population
- 18,702
- Metro
- Gulfport-Biloxi, MS
- Population (ZIP)
- 18,702
- Household income
- $69,769
- Rent vs Own
- Severe rent burden
- 658.0
Population outlook (Harrison County) Hauer SSP2
- Today (2025)
- 228,444 people
- By 2030
- 241,942 · +5.9%
- By 2040
- 267,531 · +17.1%
- By 2050
- 291,062 · +27.4%
- By 2075
- 346,711 · +51.8%
- By 2100
- 378,165 · +65.5%
Race, ethnicity, and origin ACS 2023
- Neighborhood character
- Predominantly White (80%)
- Race & ethnicity
- White 80% Black 10% Two or more races 7% Hispanic / Latino 3% Asian 2%
- Common ancestry
- Lithuanian 6% Slovak 2% Serbian 1%
- Foreign-born
- 5% · Canada, South Korea
- Languages at home
- 94% English-only · Spanish 2% Other Indo-European 2% Tagalog/Filipino 1%
Political lean MEDSL · Harrison
- 2024 margin
- Strong R (+28.9) · D 35.0% · R 63.9% · Other 1.1%
- 2008→2024 swing
- -2.9pp toward R · 2008: -26.0pp · 2024: -28.9pp
- All cycles
- 2024: R+28.9 2020: R+25.2 2016: R+30.7 2012: R+26.6 2008: R+26.0
Not yet ingested
- Civics
- —
Market trends
- HPI YoY
- ▼ -67.49%
- Current HPI
- 195.0807
- Rent YoY
- ▲ 1.93%
- Metro
- Gulfport-Biloxi, MS
- State GDP YoY
- —
- F500 in state
- 0
Price history
+57.3% since first listed6 events — show timeline
- 2026-04-29 Price Changed $140,000 MLSU
- 2026-03-25 Listed $150,000 MLSU
- 2022-02-02 Listing Removed — MLSU
- 2022-01-26 Price Changed $125,000 MLSU
- 2022-01-20 Listed $135,316 MLSU
- 2013-12-04 Sold (Public Records) $89,000 Public Records
Property tax history
+8.4%/yrLatest (2025): $2,426 · +98.5% YoY. Source: county tax records.
Cash-flow waterfall
monthlySold comps — $/sqft
last 12 mo · ≤1 miLoading sold comps…