1707 N Prospect Ave Unit 7E · Milwaukee, WI
Flood risk 1/10 · Minimal
- FEMA flood zone
- X (unshaded)
- Chance of flooding over 30 yrs
- 0.0%
- Est. flood insurance / yr
- $507 – $1,088
Fire risk 1/10 · Minimal
- Est. fire insurance / yr
- $636 – $1,182
Heat risk 2/10 · Minimal
- Hot days now (above 96°F)
- 7 days/yr
- Hot days in 30 yrs
- 13 days/yr
Wind risk 2/10 · Minimal
- Chance of severe wind over 30 yrs
- —
Air-quality risk 3/10 · Minor
- Unhealthy air days now
- 3 days/yr
- Unhealthy air days in 30 yrs
- 4 days/yr
Risk factors via First Street. Map © Google.
Why this score? — see what drove the D grade
The composite is a weighted blend of 9 inputs, each scored 0–100. Each bar is that input's sub-score; the figure is the points it added to the 100-point composite (weight × sub-score).
- Cash flow +15.0/30.0
- ARV discount +7.5/15.0
- 1% rule +5.0/10.0
- DSCR +5.0/10.0
- Livability +4.0/5.0
- Condition / age +3.8/5.0
- Rent growth +2.9/5.0
- Schools +1.2/10.0
- Appreciation +0.0/10.0
$1
🖨 Deal sheet 📄 Offer letter ✓ Due diligence
Listing remarks MLS
COMING SOON!!
Key facts
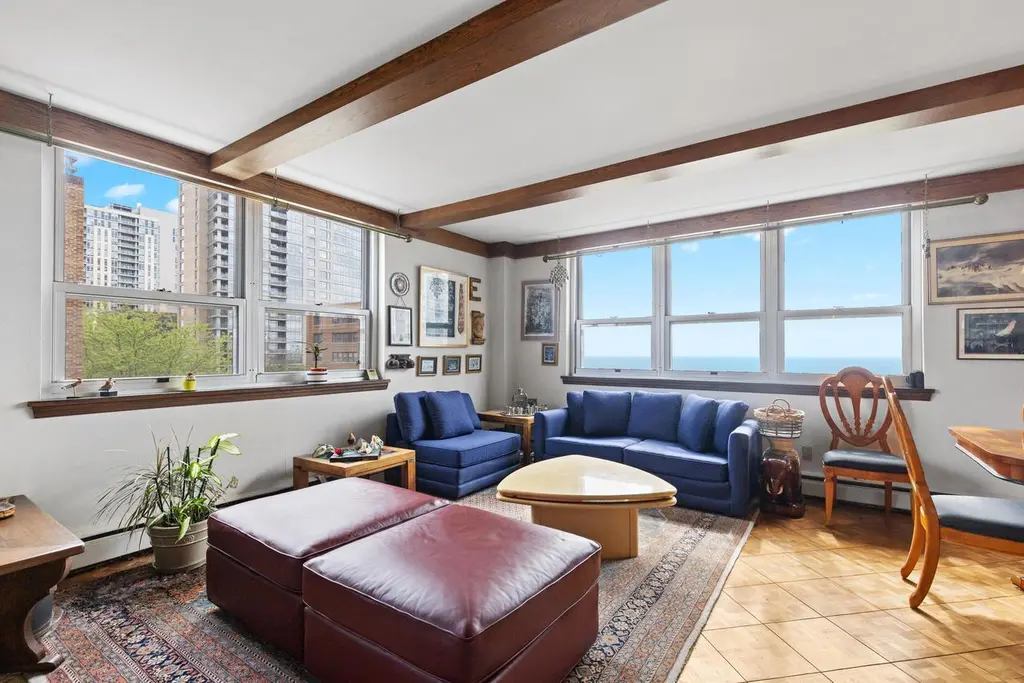
- Parquet floors
- Ample cabinetry
- Exposed beams
Tags
Property features AI
Finance
- Other: Zoning: RM7; Inclusions: stove, two refrigerators, dishwasher, swiss oven; Exclusions: seller's personal property
- Financial info: Pets permitted
- HOA & community: Monthly condo fee: $1,170; Building amenities include elevator, laundry facilities, and security; 76 units in the building / association
Exterior
- Parking: Assigned parking space; Attached underground 1-car garage
- Security: Building security
- Utilities: Municipal water; Municipal sewer; Natural gas
- Home design: Condo in a highrise (6+ stories); One-story unit; Edgewater Terrace condominium
- Construction: Brick / brick and stone construction; Year built per assessor/public record
- Exterior features: Brick and brick/stone exterior; Water views
Interior
- Kitchen: Dishwasher; Range/oven; Refrigerator; Swiss oven
- Bedrooms: Master bedroom with private bath
- Bathrooms: Three full bathrooms
- Heating & cooling: Central air conditioning; Radiant / hot water heat; Natural gas heat
- Interior features: Storage lockers; Walk-in closets; No basement (slab)
- Laundry & utility: Building laundry facilities
Neighborhood map
What this means for you Summary
Snapshot
- This is a 3-bed/3.0-bath condo listed at $1. Condition is rated good.
Deal economics
- At list price, monthly cash flow is $337 ($4k/yr) — positive.
- The deal already cash-flows at list — no discount required.
- Meets the 1% rule at list price ($2k rent vs $1).
- Cap rate 403938.3% vs local median 5.1% in Milwaukee — top-decile yield for the area; either an underpriced asset or a hidden risk that comps aren't pricing in. Stress-test before assuming the spread holds.
Location & tenants
- Location reads 81/100 on livability (#55 in WI, #1,534 nationally) — a professional / high-income tenant draw. Strengths: amenities A+, commute A+, cost of living A+; Watch: employment D+, schools F, crime F.
- Milwaukee School District (urban): math 10% / reading 18% proficiency, ranked #337 of 342 in WI (top 98%) — low school quality limits family demand, transient renter base, plan for 1-2y turnover; 77% free/reduced lunch — lower-income household profile, screen leases tightly.
- Market conditions: Rents rising (+1.6%/yr); 146 active listings in the ZIP; 40 comparable units currently listed for rent nearby; rentals at typical pace (median 17d on market — plan ~3-4 weeks tenant-placement turnaround); 40% of comp listings sitting > 30 days — soft ceiling on asking rent; 1,017 units permitted in Milwaukee County in 2024 (803 in 5+ unit buildings).
- This rent runs 32% of the median local income ($71k/yr) — at the standard rent-burdened threshold; future hikes will face affordability resistance.
Forward outlook
- Local home prices are declining (-3.0%/yr); year-one equity from $0 of loan paydown is wiped out by about $0 of value loss. Plan a longer hold.
- Milwaukee County population projected at +4% by 2050 — modest demand growth; plan on rents tracking national, not racing it.
- At projected returns (-3.0% appreciation + 1.6% rent growth), your $0 cash investment doubles in ~1 year — after that, you're playing with house money.
Negotiation context
- It's been on market 28 days — a 2% lower offer ($0) is reasonable based on typical stale-listing flexibility.
- 2 sale attempts with the ask held roughly flat each time — persistent listings suggest the price (not the market) is what's stuck; bring a comps-based counter.
Risks & watch-outs
- Watch-outs: HOA is 61% of rent.
Questions for the listing agent
- Built in 1967 — when were the roof, HVAC, electrical panel, plumbing, and water heater last replaced?
- What does the HOA fee cover, when was the last increase, and are there any pending special assessments or reserve-fund shortfalls?
- Any open or pending special assessments — roof, HVAC, plumbing, elevator, façade? What's the per-unit balance and payoff schedule, and is the seller paying it off at close or rolling it to the buyer?
- Is there a deadline driving the sale (1031 exchange, divorce, estate, relocation)? That informs how much negotiation room exists.
- Schools are F-rated, which usually means shorter tenancies and higher turnover. Who's the typical renter profile here, and what's been the actual vacancy rate?
- Crime grade is F in this area — have there been break-ins, vandalism, or insurance claims at this property in the last 3 years? What carrier currently insures it and at what premium?
- The area grade is low — what's the realistic commute time and amenity access for the typical tenant pool here? Any planned neighborhood developments (good or bad) we should know about?
- What's the average days-on-market for RENTAL listings here right now (not sales)? A rising rental-DOM trend means longer vacancies and softer asking-rent achievability than the comps imply.
- What's the recent tenant-quality profile in this submarket — average credit score on applications, eviction rate, late-payment / NSF rate, and stable-employment percentage? A property-management company in the area should have these aggregated.
- How much new apartment / multifamily construction is in the pipeline within 1–3 miles? Heavy new supply (>2% of stock underway) typically softens rents 12–24 months out; light construction supports rent growth.
Investment metrics
- 1% rule
- 190711.00% ✓
- Cap rate
- 403938.28%
- Cash-on-cash
- 1442614.24%
- DSCR
- 64189.22
- GRM
- 0.0
CMA / ARV
No comps found within radius.
Projected returns pro-forma
-3.0% appreciation · 1.56% rent growth · sell at horizon
- IRR
- —
- Equity multiple
- 69509.17×
- Total profit
- $19,462
- Equity at exit
- $0
- IRR
- —
- Equity multiple
- 131186.22×
- Total profit
- $36,732
- Equity at exit
- $0
Cash invested: $0 (down + closing). Projections, not guarantees.
Landlord ↔ Tenant lean methodology
- Overall (STATE)
- 73 Landlord-Friendly
- State Wisconsin
- 73 Landlord-Friendly · R+2
- County
- — inherits STATE
- City
- — inherits STATE
ZIP-level market 53202
- Rents YoY
- 1.6%
- Active inventory
- 146
Monthly cashflow live
- Estimated rent
- $1,907 high interval (Pro) →
- Mortgage (P&I)
- −$0
- Tax est. 1.5%
- −$0 /mo · $0/yr
- Insurance
- −$0
- HOA
- −$1,170
- Vacancy / Maint / Mgmt
- −$400
- Net cashflow
- $337
Break-even live
UW: 25.0% down · 7.5% · 30yr · 1.5% tax · 5.0% vac · 8.0% maint · 8.0% mgmt
Financing live
Cash to close
- Down payment
- $0
- Closing costs
- $0
- Reserves months
- —
- Total cash needed
- —
Loan-product check · same deal, 3 products live
Conventional
25% down · 7.5% · 30yr
- Down + closing
- —
- Monthly P&I
- —
- Monthly cashflow
- —
- DSCR
- —
- Eligible?
- —
Personal DTI + credit; lowest rate.
DSCR
20% down · 8.5% · 30yr
- Down + closing
- —
- Monthly P&I
- —
- Monthly cashflow
- —
- DSCR
- —
- Eligible?
- —
No personal income docs; deal must DSCR.
Hard money
10% down · 12.0% · 12mo
- Down + closing
- —
- Monthly P&I
- —
- Monthly cashflow
- —
- DSCR
- —
- Eligible?
- —
Short-term bridge; refi at stabilization.
Rent comps 40 comps
| Address | Beds | Baths | Sqft | Rent | $/sqft | DOM | Units | Dist |
|---|---|---|---|---|---|---|---|---|
| 1800 N Farwell Ave Milwaukee, WI | 2.0 | 1.0 | 913 | $1,600 | $1.75 | 4d | 3 | 0.07mi |
| 1619 N Farwell Ave #201 Milwaukee, WI | 2.0 | 2.0 | 1322 | $2,600 | $1.97 | 43d | 1 | 0.16mi |
| 1914 N Prospect Ave Milwaukee, WI | 2.0–3.0 | 1.0–1.5 | 1100 | $1,950 | $1.77 | 43d | 4 | 0.18mi |
| 1506 E Kane Pl Milwaukee, WI | 2.0 | 1.0 | 950 | $1,400 | $1.47 | 4d | 1 | 0.23mi |
| 1579 N Warren Ave Milwaukee, WI | 3.0 | 1.0 | 1200 | $1,500 | $1.25 | 43d | 1 | 0.27mi |
| 1219 E Kane Pl Milwaukee, WI | 2.0 | 1.0 | 1250 | $1,800 | $1.44 | 43d | 1 | 0.31mi |
| 2036 N Prospect Ave Milwaukee, WI | 1.0–2.0 | 1.0–2.5 | 1196 | $3,336 | $2.79 | 2d | 18 | 0.32mi |
| 1604 N Franklin Pl Milwaukee, WI | 2.0 | 1.0 | 1100 | $1,500 | $1.36 | 14d | 1 | 0.33mi |
| 2018 N Oakland Ave Apt 106 Milwaukee, WI | 2.0 | 1.0 | 1220 | $1,475 | $1.21 | 4d | 1 | 0.33mi |
| 1116 E Hamilton St Milwaukee, WI | 3.0 | 2.0 | 1400 | $1,750 | $1.25 | 16d | 1 | 0.35mi |
| 1669 N Humboldt Ave Milwaukee, WI | 2.0 | 1.0 | 950 | $1,745 | $1.84 | 4d | 1 | 0.38mi |
| 1025 E Land Pl Milwaukee, WI | 3.0 | 1.0 | 1560 | $1,750 | $1.12 | 23d | 1 | 0.41mi |
| 1703 N Astor St Milwaukee, WI | 4.0 | 2.0 | 1800 | $2,200 | $1.22 | 43d | 1 | 0.45mi |
| 1925 N Water St #202 Milwaukee, WI | 2.0 | 2.0 | 1576 | $2,300 | $1.46 | 43d | 1 | 0.45mi |
| 2130 N Commerce St Milwaukee, WI | 2.0 | 2.5 | 1550 | $2,495 | $1.61 | 43d | 1 | 0.46mi |
| 1633 E North Ave Milwaukee, WI | 2.0 | 1.0 | 1110 | $1,900 | $1.71 | 2d | 3 | 0.47mi |
| 1660 N Marshall St Unit 2 Milwaukee, WI | 2.0 | 1.0 | 1390 | $2,175 | $1.56 | 43d | 1 | 0.49mi |
| 818 E Brady St Unit 820 Milwaukee, WI | 3.0 | 1.0 | 1200 | $1,700 | $1.42 | 43d | 1 | 0.53mi |
| 1845 N Water St Milwaukee, WI | 3.0 | 1.0–2.0 | 948 | $4,455 | $4.70 | 3d | 84 | 0.55mi |
| 1018 E Knapp St Milwaukee, WI | 2.0 | 2.0 | 907 | $1,395 | $1.54 | 14d | 1 | 0.57mi |
| 2340 N Cramer St Unit 515 Milwaukee, WI | 2.0 | 2.0 | 1034 | $1,925 | $1.86 | 4d | 1 | 0.59mi |
| 1902 N Commerce St Milwaukee, WI | 2.0 | 1.0 | 974 | $1,895 | $1.95 | 43d | 1 | 0.67mi |
| 2405 N Frederick Ave Unit 2405 Frederick Milwaukee, WI | 3.0 | 1.0 | 1000 | $1,675 | $1.68 | 4d | 1 | 0.67mi |
| 2407 N Frederick Ave Unit 2407 Frederick Milwaukee, WI | 3.0 | 1.0 | 1000 | $1,700 | $1.70 | 16d | 1 | 0.67mi |
| 1530 N Jackson St Unit 401 Milwaukee, WI | 2.0 | 2.0 | 1125 | $2,225 | $1.98 | 43d | 1 | 0.70mi |
| 1530 N Jackson St Unit 404 Milwaukee, WI | 2.0 | 2.0 | 1125 | $2,150 | $1.91 | 16d | 1 | 0.70mi |
| 1506 N Jackson St Milwaukee, WI | 2.0 | 1.0 | 1100 | $1,600 | $1.45 | 16d | 1 | 0.72mi |
| 1531 N Jackson St Milwaukee, WI | 2.0 | 1.0 | 1285 | $1,625 | $1.26 | 16d | 1 | 0.74mi |
| 1858 N Commerce St Milwaukee, WI | 2.0 | 1.0–2.0 | 1124 | $1,520 | $1.35 | 14d | 2 | 0.75mi |
| 2105 N Booth St Unit 2105-5 Milwaukee, WI | 2.0 | 1.0 | 1000 | $1,799 | $1.80 | 16d | 1 | 0.76mi |
| 1040 N Cass St Milwaukee, WI | 1.0–3.0 | 1.0–2.0 | 2025 | $7,750 | $3.83 | 2d | 9 | 0.78mi |
| 1237 N Van Buren St Milwaukee, WI | 1.0–2.0 | 1.0–2.5 | 1047 | $3,700 | $3.53 | 2d | 18 | 0.80mi |
| 2429 N Weil St Milwaukee, WI | 3.0 | 1.0 | 1300 | $1,500 | $1.15 | 43d | 1 | 0.80mi |
| 709 E Juneau Ave Apt 309 Milwaukee, WI | 2.0 | 1.0 | 975 | $1,300 | $1.33 | 43d | 1 | 0.80mi |
| 709 E Juneau Ave Unit 109 Milwaukee, WI | 2.0 | 1.0 | 975 | $1,200 | $1.23 | 4d | 1 | 0.80mi |
| 709 E Juneau Ave Unit 403-401 Milwaukee, WI | 2.0 | 2.0 | 900 | $1,400 | $1.56 | 43d | 1 | 0.80mi |
| 709 E Juneau Ave Unit 2 Milwaukee, WI | 2.0 | 1.0 | 900 | $1,200 | $1.33 | 43d | 1 | 0.80mi |
| 2442 N Bremen St Milwaukee, WI | 2.0 | 1.0 | 1100 | $1,495 | $1.36 | 43d | 1 | 0.83mi |
| 1551 N Water St Milwaukee, WI | 3.0 | 1.0–2.0 | 1074 | $3,395 | $3.16 | 2d | 52 | 0.84mi |
| 2518 N Humboldt Blvd Unit 2518 Lower Milwaukee, WI | 2.0 | 1.0 | 1246 | $1,275 | $1.02 | 16d | 1 | 0.85mi |
HOA detail condo
- Monthly dues
- $1,170 · $14,040/yr
- Assessments
- None detected in remarks — confirm with the listing agent.
Listing history 17 events
-
2026-06-18days on market $1 Active 28 DOM
-
2026-06-17days on market $1 Active 27 DOM
-
2026-06-16days on market $1 Active 26 DOM
-
2026-06-15days on market $1 Active 25 DOM
-
2026-06-13days on market $1 Active 23 DOM
-
2026-06-13days on market $1 Active 22 DOM
-
2026-06-09days on market $1 Active 19 DOM
-
2026-06-08days on market $1 Active 18 DOM
-
2026-06-07days on market $1 Active 17 DOM
-
2026-06-05days on market $1 Active 14 DOM
-
2026-06-03days on market $1 Active 13 DOM
-
2026-06-02days on market $1 Active 12 DOM
-
2026-06-01days on market $1 Active 11 DOM
-
2026-05-31days on market $1 Active 10 DOM
-
2026-05-07historical 13-char remark
Show marketing remark (13 chars)
COMING SOON!!
-
2026-05-07$349,900 Active 13-char remark
Show marketing remark (13 chars)
COMING SOON!!
-
2026-04-30historical $349,900 13-char remark
Show marketing remark (13 chars)
COMING SOON!!
ⓘ Source: listings_history table (triggers on properties + properties_extension) + one-shot
backfill from property_details.listing_events for pre-trigger history.
Climate risk First Street
- Flood 1/10 Low FEMA zone X (unshaded) · 0% chance over 30 yrs
- Wildfire 1/10 Low
- Heat 2/10 Low 7 d/yr ≥96°F today · 13 d/yr by 30 yrs out
- Wind 2/10 Low
- Air quality 3/10 Moderate 3 unhealthy d/yr today · 4 by 30 yrs out
Nearby sold comps map
Loading sold comps map…
Walkable amenities ~0.75 mi
Loading nearby amenities…
Taxation est. · year 1
- Rental income
- $22,885
- − Mortgage interest
- −$0
- − Property taxes
- −$0
- − Insurance
- −$0
- − Repairs & maintenance
- −$1,831
- − Management
- −$1,831
- − HOA
- −$14,040
- − Depreciation
- −$0
- Taxable income
- $5,184
- Est. tax owed @ 24.0%
- −$1,244
- After-tax cash flow
- $2,795/yr
For passive investors: Depreciation is non-cash, so a rental often shows a tax loss while cash-flowing — sheltering income. Rental losses are passive: they offset passive income freely, and up to $25,000/yr can offset ordinary (W-2) income if you actively participate and your MAGI is under $100k (phasing out to $0 by $150k); unused losses carry forward. On sale, claimed depreciation is recaptured at up to 25%, and gains may owe capital-gains tax (a 1031 exchange can defer both). Figures are a year-1 estimate at your 24.0% rate — not tax advice; consult a CPA.
Condition & rehab AI · 30 photos
This spacious 3-bedroom, 3-bath double-unit condo at Edgewater Terrace offers sweeping views of Lake Michigan and downtown skyline. The home is in good condition with minimal repairs needed and is ready for a new owner.
Value-add opportunities
- Resale Paint the interior walls — Fresh paint can make the interior look more modern and appealing.
- Resale Replace the window treatments — New window treatments can enhance the home's curb appeal and make it more attractive to potential buyers.
- Rental Clean the carpets — Clean carpets can make the home more inviting and appealing to renters.
Renovation cost estimate screening
Value-add ROI direction
- Resale Paint the interior walls — Fresh paint can make the interior look more modern and appealing. ↑
- Resale Replace the window treatments — New window treatments can enhance the home's curb appeal and make it more attractive to potential buyers. ↑
- Rental Clean the carpets — Clean carpets can make the home more inviting and appealing to renters. ↑
ⓘ Cost ranges are severity-bucket heuristics (US national rule-of-thumb). Get contractor quotes + a written scope before underwriting a rehab budget.
Schools (NCES district)
- District
- Milwaukee School District
- NCES district ID
- 5509600
- Math proficiency
- 10% ▼ -5.00%
- Reading proficiency
- 18% ▬ 0.00%
- Median HH income
- $36,339
- Composite
- 11.61/100
- National rank
- #9696
- State rank
- #337 of 342 in WI
Livability — Milwaukee
- Score
- 81/100
- State rank
- #55
- US rank
- #1534
Category grades
Schools grade is shown separately in the Schools card above.
Census & demographics
- Census place
- Milwaukee, WI
- County
- Milwaukee County · 926,379 people
- City population
- 573,768
- Metro
- Milwaukee-Waukesha, WI
- Population (ZIP)
- 25,861
- Household income
- $71,034
- Rent vs Own
- Severe rent burden
- 2752.0
Population outlook (Milwaukee County) Hauer SSP2
- Today (2025)
- 995,758 people
- By 2030
- 1,009,124 · +1.3%
- By 2040
- 1,028,128 · +3.3%
- By 2050
- 1,040,066 · +4.4%
- By 2075
- 1,057,849 · +6.2%
- By 2100
- 1,039,774 · +4.4%
Race, ethnicity, and origin ACS 2023
- Neighborhood character
- Predominantly White (75%)
- Race & ethnicity
- White 75% Black 8% Two or more races 6% Hispanic / Latino 6% Asian 5%
- Hispanic origin (detail)
- Mexican 3%
- Common ancestry
- Romanian 9% Portuguese 4% Lithuanian 2%
- Foreign-born
- 10% · Canada, South Korea
- Languages at home
- 89% English-only · Spanish 4% Other Indo-European 2% Other Asian/Pacific 1%
Political lean MEDSL · Milwaukee
- 2024 margin
- Solid D (+38.5) · D 68.3% · R 29.8% · Other 1.8%
- 2008→2024 swing
- +2.7pp toward D · 2008: 35.9pp · 2024: 38.5pp
- All cycles
- 2024: D+38.5 2020: D+39.9 2016: D+37.5 2012: D+34.6 2008: D+35.9
Not yet ingested
- Civics
- —
Market trends
- HPI YoY
- ▼ -133.46%
- Current HPI
- 226.4316
- Rent YoY
- ▲ 1.56%
- Metro
- Milwaukee-Waukesha, WI
- State GDP YoY
- ▲ 2.10%
- F500 in state
- 20
Industry mix (Fortune 500 HQ in WI)
| Industry | F500 HQs | Revenue |
|---|---|---|
| Industrial Machinery | 4 | $23B |
|
||
| Industrial Technology | 2 | $36B |
|
||
| Insurance | 1 | $36B |
|
||
| Professional Services | 1 | $19B |
|
||
| Utilities | 1 | $9B |
|
||
| Consumer Goods | 1 | $3B |
|
||
Price history
+0.0% since first listed4 events — show timeline
- 2026-05-21 Listed $1 METROMLS
- 2026-05-07 Listing Removed — METROMLS
- 2026-05-07 Listed $349,900 METROMLS
- 2026-04-30 Coming Soon $349,900 METROMLS
Property tax history
+3.3%/yrLatest (2024): $7,755 · +6.1% YoY. Source: county tax records.
Cash-flow waterfall
monthlySold comps — $/sqft
last 12 mo · ≤1 miLoading sold comps…