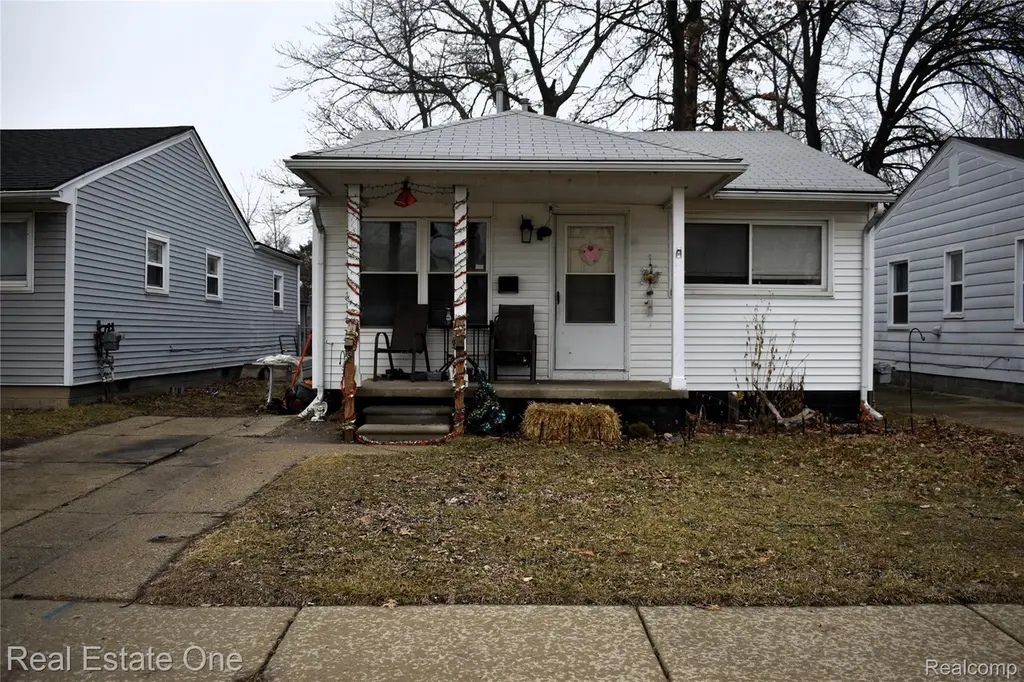
11319 Sherman Ave · Warren, MI
Flood risk 3/10 · Minor
- FEMA flood zone
- X (unshaded)
- Chance of flooding over 30 yrs
- 0.1%
- Est. flood insurance / yr
- $507 – $1,088
Fire risk 1/10 · Minimal
- Est. fire insurance / yr
- $784 – $1,456
Heat risk 3/10 · Minor
- Hot days now (above 96°F)
- 7 days/yr
- Hot days in 30 yrs
- 15 days/yr
Wind risk 1/10 · Minimal
- Chance of severe wind over 30 yrs
- —
Air-quality risk 3/10 · Minor
- Unhealthy air days now
- 3 days/yr
- Unhealthy air days in 30 yrs
- 4 days/yr
Risk factors via First Street. Map © Google.
Why this score? — see what drove the B- grade
The composite is a weighted blend of 9 inputs, each scored 0–100. Each bar is that input's sub-score; the figure is the points it added to the 100-point composite (weight × sub-score).
- Cash flow +29.7/30.0
- ARV discount +10.7/15.0
- DSCR +10.0/10.0
- 1% rule +7.8/10.0
- Livability +3.7/5.0
- Rent growth +3.2/5.0
- Condition / age +2.5/5.0
- Schools +1.0/10.0
- Appreciation +0.0/10.0
$94,900
🖨 Deal sheet 📄 Offer letter ✓ Due diligence
Listing remarks MLS
* * 24 hr notice to show * * Investment opportunity- 2 bedroom ranch in Warren! Build up your portfolio! Currently tenant occupied and they would love to stay! Instant income-appliances included. Conveniently located close to shopping, restaurants and major freeway. Call for details -BATAVI
Key facts
- Tenant occupied
- Appliances included
- Conveniently located
Tags
Neighborhood map
What this means for you Summary
Snapshot
- This is a 2-bed/1.0-bath single-family listed at $95k.
Deal economics
- At list price, monthly cash flow is $345 ($4k/yr) — positive.
- The deal already cash-flows at list — no discount required.
- Meets the 1% rule at list price ($1k rent vs $95k).
- Recommended offer: $86k (9.0% below list) — sets the bar for market timing.
- Cap rate 10.7% vs local median 5.3% in Warren — top-decile yield for the area; either an underpriced asset or a hidden risk that comps aren't pricing in. Stress-test before assuming the spread holds.
Location & tenants
- Location reads 74/100 on livability (#171 in MI, #4,491 nationally) — a middle-class / working-renter tenant base. Strengths: commute A+, cost of living A+, housing A+; Watch: schools D, amenities D, employment D.
- Van Dyke Public Schools (urban): math 7% / reading 19% proficiency, ranked #512 of 540 in MI (top 95%) — low school quality limits family demand, transient renter base, plan for 1-2y turnover; 80% free/reduced lunch — lower-income household profile, screen leases tightly.
- Market conditions: Rents rising (+2.9%/yr); 160 active listings in the ZIP; 12 comparable units currently listed for rent nearby; rentals lingering (median 44d on market — plan ~5-8 weeks vacancy on turnover, expect pricing pressure); 58% of comp listings sitting > 30 days — soft ceiling on asking rent; 1,321 units permitted in Macomb County in 2024 (86 in 5+ unit buildings).
Forward outlook
- Local home prices are declining (-3.0%/yr); year-one equity from $656 of loan paydown is wiped out by about $3k of value loss. Plan a longer hold.
- Macomb County population projected at +9% by 2050 — modest demand growth; plan on rents tracking national, not racing it.
- At projected returns (-3.0% appreciation + 2.9% rent growth), your $27k cash investment doubles in ~8 years — after that, you're playing with house money.
Negotiation context
- It's been on market 102 days — a 9% lower offer ($86k) is reasonable based on typical stale-listing flexibility.
- 2 sale attempts; this cycle's ask has dropped $10k (10%) from the opening price — seller is motivated, your offer sets the floor, not the list.
Risks & watch-outs
- Watch-outs: built in 1955 — expect roof / HVAC / electrical / plumbing capex.
Questions for the listing agent
- It's been on market 102 days. Have you received any prior offers? Is the seller open to a 9% concession, seller financing, or rate buy-down credit?
- Built in 1955 — when were the roof, HVAC, electrical panel, plumbing, and water heater last replaced?
- Why hasn't it sold? Are there any deal-killer items the seller is aware of (foundation, flood, title, zoning, code violations)?
- Is there a deadline driving the sale (1031 exchange, divorce, estate, relocation)? That informs how much negotiation room exists.
- Schools are D-rated, which usually means shorter tenancies and higher turnover. Who's the typical renter profile here, and what's been the actual vacancy rate?
- Crime grade is D in this area — have there been break-ins, vandalism, or insurance claims at this property in the last 3 years? What carrier currently insures it and at what premium?
- What's the average days-on-market for RENTAL listings here right now (not sales)? A rising rental-DOM trend means longer vacancies and softer asking-rent achievability than the comps imply.
- What's the recent tenant-quality profile in this submarket — average credit score on applications, eviction rate, late-payment / NSF rate, and stable-employment percentage? A property-management company in the area should have these aggregated.
- How much new for-sale + rental construction is in the pipeline within 1–3 miles? Heavy new supply typically softens prices + rents 12–24 months out; constrained supply supports both.
Investment metrics
- 1% rule
- 1.28% ✓
- Cap rate
- 10.66%
- Cash-on-cash
- 15.59%
- DSCR
- 1.69
- GRM
- 6.5
CMA / ARV
- ARV (median comp)
- $102,117
- List price
- $94,900
- Delta
- -7.07%
- Verdict
- FAIR
- Comps
- 20 within 1.0 mi
Show comp detail 12 sales within ~0.75 mi
| Address | Dist | Beds/Ba | Sqft | Sold | Price | $/sf | Match |
|---|---|---|---|---|---|---|---|
| 11310 Chalmers Ave | 0.30mi | 2/1.0 | 696 (-3%) | 2mo | $97,000 | $139 | 79 |
| 11280 Chalmers Ave | 0.31mi | 2/1.0 | 696 (-3%) | 3mo | $94,000 | $135 | 78 |
| 8701 Toepfer Rd | 0.40mi | 3/1.0 (+1) | 720 (0%) | 3mo | $80,000 | $111 | 74 |
| 8477 Prospect Ave | 0.44mi | 2/1.0 | 696 (-3%) | 1mo | $90,000 | $129 | 73 |
| 8712 Ford Ave | 0.63mi | 2/1.0 | 704 (-2%) | 3mo | $85,000 | $121 | 65 |
| 20091 Annott St | 0.64mi | 2/1.0 | 747 (+4%) | 1mo | $12,800 | $17 | 63 |
| 20520 Dresden St | 0.62mi | 2/1.5 | 680 (-6%) | 0mo | $33,000 | $49 | 60 |
| 12426 Sidonie Ave | 0.69mi | 2/1.0 | 750 (+4%) | 4mo | $131,000 | $175 | 58 |
| 11011 Hupp Ave | 0.58mi | 2/1.0 | 792 (+10%) | 2mo | $90,000 | $114 | 55 |
| 20083 Bradford St | 0.68mi | 2/1.0 | 648 (-10%) | 0mo | $24,000 | $37 | 51 |
| 12484 Sherman Ave | 0.73mi | 2/1.0 | 800 (+11%) | 3mo | $72,000 | $90 | 45 |
| 8101 Rivard Ave | 0.66mi | 2/2.0 | 616 (-14%) | 0mo | $75,000 | $122 | 41 |
Match score weights: distance 35% · size 25% · config 20% · recency 20%. Top-matched comps best support the ARV.
Projected returns pro-forma
-3.0% appreciation · 2.94% rent growth · sell at horizon
- IRR
- 6.3%
- Equity multiple
- 1.25×
- Total profit
- $6,527
- Equity at exit
- $14,150
- IRR
- 15.6%
- Equity multiple
- 2.27×
- Total profit
- $33,665
- Equity at exit
- $8,205
Cash invested: $26,572 (down + closing). Projections, not guarantees.
Landlord ↔ Tenant lean methodology
- Overall (STATE)
- 62 Landlord-Friendly
- State Michigan
- 62 Landlord-Friendly · EVEN
- County
- — inherits STATE
- City
- — inherits STATE
ZIP-level market 48089
- Rents YoY
- 2.9%
- Active inventory
- 160
- Price-to-rent
- 6.5×
Monthly cashflow live
- Estimated rent
- $1,216 high interval (Pro) →
- Mortgage (P&I)
- −$498
- Tax from tax record
- −$78 /mo · $935/yr
- Insurance
- −$40
- HOA
- −$0
- Vacancy / Maint / Mgmt
- −$255
- Net cashflow
- $345
Break-even live
UW: 25.0% down · 7.5% · 30yr · 1.5% tax · 5.0% vac · 8.0% maint · 8.0% mgmt
Financing live
Cash to close
- Down payment
- $23,725
- Closing costs
- $2,847
- Reserves months
- —
- Total cash needed
- —
Loan-product check · same deal, 3 products live
Conventional
25% down · 7.5% · 30yr
- Down + closing
- —
- Monthly P&I
- —
- Monthly cashflow
- —
- DSCR
- —
- Eligible?
- —
Personal DTI + credit; lowest rate.
DSCR
20% down · 8.5% · 30yr
- Down + closing
- —
- Monthly P&I
- —
- Monthly cashflow
- —
- DSCR
- —
- Eligible?
- —
No personal income docs; deal must DSCR.
Hard money
10% down · 12.0% · 12mo
- Down + closing
- —
- Monthly P&I
- —
- Monthly cashflow
- —
- DSCR
- —
- Eligible?
- —
Short-term bridge; refi at stabilization.
Rent comps 12 comps
| Address | Beds | Baths | Sqft | Rent | $/sqft | DOM | Units | Dist |
|---|---|---|---|---|---|---|---|---|
| 11236 Studebaker Ave Warren, MI | 2.0 | 1.0 | 672 | $1,175 | $1.75 | 44d | 1 | 0.37mi |
| 7605 Jackson Ave Warren, MI | 2.0 | 1.0 | 600 | $1,165 | $1.94 | 24d | 1 | 0.80mi |
| 21412 Waltham Rd Warren, MI | 2.0 | 1.0 | 696 | $1,225 | $1.76 | 44d | 1 | 0.82mi |
| 8036 Hupp Ave Warren, MI | 2.0 | 1.0 | 680 | $1,150 | $1.69 | 44d | 1 | 0.90mi |
| 7275 Chalmers Ave Warren, MI | 2.0 | 1.0 | 703 | $1,200 | $1.71 | 24d | 1 | 0.98mi |
| 7033 Westminster Ave Warren, MI | 2.0 | 1.0 | 561 | $1,050 | $1.87 | 44d | 1 | 1.05mi |
| 19335 Hoover St Detroit, MI | 2.0 | 1.0 | 620 | $1,099 | $1.77 | 17d | 1 | 1.09mi |
| 19335 Hoover St Detroit, MI | 2.0 | 1.0 | 620 | $1,099 | $1.77 | 44d | 1 | 1.09mi |
| 8103 Lozier Ave Unit 2 Warren, MI | 1.0 | 1.0 | 600 | $650 | $1.08 | 44d | 1 | 1.21mi |
| 20242 Hickory St Detroit, MI | 3.0 | 1.0 | 747 | $1,300 | $1.74 | 11d | 1 | 1.25mi |
| 11130 Stephens Rd Warren, MI | 2.0 | 1.0 | 750 | $1,300 | $1.73 | 44d | 1 | 1.27mi |
| 18667 Algonac St Detroit, MI | 1.0 | 1.0 | 680 | $1,999 | $2.94 | 17d | 1 | 1.40mi |
Listing history 18 events
-
2026-06-18days on market $94,900 Active 102 DOM
-
2026-06-17days on market $94,900 Active 101 DOM
-
2026-06-16days on market $94,900 Active 100 DOM
-
2026-06-15days on market $94,900 Active 99 DOM
-
2026-06-13days on market $94,900 Active 97 DOM
-
2026-06-13days on market $94,900 Active 96 DOM
-
2026-06-09days on market $94,900 Active 93 DOM
-
2026-06-08days on market $94,900 Active 92 DOM
-
2026-06-07days on market $94,900 Active 91 DOM
-
2026-06-04days on market $94,900 Active 88 DOM
-
2026-06-03days on market $94,900 Active 87 DOM
-
2026-06-02days on market $94,900 Active 86 DOM
-
2026-06-01days on market $94,900 Active 85 DOM
-
2026-05-31days on market $94,900 Active 84 DOM
-
2026-04-23price $99,900 293-char remark
Show marketing remark (293 chars)
* * 24 hr notice to show * * Investment opportunity- 2 bedroom ranch in Warren! Build up your portfolio! Currently tenant occupied and they would love to stay! Instant income-appliances included. Conveniently located close to shopping, restaurants and major freeway. Call for details -BATAVI
-
2026-04-22price $99,900 296-char remark
Show marketing remark (296 chars)
* * 24 hr notice to show * * Investment opportunity- 2 bedroom ranch in Warren! Build up your portfolio! Currently tenant occupied and they would love to stay! Instant income-appliances included. Conveniently located close to shopping, restaurants and major freeway. Call for details -BATAVI
-
2026-03-08$104,900 Active 296-char remark
Show marketing remark (296 chars)
* * 24 hr notice to show * * Investment opportunity- 2 bedroom ranch in Warren! Build up your portfolio! Currently tenant occupied and they would love to stay! Instant income-appliances included. Conveniently located close to shopping, restaurants and major freeway. Call for details -BATAVI
-
2026-03-07$104,900 Active 293-char remark
Show marketing remark (293 chars)
* * 24 hr notice to show * * Investment opportunity- 2 bedroom ranch in Warren! Build up your portfolio! Currently tenant occupied and they would love to stay! Instant income-appliances included. Conveniently located close to shopping, restaurants and major freeway. Call for details -BATAVI
ⓘ Source: listings_history table (triggers on properties + properties_extension) + one-shot
backfill from property_details.listing_events for pre-trigger history.
Tax reassessment forecast MI · Partial reset (capped growth)
- Current annual tax
- $935 · $78/mo
- Projected year-2 tax
- $1,198 · $100/mo
- Expected delta
- +$263/yr (+$22/mo · 28.2%)
ⓘ Screening estimate from a state-policy table — verify with the county assessor before closing.
Climate risk First Street
- Flood 3/10 Moderate FEMA zone X (unshaded) · 10% chance over 30 yrs
- Wildfire 1/10 Low
- Heat 3/10 Moderate 7 d/yr ≥96°F today · 15 d/yr by 30 yrs out
- Wind 1/10 Low
- Air quality 3/10 Moderate 3 unhealthy d/yr today · 4 by 30 yrs out
Nearby sold comps map
Loading sold comps map…
Walkable amenities ~0.75 mi
Loading nearby amenities…
Taxation est. · year 1
- Rental income
- $14,586
- − Mortgage interest
- −$5,316
- − Property taxes
- −$935
- − Insurance
- −$474
- − Repairs & maintenance
- −$1,167
- − Management
- −$1,167
- − Depreciation
- −$2,761
- Taxable income
- $2,767
- Est. tax owed @ 24.0%
- −$664
- After-tax cash flow
- $3,478/yr
For passive investors: Depreciation is non-cash, so a rental often shows a tax loss while cash-flowing — sheltering income. Rental losses are passive: they offset passive income freely, and up to $25,000/yr can offset ordinary (W-2) income if you actively participate and your MAGI is under $100k (phasing out to $0 by $150k); unused losses carry forward. On sale, claimed depreciation is recaptured at up to 25%, and gains may owe capital-gains tax (a 1031 exchange can defer both). Figures are a year-1 estimate at your 24.0% rate — not tax advice; consult a CPA.
Schools (NCES district)
- District
- Van Dyke Public Schools
- NCES district ID
- 2634680
- Math proficiency
- 7% ▼ -11.00%
- Reading proficiency
- 19% ▼ -5.00%
- Median HH income
- $33,231
- Composite
- 10.46/100
- National rank
- #9784
- State rank
- #512 of 540 in MI
Livability — Warren
- Score
- 74/100
- State rank
- #171
- US rank
- #4491
Category grades
Schools grade is shown separately in the Schools card above.
Census & demographics
- Census place
- Warren, MI
- County
- Macomb County · 638,552 people
- City population
- 114,937
- Metro
- Detroit-Warren-Dearborn, MI
- Population (ZIP)
- 31,853
- Household income
- $52,366
- Rent vs Own
- Severe rent burden
- 1754.0
Population outlook (Macomb County) Hauer SSP2
- Today (2025)
- 925,296 people
- By 2030
- 948,226 · +2.5%
- By 2040
- 983,961 · +6.3%
- By 2050
- 1,010,200 · +9.2%
- By 2075
- 1,076,222 · +16.3%
- By 2100
- 1,077,065 · +16.4%
Race, ethnicity, and origin ACS 2023
- Neighborhood character
- Diverse neighborhood (Simpson 0.61)
- Race & ethnicity
- White 53% Black 31% Asian 7% Two or more races 6% Hispanic / Latino 3%
- Common ancestry
- Romanian 11% Lithuanian 3% Slovak 2%
- Foreign-born
- 5% · Canada
- Languages at home
- 92% English-only · Other Asian/Pacific 3% Other Indo-European 2% Arabic 1%
Political lean MEDSL · Macomb
- 2024 margin
- R (+13.7) · D 42.2% · R 55.9% · Other 1.9%
- 2008→2024 swing
- -22.3pp toward R · 2008: 8.6pp · 2024: -13.7pp
- All cycles
- 2024: R+13.7 2020: R+8.1 2016: R+11.6 2012: D+4.0 2008: D+8.6
Not yet ingested
- Civics
- —
Market trends
- HPI YoY
- ▼ -211.46%
- Current HPI
- 154.8325
- Rent YoY
- ▲ 2.94%
- Metro
- Detroit-Warren-Dearborn, MI
- State GDP YoY
- ▲ 1.37%
- F500 in state
- 28
Industry mix (Fortune 500 HQ in MI)
| Industry | F500 HQs | Revenue |
|---|---|---|
| Automotive Parts | 3 | $48B |
|
||
| Automotive | 2 | $372B |
|
||
| Chemicals | 1 | $45B |
|
||
| Automotive Retail | 1 | $29B |
|
||
| Healthcare / Medical Devices | 1 | $23B |
|
||
| Automotive Technology | 1 | $20B |
|
||
Price history
-4.8% since first listed4 events — show timeline
- 2026-04-23 Price Changed $99,900 MiRealSource-MiMLS
- 2026-04-22 Price Changed $99,900 REALCOMP
- 2026-03-08 Listed $104,900 REALCOMP
- 2026-03-07 Listed $104,900 MiRealSource-MiMLS
Property tax history
-0.8%/yrLatest (2025): $935 · +10.4% YoY. Source: county tax records.
Cash-flow waterfall
monthlySold comps — $/sqft
last 12 mo · ≤1 miLoading sold comps…