 Triplex
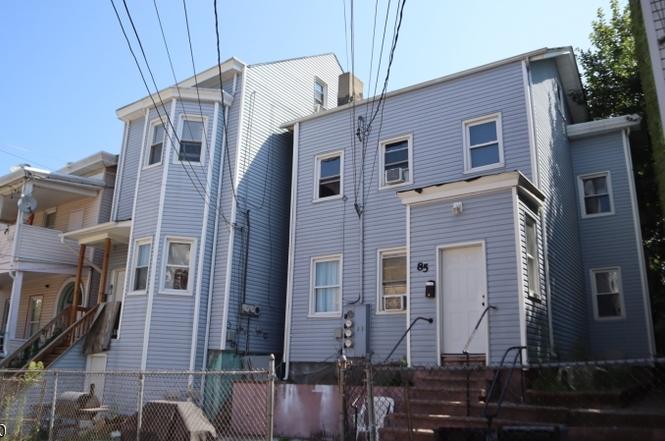
83 Madison St · Paterson, NJ
Flood risk 1/10 · Minimal
- FEMA flood zone
- X (unshaded)
- Chance of flooding over 30 yrs
- 0.0%
- Est. flood insurance / yr
- $507 – $1,088
Fire risk 1/10 · Minimal
- Est. fire insurance / yr
- $526 – $976
Heat risk 7/10 · Major
- Hot days now (above 100°F)
- 7 days/yr
- Hot days in 30 yrs
- 15 days/yr
Wind risk 6/10 · Moderate
- Chance of severe wind over 30 yrs
- 27.0%
Air-quality risk 4/10 · Minor
- Unhealthy air days now
- 3 days/yr
- Unhealthy air days in 30 yrs
- 5 days/yr
Risk factors via First Street. Map © Google.
Why this score? — see what drove the B+ grade
The composite is a weighted blend of 9 inputs, each scored 0–100. Each bar is that input's sub-score; the figure is the points it added to the 100-point composite (weight × sub-score).
- Cash flow +30.0/30.0
- 1% rule +10.0/10.0
- DSCR +10.0/10.0
- ARV discount +7.5/15.0
- Appreciation +5.5/10.0
- Rent growth +5.0/5.0
- Livability +3.5/5.0
- Condition / age +2.5/5.0
- Schools +1.3/10.0
$399,000
🖨 Deal sheet 📄 Offer letter ✓ Due diligence
Multi-family units
County records classify this as Multi-Family (2-4 Unit). Listing-text estimate: 3 units. confirmed
Listing remarks
Bankruptcy Sale. This property consists of two buildings with bonus units. Both buildings have walk-out basements. The sale for this and other properties is taking place on October 22nd at the Wyndham Garden Totowa, featuring five multi-family and mixed-use properties in Paterson. Properties are each being sold individually, all free and clear of liens, back taxes, etc. Low published reserve prices. BUILDING OCCUPIED. DO NOT APPROACH TENANTS.
Key facts
- Bonus units
- Walk-out basements
- Two buildings
Tags
Neighborhood map
What this means for you Summary
Snapshot
- This is a 3 × 3-bed/2.0-bath units multifamily listed at $399k.
Deal economics
- At list price, monthly cash flow is $2k ($28k/yr) — positive. Per door: $770/mo.
- The deal already cash-flows at list — no discount required.
- Meets the 1% rule at list price ($6k rent vs $399k).
- Recommended offer: $393k (1.5% below list) — sets the bar for market timing.
- Cap rate 13.2% vs local median 3.4% in Paterson — top-decile yield for the area; either an underpriced asset or a hidden risk that comps aren't pricing in. Stress-test before assuming the spread holds.
Location & tenants
- Location reads 69/100 on livability (#293 in NJ) — a middle-class / working-renter tenant base. Strengths: amenities A+, commute A+, health & safety A; Watch: schools D, employment D, crime F.
- Paterson Public School District (suburban): math 6% / reading 26% proficiency, ranked #458 of 472 in NJ (top 97%) — low school quality limits family demand, transient renter base, plan for 1-2y turnover; 83% free/reduced lunch — lower-income household profile, screen leases tightly.
- Market conditions: Rents rising fast (+11.4%/yr); 52 active listings in the ZIP; lower-income renter base — watch delinquency; 860 units permitted in Passaic County in 2024 (614 in 5+ unit buildings).
- At $6,416/mo this rent would consume 174% of the median local household income ($44k/yr) (locally 3954% of renters already pay >50% of income on rent) — very limited rent-growth headroom before tenants either downsize or default.
Forward outlook
- In year one you build about $7k of equity ($3k loan paydown + $4k appreciation (1.0% local appreciation)).
- Passaic County population projected at +5% by 2050 — modest demand growth; plan on rents tracking national, not racing it.
- At projected returns (1.0% appreciation + 8.0% rent growth), your $112k cash investment doubles in ~3 years — after that, you're playing with house money.
- By year 5, paydown + projected appreciation supports a ~$31k cash-out refi (75% LTV) — recoverable capital for the next deal without selling this one.
Negotiation context
- It's been on market 26 days — a 2% lower offer ($393k) is reasonable based on typical stale-listing flexibility.
Risks & watch-outs
- Climate carrying-cost: major wind risk, 27% chance of damaging wind over 30y; extreme-heat days projected 7→15/yr by 2055 (HVAC capex compounding) — expect insurance premiums to compound above CPI over the hold.
Questions for the listing agent
- Can we see the unit-by-unit rent roll, current vacancy, and any below-market leases? What's the average tenancy length?
- What capital expenditures (roof, boiler, parking lot, exteriors) have been made in the last 5 years, and what's planned in the next 2?
- Is there a deadline driving the sale (1031 exchange, divorce, estate, relocation)? That informs how much negotiation room exists.
- Schools are D-rated, which usually means shorter tenancies and higher turnover. Who's the typical renter profile here, and what's been the actual vacancy rate?
- Crime grade is F in this area — have there been break-ins, vandalism, or insurance claims at this property in the last 3 years? What carrier currently insures it and at what premium?
- What's the average days-on-market for RENTAL listings here right now (not sales)? A rising rental-DOM trend means longer vacancies and softer asking-rent achievability than the comps imply.
- What's the recent tenant-quality profile in this submarket — average credit score on applications, eviction rate, late-payment / NSF rate, and stable-employment percentage? A property-management company in the area should have these aggregated.
- How much new apartment / multifamily construction is in the pipeline within 1–3 miles? Heavy new supply (>2% of stock underway) typically softens rents 12–24 months out; light construction supports rent growth.
Investment metrics
- 1% rule
- 1.61% ✓
- Cap rate
- 13.24%
- Cash-on-cash
- 24.83%
- DSCR
- 2.10
- GRM
- 5.2
CMA / ARV
No comps found within radius.
Show comp detail 12 sales within ~0.75 mi
| Address | Dist | Beds/Ba | Sqft | Sold | Price | $/sf | Match |
|---|---|---|---|---|---|---|---|
| 25 Oak St | 0.02mi | 9/4.0 | — | 2mo | $780,000 | — | 77 |
| 23 Oak St | 0.02mi | 8/3.0 (-1) | — | 2mo | $710,000 | — | 68 |
| 58 Park Ave | 0.23mi | 8/4.0 (-1) | — | 3mo | $690,000 | — | 61 |
| 274 Ellison St | 0.37mi | 9/3.0 | — | 10mo | $540,000 | — | 50 |
| 880 19th St | 0.40mi | 8/3.0 (-1) | — | 4mo | $740,000 | — | 49 |
| 28 17th Ave | 0.42mi | 9/3.0 | — | 8mo | $649,000 | — | 49 |
| 1022 E 22nd St | 0.67mi | 9/4.0 | — | 2mo | $790,000 | — | 46 |
| 610 Main St | 0.53mi | 10/3.0 (+1) | — | 1mo | $490,000 | — | 45 |
| 776 22nd St | 0.63mi | 9/3.0 | — | 2mo | $800,000 | — | 44 |
| 1048 22nd St | 0.71mi | 8/4.5 (-1) | — | 3mo | $630,000 | — | 41 |
| 718 18th St | 0.50mi | 8/3.0 (-1) | — | 9mo | $670,000 | — | 40 |
| 259 Marshall St | 0.55mi | 10/3.0 (+1) | — | 7mo | $720,000 | — | 39 |
Match score weights: distance 35% · size 25% · config 20% · recency 20%. Top-matched comps best support the ARV.
Projected returns pro-forma
1.01% appreciation · 8.0% rent growth · sell at horizon
- IRR
- 31.4%
- Equity multiple
- 2.69×
- Total profit
- $188,810
- Equity at exit
- $136,362
- IRR
- 36.6%
- Equity multiple
- 6.23×
- Total profit
- $583,780
- Equity at exit
- $181,329
Cash invested: $111,720 (down + closing). Projections, not guarantees.
Landlord ↔ Tenant lean methodology
- Overall (STATE)
- 21 Tenant-Leaning
- State New Jersey
- 21 Tenant-Leaning · D+6
- County
- — inherits STATE
- City
- — inherits STATE
ZIP-level market 07501
- Home prices YoY
- 0.3%
- Rents YoY
- 11.4%
- Active inventory
- 52
- Price-to-rent
- 15.5×
Monthly cashflow live
- Estimated rent
- $6,416 high interval (Pro) →
- Mortgage (P&I)
- −$2,092
- Tax est. 1.5%
- −$499 /mo · $5,985/yr
- Insurance
- −$166
- HOA
- −$0
- Vacancy / Maint / Mgmt
- −$1,347
- Net cashflow
- $2,311
Break-even live
3-unit breakdown (identical units grouped — click to expand)
| Units | Beds | Baths | Est. rent |
|---|---|---|---|
| 3× units | 3 | 2 | $6,417 |
| #1 | 3 | 2 | $2,139 |
| #2 | 3 | 2 | $2,139 |
| #3 | 3 | 2 | $2,139 |
| Total (3 units) | $6,416 | ||
UW: 25.0% down · 7.5% · 30yr · 1.5% tax · 5.0% vac · 8.0% maint · 8.0% mgmt
Financing live
Cash to close
- Down payment
- $99,750
- Closing costs
- $11,970
- Reserves months
- —
- Total cash needed
- —
Loan-product check · same deal, 3 products live
Conventional
25% down · 7.5% · 30yr
- Down + closing
- —
- Monthly P&I
- —
- Monthly cashflow
- —
- DSCR
- —
- Eligible?
- —
Personal DTI + credit; lowest rate.
DSCR
20% down · 8.5% · 30yr
- Down + closing
- —
- Monthly P&I
- —
- Monthly cashflow
- —
- DSCR
- —
- Eligible?
- —
No personal income docs; deal must DSCR.
Hard money
10% down · 12.0% · 12mo
- Down + closing
- —
- Monthly P&I
- —
- Monthly cashflow
- —
- DSCR
- —
- Eligible?
- —
Short-term bridge; refi at stabilization.
Listing history 2 events
-
2025-10-23status Under Contract
-
2025-09-27$399,000 Active
ⓘ Source: listings_history table (triggers on properties + properties_extension) + one-shot
backfill from property_details.listing_events for pre-trigger history.
Climate risk First Street
- Flood 1/10 Low FEMA zone X (unshaded) · 0% chance over 30 yrs
- Wildfire 1/10 Low
- Heat 7/10 Severe 7 d/yr ≥100°F today · 15 d/yr by 30 yrs out
- Wind 6/10 Major 27% chance of damaging wind over 30 yrs
- Air quality 4/10 Moderate 3 unhealthy d/yr today · 5 by 30 yrs out
Nearby sold comps map
Loading sold comps map…
Walkable amenities ~0.75 mi
Loading nearby amenities…
Taxation est. · year 1
- Rental income
- $76,992
- − Mortgage interest
- −$22,350
- − Property taxes
- −$5,985
- − Insurance
- −$1,995
- − Repairs & maintenance
- −$6,159
- − Management
- −$6,159
- − Depreciation
- −$11,607
- Taxable income
- $22,736
- Est. tax owed @ 24.0%
- −$5,457
- After-tax cash flow
- $22,278/yr
For passive investors: Depreciation is non-cash, so a rental often shows a tax loss while cash-flowing — sheltering income. Rental losses are passive: they offset passive income freely, and up to $25,000/yr can offset ordinary (W-2) income if you actively participate and your MAGI is under $100k (phasing out to $0 by $150k); unused losses carry forward. On sale, claimed depreciation is recaptured at up to 25%, and gains may owe capital-gains tax (a 1031 exchange can defer both). Figures are a year-1 estimate at your 24.0% rate — not tax advice; consult a CPA.
Schools (NCES district)
- District
- Paterson Public School District
- NCES district ID
- 3412690
- Math proficiency
- 6% ▼ -12.00%
- Reading proficiency
- 26% ▼ -4.00%
- Median HH income
- $34,365
- Composite
- 13.02/100
- National rank
- #9568
- State rank
- #458 of 472 in NJ
Livability — Paterson
- Score
- 69/100
- State rank
- #293
- US rank
- #8763
Category grades
Schools grade is shown separately in the Schools card above.
Census & demographics
- Census place
- Paterson, NJ
- County
- Passaic County · 360,294 people
- City population
- 85,452
- Metro
- New York-Newark-Jersey City, NY-NJ-PA
- Population (ZIP)
- 35,481
- Household income
- $44,300
- Rent vs Own
- Severe rent burden
- 3954.0
Population outlook (Passaic County) Hauer SSP2
- Today (2025)
- 525,915 people
- By 2030
- 532,160 · +1.2%
- By 2040
- 543,670 · +3.4%
- By 2050
- 554,326 · +5.4%
- By 2075
- 584,728 · +11.2%
- By 2100
- 598,978 · +13.9%
Race, ethnicity, and origin ACS 2023
- Neighborhood character
- Predominantly Hispanic (68%)
- Race & ethnicity
- Hispanic / Latino 68% Black 24% Two or more races 8% White 5% Asian 3%
- Hispanic origin (detail)
- Mexican 7% Puerto Rican 10% Dominican 34%
- Foreign-born
- 42% · Canada, Jamaica
- Languages at home
- 34% English-only · Spanish 63% Other Indo-European 3%
Political lean MEDSL · Passaic
- 2024 margin
- Toss-up / Even · D 46.9% · R 49.8% · Other 3.3%
- 2008→2024 swing
- -24.6pp toward R · 2008: 21.7pp · 2024: -2.9pp
- All cycles
- 2024: R+2.9 2020: D+16.5 2016: D+21.8 2012: D+27.3 2008: D+21.7
Not yet ingested
- Civics
- —
Market trends
- HPI YoY
- ▲ 1.01%
- Current HPI
- 292.4223
- Rent YoY
- ▲ 11.37%
- Metro
- New York-Newark-Jersey City, NY-NJ-PA
- State GDP YoY
- ▲ 2.05%
- F500 in state
- 34
Industry mix (Fortune 500 HQ in NJ)
| Industry | F500 HQs | Revenue |
|---|---|---|
| Consumer Goods | 3 | $31B |
|
||
| Pharmaceuticals | 2 | $153B |
|
||
| Technology | 2 | $21B |
|
||
| Insurance | 2 | $20B |
|
||
| Healthcare | 2 | $19B |
|
||
| Financial Services | 1 | $70B |
|
||
Price history
2 events — show timeline
- 2025-10-23 Pending — GSMLS
- 2025-09-27 Listed $399,000 GSMLS
Cash-flow waterfall
monthlySold comps — $/sqft
last 12 mo · ≤1 miLoading sold comps…