2016 Hemstreet Rd · Billington Heights, NY
Flood risk No data
- FEMA flood zone
- —
- Chance of flooding over 30 yrs
- —
- Est. flood insurance / yr
- —
Fire risk No data
- Est. fire insurance / yr
- —
Heat risk No data
- Hot days now (above threshold)
- —
- Hot days in 30 yrs
- —
Wind risk No data
- Chance of severe wind over 30 yrs
- —
Air-quality risk No data
- Unhealthy air days now
- —
- Unhealthy air days in 30 yrs
- —
Risk factors via First Street. Map © Google.
Why this score? — see what drove the B grade
The composite is a weighted blend of 9 inputs, each scored 0–100. Each bar is that input's sub-score; the figure is the points it added to the 100-point composite (weight × sub-score).
- Cash flow +30.0/30.0
- 1% rule +10.0/10.0
- DSCR +10.0/10.0
- ARV discount +7.5/15.0
- Schools +5.5/10.0
- Livability +3.1/5.0
- Rent growth +2.5/5.0
- Condition / age +2.5/5.0
- Appreciation +0.0/10.0
$44,900
🖨 Deal sheet 📄 Offer letter ✓ Due diligence
Listing remarks
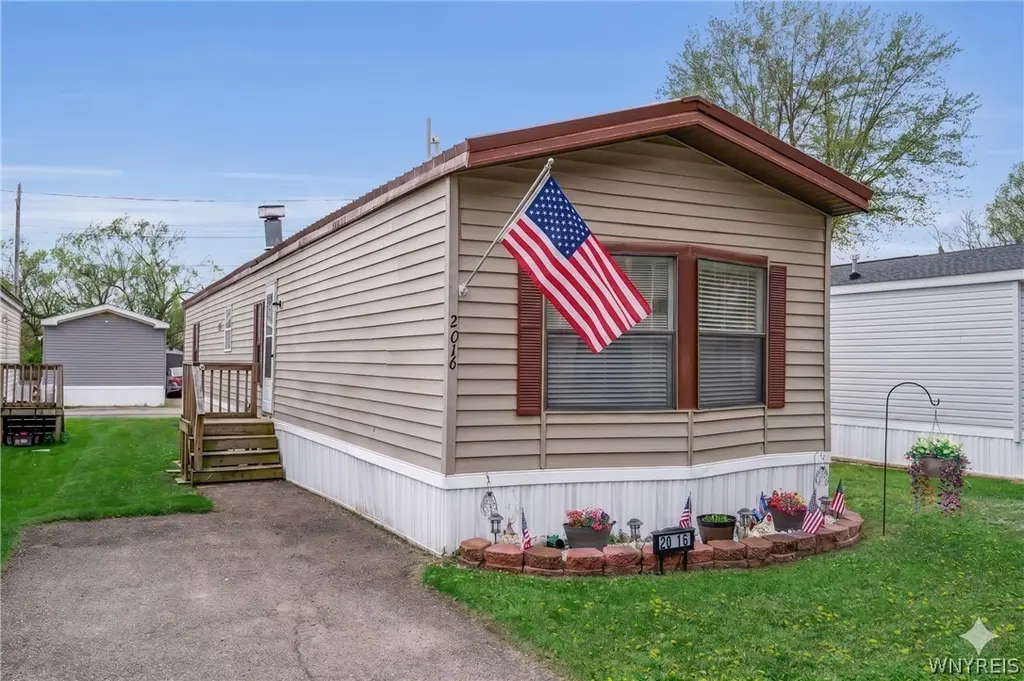
Modern Comfort in Hillside Estates $5k price reduction! Motivated Seller! Iroquois School District | 2 Bed, 2 Bath Experience a beautifully maintained, vinyl sided 1989-built home with metal roof that offers the perfect blend of modern updates and cozy charm. Located in the desirable Hillside Estates of East Aurora/Marilla, this home features actual drywall throughout and an open-concept layout that feels solid and spacious. Home Highlights: Bright & Airy Living: Vaulted ceilings and a classic brick fireplace anchor the living area, while ceiling fans and abundant natural light enhance the open feel. Fully Equipped Kitchen: Features fresh white cabinetry, bountiful storage, and a
Key facts
- Built 1989
- Listed 15 days
Property features AI
Finance
- HOA & community: Land lease of $650
Exterior
- Parking: No garage
- Utilities: Public water (connected); Sewer connected
- Home design: Single-wide mobile home; Single-story; Resale property; Metal roof; Vinyl siding
- Construction: Vinyl siding construction; Metal roof; Single-wide body type
- Exterior features: Blacktop driveway; Rectangular residential lot; City street frontage
Interior
- Kitchen: Gas oven and gas range; Dishwasher; Refrigerator
- Bedrooms: Two main-level bedrooms
- Flooring: Luxury vinyl
- Bathrooms: Two full bathrooms (both on main level)
- Heating & cooling: Forced-air gas heating; Central air conditioning
- Interior features: Breakfast bar; Country kitchen; Kitchen open to family room; Living/Dining room combo; Main level primary suite
- Laundry & utility: Main-level laundry; Dryer; Electric water heater
Neighborhood map
What this means for you Summary
Snapshot
- This is a 2-bed/2.0-bath single-family listed at $45k.
Deal economics
- At list price, monthly cash flow is $977 ($12k/yr) — positive.
- The deal already cash-flows at list — no discount required.
- Meets the 1% rule at list price ($2k rent vs $45k).
- Recommended offer: $44k (1.5% below list) — sets the bar for market timing.
Location & tenants
- Location reads 62/100 on livability (#872 in NY) — a middle-class / working-renter tenant base. Strengths: crime A+, housing A+; Watch: schools D+, amenities F, commute F.
- Iroquois Central School District (rural): math 57% / reading 68% proficiency, ranked #178 of 590 in NY (top 30%) — acceptable for families but not a draw, mixed tenant base, ~2y average lease; only 10% free/reduced lunch — higher-income household profile.
- Market conditions: 90 active listings in the ZIP; 1,244 units permitted in Erie County in 2024 (563 in 5+ unit buildings).
Forward outlook
- Local home prices are declining (-3.0%/yr); year-one equity from $310 of loan paydown is wiped out by about $1k of value loss. Plan a longer hold.
- At projected returns (-3.0% appreciation + 3.0% rent growth), your $13k cash investment doubles in ~2 years — after that, you're playing with house money.
Negotiation context
- It's been on market 15 days — a 2% lower offer ($44k) is reasonable based on typical stale-listing flexibility.
- 2 sale attempts since 11y ago; this cycle's ask has dropped $5k (10%) from the opening price — seller is motivated, your offer sets the floor, not the list.
Questions for the listing agent
- Is there a deadline driving the sale (1031 exchange, divorce, estate, relocation)? That informs how much negotiation room exists.
- Schools are D-rated, which usually means shorter tenancies and higher turnover. Who's the typical renter profile here, and what's been the actual vacancy rate?
- What's the average days-on-market for RENTAL listings here right now (not sales)? A rising rental-DOM trend means longer vacancies and softer asking-rent achievability than the comps imply.
- What's the recent tenant-quality profile in this submarket — average credit score on applications, eviction rate, late-payment / NSF rate, and stable-employment percentage? A property-management company in the area should have these aggregated.
- How much new for-sale + rental construction is in the pipeline within 1–3 miles? Heavy new supply typically softens prices + rents 12–24 months out; constrained supply supports both.
Investment metrics
- 1% rule
- 3.63% ✓
- Cap rate
- 32.41%
- Cash-on-cash
- 93.27%
- DSCR
- 5.15
- GRM
- 2.3
CMA / ARV
No comps found within radius.
Projected returns pro-forma
-3.0% appreciation · 3.0% rent growth · sell at horizon
- IRR
- 94.1%
- Equity multiple
- 5.37×
- Total profit
- $54,982
- Equity at exit
- $6,695
- IRR
- 96.9%
- Equity multiple
- 11.19×
- Total profit
- $128,113
- Equity at exit
- $3,882
Cash invested: $12,572 (down + closing). Projections, not guarantees.
Landlord ↔ Tenant lean methodology
- Overall (STATE)
- 15 Strongly Tenant-Friendly
- State New York
- 15 Strongly Tenant-Friendly · D+10
- County
- — inherits STATE
- City
- — inherits STATE
ZIP-level market 14052
- Active inventory
- 90
- Price-to-rent
- 2.3×
Monthly cashflow live
- Estimated rent
- $1,630 medium interval (Pro) →
- Mortgage (P&I)
- −$235
- Tax est. 1.5%
- −$56 /mo · $674/yr
- Insurance
- −$19
- HOA
- −$0
- Vacancy / Maint / Mgmt
- −$342
- Net cashflow
- $977
Break-even live
UW: 25.0% down · 7.5% · 30yr · 1.5% tax · 5.0% vac · 8.0% maint · 8.0% mgmt
Financing live
Cash to close
- Down payment
- $11,225
- Closing costs
- $1,347
- Reserves months
- —
- Total cash needed
- —
Loan-product check · same deal, 3 products live
Conventional
25% down · 7.5% · 30yr
- Down + closing
- —
- Monthly P&I
- —
- Monthly cashflow
- —
- DSCR
- —
- Eligible?
- —
Personal DTI + credit; lowest rate.
DSCR
20% down · 8.5% · 30yr
- Down + closing
- —
- Monthly P&I
- —
- Monthly cashflow
- —
- DSCR
- —
- Eligible?
- —
No personal income docs; deal must DSCR.
Hard money
10% down · 12.0% · 12mo
- Down + closing
- —
- Monthly P&I
- —
- Monthly cashflow
- —
- DSCR
- —
- Eligible?
- —
Short-term bridge; refi at stabilization.
Listing history 5 events
-
2026-05-15status Pending
-
2026-05-12price $44,900
-
2026-04-30$49,900 Active
-
2016-03-03historical
-
2015-09-02$15,000 Active
ⓘ Source: listings_history table (triggers on properties + properties_extension) + one-shot
backfill from property_details.listing_events for pre-trigger history.
Nearby sold comps map
Loading sold comps map…
Walkable amenities ~0.75 mi
Loading nearby amenities…
Taxation est. · year 1
- Rental income
- $19,556
- − Mortgage interest
- −$2,515
- − Property taxes
- −$674
- − Insurance
- −$224
- − Repairs & maintenance
- −$1,564
- − Management
- −$1,564
- − Depreciation
- −$1,306
- Taxable income
- $11,707
- Est. tax owed @ 24.0%
- −$2,810
- After-tax cash flow
- $8,916/yr
For passive investors: Depreciation is non-cash, so a rental often shows a tax loss while cash-flowing — sheltering income. Rental losses are passive: they offset passive income freely, and up to $25,000/yr can offset ordinary (W-2) income if you actively participate and your MAGI is under $100k (phasing out to $0 by $150k); unused losses carry forward. On sale, claimed depreciation is recaptured at up to 25%, and gains may owe capital-gains tax (a 1031 exchange can defer both). Figures are a year-1 estimate at your 24.0% rate — not tax advice; consult a CPA.
Schools (NCES district)
- District
- Iroquois Central School District
- NCES district ID
- 3615360
- Math proficiency
- 57% ▼ -17.00%
- Reading proficiency
- 68% ▲ 8.00%
- Median HH income
- $74,111
- Composite
- 55.41/100
- National rank
- #1251
- State rank
- #178 of 590 in NY
Livability — Billington Heights
- Score
- 62/100
- State rank
- #872
- US rank
- #16864
Category grades
Schools grade is shown separately in the Schools card above.
Census & demographics
- Population (ZIP)
- 17,501
Population outlook (Erie County) Hauer SSP2
- Today (2025)
- 933,037 people
- By 2030
- 935,181 · +0.2%
- By 2040
- 928,531 · -0.5%
- By 2050
- 905,725 · -2.9%
- By 2075
- 834,037 · -10.6%
- By 2100
- 708,033 · -24.1%
Race, ethnicity, and origin ACS 2023
- Neighborhood character
- Predominantly White (95%)
- Race & ethnicity
- White 95% Two or more races 3% Hispanic / Latino 3%
- Common ancestry
- Romanian 13% Lithuanian 3% Slovak 2%
- Foreign-born
- 2% · Canada
- Languages at home
- 96% English-only · Arabic 2% Spanish 1%
Political lean MEDSL · Erie
- 2024 margin
- Lean D (+9.7) · D 54.8% · R 45.2%
- 2008→2024 swing
- -7.9pp toward R · 2008: 17.5pp · 2024: 9.7pp
- All cycles
- 2024: D+9.7 2020: D+14.7 2016: D+4.8 2012: D+15.6 2008: D+17.5
Not yet ingested
- Civics
- —
Market trends
- HPI YoY
- ▼ -212.44%
- Current HPI
- 327.8237
- Rent YoY
- —
- Metro
- —
- State GDP YoY
- ▲ 2.60%
- F500 in state
- 92
Industry mix (Fortune 500 HQ in NY)
| Industry | F500 HQs | Revenue |
|---|---|---|
| Financial Services | 10 | $950B |
|
||
| Consumer Goods | 9 | $162B |
|
||
| Insurance | 4 | $225B |
|
||
| Telecommunications | 2 | $144B |
|
||
| Pharmaceuticals | 2 | $112B |
|
||
| Media / Entertainment | 2 | $69B |
|
||
Price history
+199.3% since first listed5 events — show timeline
- 2026-05-15 Pending — WNYREIS
- 2026-05-12 Price Changed $44,900 WNYREIS
- 2026-04-30 Listed $49,900 WNYREIS
- 2016-03-03 Listing Removed — WNYREIS
- 2015-09-02 Listed $15,000 WNYREIS
Cash-flow waterfall
monthlySold comps — $/sqft
last 12 mo · ≤1 miLoading sold comps…