2501 Copperhead Rd · Midland, TX
Flood risk No data
- FEMA flood zone
- —
- Chance of flooding over 30 yrs
- —
- Est. flood insurance / yr
- —
Fire risk No data
- Est. fire insurance / yr
- —
Heat risk No data
- Hot days now (above threshold)
- —
- Hot days in 30 yrs
- —
Wind risk No data
- Chance of severe wind over 30 yrs
- —
Air-quality risk No data
- Unhealthy air days now
- —
- Unhealthy air days in 30 yrs
- —
Risk factors via First Street. Map © Google.
Why this score? — see what drove the D grade
The composite is a weighted blend of 9 inputs, each scored 0–100. Each bar is that input's sub-score; the figure is the points it added to the 100-point composite (weight × sub-score).
- Cash flow +12.9/30.0
- ARV discount +7.5/15.0
- Livability +4.0/5.0
- DSCR +3.9/10.0
- 1% rule +3.2/10.0
- Schools +3.2/10.0
- Rent growth +3.1/5.0
- Condition / age +2.5/5.0
- Appreciation +0.0/10.0
$315,000
🖨 Deal sheet (PDF) 📄 Offer letter ✓ Due diligence
Listing remarks MLS
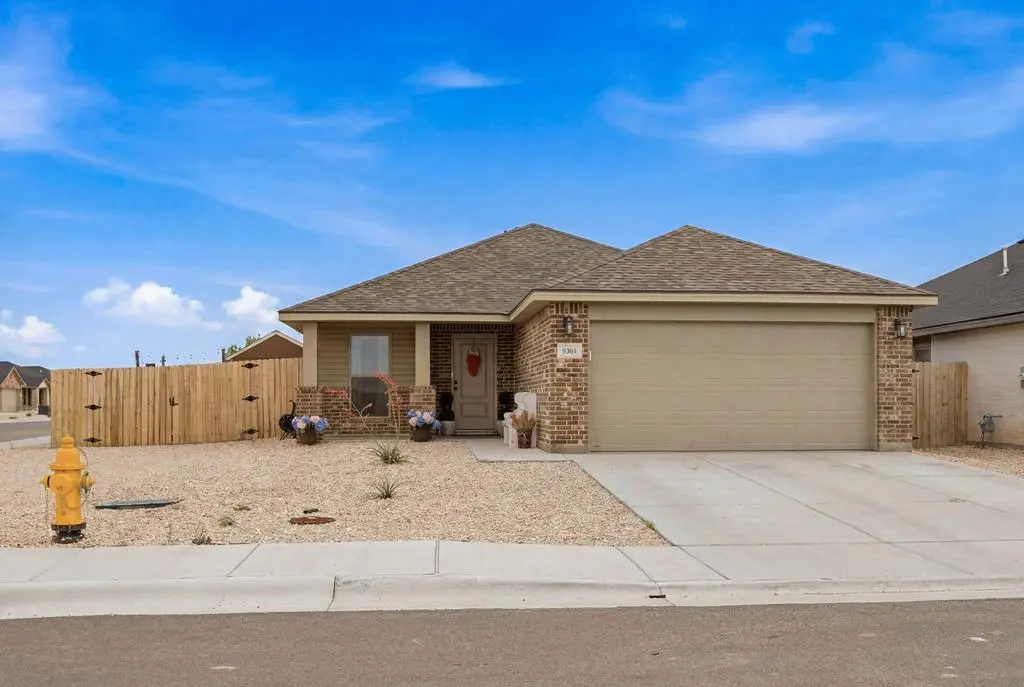
Welcome to this beautiful 2024-built home in the highly desirable Mockingbird Ridge subdivision! Situated on a corner lot, this 3-bedroom, 2-bath home offers 1,860 sq. ft. of modern living space with thoughtful upgrades throughout. Enjoy your own backyard oasis featuring a luxury above-ground pool, extended covered patio, side double gate access, and a storage shed for added convenience. Additional upgrades include a water softener and reverse osmosis system. Move-in ready and designed for both comfort and entertaining, this home is one you won't want to miss!
Key facts
- Backyard oasis
- Storage shed
- Corner lot
Tags
Property features AI
Finance
- HOA & community: Homeowners association with an annual fee of $450 (about $37.50/month)
Exterior
- Parking: 2 total parking spaces; 2 covered spaces; 2-car garage with garage door opener
- Utilities: Public water; Public sewer; Propane available
- Home design: Residential single-family home
- Construction: Brick veneer construction; Composition roof; Slab foundation; Built with solar (solar energy system)
- Exterior features: Covered patio/porch; Above-ground private pool; Landscaped corner lot; Paved road access; Workshop (outbuilding)
Interior
- Kitchen: Gas range; Microwave; Dishwasher; Disposal; Electric water heater
- Flooring: Carpet; Vinyl
- Bathrooms: 2 full bathrooms
- Heating & cooling: Central heating; Central air conditioning
- Interior features: Blinds; Water softener (owned); Water purifier (owned); No fireplace listed
- Laundry & utility: Laundry area in garage
Neighborhood map
What this means for you Summary
Snapshot
- This is a 3-bed/2.0-bath single-family listed at $315k.
Deal economics
- At list price, monthly cash flow is $-23 ($-282/yr) — negative.
- To cash-flow at today's rent, offer at most $311k (1.3% below list).
- To meet the 1% rule (rent ≥ 1% of price), the offer needs to be $259k (17.9% below list).
- Recommended offer: $259k (17.9% below list) — sets the bar for 1% rule.
- Cap rate 6.2% vs local median 4.7% in Midland — top-decile yield for the area; either an underpriced asset or a hidden risk that comps aren't pricing in. Stress-test before assuming the spread holds.
Location & tenants
- Location reads 79/100 on livability (#57 in TX, #2,192 nationally) — a middle-class / working-renter tenant base. Strengths: employment A+, housing A+, health & safety A+; Watch: crime C-, commute D+, amenities D.
- Midland ISD (urban): math 34% / reading 36% proficiency, ranked #477 of 826 in TX (top 58%) — families likely to look elsewhere, expect single-tenant / working-renter base with shorter leases.
- Zoned schools: General Tommy Franks El (math 43% / reading 46%, grade F, #1,155 of 4,322 statewide, top 29%, 825 students, 38% FRL); Goddard J H (math 23% / reading 32%, grade F, #1,156 of 1,662 statewide, top 71%, 1,024 students, 58% FRL, charter); Midland H S (math 37% / reading 7%, grade F, #1,366 of 1,632 statewide, top 84%, 2,492 students, 44% FRL) — zoned schools at 47% FRL track the district average.
- Market conditions: Rents rising (+2.6%/yr); 452 active listings in the ZIP; 35 comparable units currently listed for rent nearby; rentals at typical pace (median 23d on market — plan ~3-4 weeks tenant-placement turnaround); solid renter incomes; 1,504 units permitted in Midland County in 2024 (0 in 5+ unit buildings).
Forward outlook
- Local home prices are declining (-3.0%/yr); year-one equity from $2k of loan paydown is wiped out by about $9k of value loss. Plan a longer hold.
- Midland County population projected at +83% by 2050 — long-run rental-demand tailwind backs the buy-and-hold thesis.
Negotiation context
- It's been on market 18 days — a 2% lower offer ($310k) is reasonable based on typical stale-listing flexibility.
- 2 sale attempts; this cycle's ask has dropped $30k (9%) from the opening price — seller is motivated, your offer sets the floor, not the list.
Questions for the listing agent
- What do current leases actually rent for vs. the listed asking? Can we see a recent rent roll and the last 12 months of T-12 income?
- What does the HOA fee cover, when was the last increase, and are there any pending special assessments or reserve-fund shortfalls?
- Is there a deadline driving the sale (1031 exchange, divorce, estate, relocation)? That informs how much negotiation room exists.
- The area grade is low — what's the realistic commute time and amenity access for the typical tenant pool here? Any planned neighborhood developments (good or bad) we should know about?
- What's the average days-on-market for RENTAL listings here right now (not sales)? A rising rental-DOM trend means longer vacancies and softer asking-rent achievability than the comps imply.
- What's the recent tenant-quality profile in this submarket — average credit score on applications, eviction rate, late-payment / NSF rate, and stable-employment percentage? A property-management company in the area should have these aggregated.
- How much new for-sale + rental construction is in the pipeline within 1–3 miles? Heavy new supply typically softens prices + rents 12–24 months out; constrained supply supports both.
Investment metrics
- 1% rule
- 0.82% ✗
- Cap rate
- 6.20%
- Cash-on-cash
- -0.32%
- DSCR
- 0.99
- GRM
- 10.2
CMA / ARV
No comps found within radius.
Projected returns pro-forma
-3.0% appreciation · 2.56% rent growth · sell at horizon
- IRR
- -17.3%
- Equity multiple
- 0.39×
- Total profit
- $-53,708
- Equity at exit
- $46,968
- IRR
- -10.1%
- Equity multiple
- 0.39×
- Total profit
- $-53,448
- Equity at exit
- $27,235
Cash invested: $88,200 (down + closing). Projections, not guarantees.
Landlord ↔ Tenant lean methodology
- Overall (STATE)
- 87 Strongly Landlord-Friendly
- State Texas
- 87 Strongly Landlord-Friendly · R+5
- County
- — inherits STATE
- City
- — inherits STATE
ZIP-level market 79705
- Rents YoY
- 2.6%
- Active inventory
- 452
- Price-to-rent
- 10.2×
Monthly cashflow live
- Estimated rent
- $2,585 high interval (Pro) →
- Mortgage (P&I)
- −$1,652
- Tax from tax record
- −$245 /mo · $2,938/yr
- Insurance
- −$131
- HOA
- −$38
- Vacancy / Maint / Mgmt
- −$543
- Net cashflow
- $-23
Break-even live
Sensitivity live
| Price | -10% $155 | -5% $66 | +0% $-23 | +5% $-113 | +10% $-202 |
|---|---|---|---|---|---|
| Rent | -10% $-228 | -5% $-126 | +0% $-23 | +5% $79 | +10% $181 |
| Rate | -1.0pp $135 | -0.5pp $57 | base $-23 | +0.5pp $-105 | +1.0pp $-188 |
UW: 25.0% down · 7.5% · 30yr · 1.5% tax · 5.0% vac · 8.0% maint · 8.0% mgmt
Financing live
Cash to close
- Down payment
- $78,750
- Closing costs
- $9,450
- Reserves months
- —
- Total cash needed
- —
Loan-product check · same deal, 3 products live
Conventional
25% down · 7.5% · 30yr
- Down + closing
- —
- Monthly P&I
- —
- Monthly cashflow
- —
- DSCR
- —
- Eligible?
- —
Personal DTI + credit; lowest rate.
DSCR
20% down · 8.5% · 30yr
- Down + closing
- —
- Monthly P&I
- —
- Monthly cashflow
- —
- DSCR
- —
- Eligible?
- —
No personal income docs; deal must DSCR.
Hard money
10% down · 12.0% · 12mo
- Down + closing
- —
- Monthly P&I
- —
- Monthly cashflow
- —
- DSCR
- —
- Eligible?
- —
Short-term bridge; refi at stabilization.
Rent comps 35 comps
| Address | Beds | Baths | Sqft | Rent | $/sqft | DOM | Units | Dist |
|---|---|---|---|---|---|---|---|---|
| 2716 River Bend Rd Midland, TX | 3.0 | 2.0 | 1517 | $2,600 | $1.71 | 45d | 1 | 0.12mi |
| 5920 Woodpecker Way Midland, TX | 3.0 | 2.0 | 1669 | $3,800 | $2.28 | 45d | 1 | 0.13mi |
| 2808 Lighthouse Rd Midland, TX | 3.0 | 2.0 | 1168 | $2,300 | $1.97 | 45d | 1 | 0.18mi |
| 5817 Settler Ave Midland, TX | 3.0 | 2.0 | 1421 | $2,600 | $1.83 | 45d | 1 | 0.19mi |
| 2808 Longfellow Rd Midland, TX | 3.0 | 2.0 | 1422 | $2,400 | $1.69 | 22d | 1 | 0.27mi |
| 5917 Praline St Midland, TX | 3.0 | 2.0 | 1251 | $2,500 | $2.00 | 22d | 1 | 0.31mi |
| 6011 Purtis Creek Dr Midland, TX | 4.0 | 2.0 | 1722 | $2,900 | $1.68 | 45d | 1 | 0.32mi |
| 2908 Yellowhouse Ave Midland, TX | 3.0 | 2.0 | 1515 | $2,650 | $1.75 | 22d | 1 | 0.35mi |
| 2912 Pitchfork Rd Midland, TX | 3.0 | 2.0 | 1119 | $2,100 | $1.88 | 22d | 1 | 0.35mi |
| 6109 Buckthorn Dr Midland, TX | 4.0 | 2.0 | 1655 | $2,900 | $1.75 | 22d | 1 | 0.38mi |
| 2944 Hidalgo Ave Midland, TX | 3.0 | 2.0 | 1689 | $3,800 | $2.25 | 45d | 1 | 0.42mi |
| 6105 Poppy Dr Midland, TX | 3.0 | 2.0 | 1421 | $2,700 | $1.90 | 45d | 1 | 0.47mi |
| 6220 Kingsville St Midland, TX | 3.0 | 2.0 | 1312 | $2,400 | $1.83 | 15d | 1 | 0.53mi |
| 6333 Poppy Dr Midland, TX | 3.0 | 2.0 | 1350 | $2,500 | $1.85 | 22d | 1 | 0.55mi |
| 2703 Ranch Ave Midland, TX | 3.0 | 2.0 | 1658 | $2,350 | $1.42 | 22d | 1 | 0.78mi |
| 2702 Southwest St Midland, TX | 3.0 | 2.0 | 1844 | $2,500 | $1.36 | 45d | 1 | 0.91mi |
| 1513 San Miguel Ct Midland, TX | 3.0 | 2.0 | 1853 | $2,400 | $1.30 | 15d | 1 | 1.05mi |
| 1507 Laguna Meadows Trl Midland, TX | 4.0 | 2.0 | 1703 | $2,600 | $1.53 | 45d | 1 | 1.06mi |
| 2409 Husk St Unit 1 Midland, TX | 3.0 | 2.0 | 1800 | $3,000 | $1.67 | 15d | 1 | 1.08mi |
| 1412 Mockingbird Ln Midland, TX | 1.0–3.0 | 1.0–2.0 | 959 | $2,635 | $2.75 | 15d | 22 | 1.08mi |
| 1500 Laguna Meadows Trl Midland, TX | 3.0 | 2.0 | 1868 | $2,500 | $1.34 | 22d | 1 | 1.10mi |
| 1708 Rattler Ln Midland, TX | 3.0 | 2.0 | 1694 | $2,550 | $1.51 | 45d | 1 | 1.10mi |
| 1704 Rattler Ln Midland, TX | 3.0 | 2.0 | 1498 | $2,500 | $1.67 | 22d | 1 | 1.12mi |
| 1621 Revolution Dr Midland, TX | 3.0 | 2.0 | 1504 | $2,500 | $1.66 | 45d | 1 | 1.19mi |
| 6809 Brush Dr Midland, TX | 3.0 | 2.0 | 1466 | $2,500 | $1.71 | 15d | 1 | 1.19mi |
| 6812 Brush Dr Midland, TX | 3.0 | 2.0 | 1450 | $2,500 | $1.72 | 15d | 1 | 1.20mi |
| 1508 Rattler Ln Midland, TX | 3.0 | 2.0 | 1578 | $2,250 | $1.43 | 15d | 1 | 1.22mi |
| 1307 Santa Clara Dr Midland, TX | 3.0 | 2.0 | 1704 | $2,900 | $1.70 | 46d | 1 | 1.23mi |
| 1310 Wrangler Ln Midland, TX | 3.0 | 2.0 | 1387 | $2,400 | $1.73 | 22d | 1 | 1.30mi |
| 6309 Ojibwa Midland, TX | 3.0 | 2.0 | 1300 | $2,150 | $1.65 | 22d | 1 | 1.32mi |
| 1115 Overshine Ln Midland, TX | 3.0 | 2.0 | 1867 | $2,600 | $1.39 | 15d | 1 | 1.40mi |
| 6706 Yellow Rose Ct Midland, TX | 3.0 | 2.0 | 1819 | $2,800 | $1.54 | 45d | 1 | 1.41mi |
| 110 Pavilion Pkwy Midland, TX | 1.0–3.0 | 1.0–2.0 | 985 | $2,224 | $2.26 | 15d | 19 | 1.47mi |
| 1315 Yellow Rose Ct Midland, TX | 3.0 | 2.0 | 1600 | $2,600 | $1.62 | 15d | 1 | 1.48mi |
| 6717 Brand Ln Midland, TX | 3.0 | 2.0 | 1500 | $2,400 | $1.60 | 22d | 1 | 1.48mi |
HOA detail
- Monthly dues
- $38 · $456/yr
- Likely covers
- waterpool
Listing history 14 events
-
2026-06-22days on market $315,000 Active 18 DOM
-
2026-06-19days on market $315,000 Active 16 DOM
-
2026-06-18days on market $315,000 Active 15 DOM
-
2026-06-17days on market $315,000 Active 14 DOM
-
2026-06-16days on market $315,000 Active 13 DOM
-
2026-06-15days on market $315,000 Active 12 DOM
-
2026-06-14days on market $315,000 Active 10 DOM
-
2026-06-13pricedays on market $315,000 Active 9 DOM
-
2026-06-10days on market $345,000 Active 7 DOM
-
2026-06-09days on market $345,000 Active 6 DOM
-
2026-06-08days on market $345,000 Active 5 DOM
-
2026-06-07days on market $345,000 Active 4 DOM
-
2026-06-03remarks 489-char remark
Show marketing remark (566 chars)
Welcome to this beautiful 2024-built home in the highly desirable Mockingbird Ridge subdivision! Situated on a corner lot, this 3-bedroom, 2-bath home offers 1,860 sq. ft. of modern living space with thoughtful upgrades throughout. Enjoy your own backyard oasis featuring a luxury above-ground pool, extended covered patio, side double gate access, and a storage shed for added convenience. Additional upgrades include a water softener and reverse osmosis system. Move-in ready and designed for both comfort and entertaining, this home is one you won't want to miss!
-
2026-06-03$345,000 Active 1 DOM
Show marketing remark (566 chars)
Welcome to this beautiful 2024-built home in the highly desirable Mockingbird Ridge subdivision! Situated on a corner lot, this 3-bedroom, 2-bath home offers 1,860 sq. ft. of modern living space with thoughtful upgrades throughout. Enjoy your own backyard oasis featuring a luxury above-ground pool, extended covered patio, side double gate access, and a storage shed for added convenience. Additional upgrades include a water softener and reverse osmosis system. Move-in ready and designed for both comfort and entertaining, this home is one you won't want to miss!
ⓘ Source: listings_history table (triggers on properties + properties_extension) + one-shot
backfill from property_details.listing_events for pre-trigger history.
Tax reassessment forecast TX · Resets to sale price
- Current annual tax
- $2,938 · $245/mo
- Projected year-2 tax
- $5,764 · $480/mo
- Expected delta
- +$2,826/yr (+$236/mo · 96.2%)
ⓘ Screening estimate from a state-policy table — verify with the county assessor before closing.
Nearby sold comps map
Loading sold comps map…
Walkable amenities ~0.75 mi
Loading nearby amenities…
Taxation est. · year 1
- Rental income
- $31,026
- − Mortgage interest
- −$17,645
- − Property taxes
- −$2,938
- − Insurance
- −$1,575
- − Repairs & maintenance
- −$2,482
- − Management
- −$2,482
- − HOA
- −$456
- − Depreciation
- −$9,164
- Taxable loss
- −$5,716
- Est. tax savings @ 24.0%
- +$1,372
- After-tax cash flow
- $1,090/yr
For passive investors: Depreciation is non-cash, so a rental often shows a tax loss while cash-flowing — sheltering income. Rental losses are passive: they offset passive income freely, and up to $25,000/yr can offset ordinary (W-2) income if you actively participate and your MAGI is under $100k (phasing out to $0 by $150k); unused losses carry forward. On sale, claimed depreciation is recaptured at up to 25%, and gains may owe capital-gains tax (a 1031 exchange can defer both). Figures are a year-1 estimate at your 24.0% rate — not tax advice; consult a CPA.
Schools (NCES district)
- District
- Midland ISD
- NCES district ID
- 4830570
- Math proficiency
- 34% ▼ -7.00%
- Reading proficiency
- 36% ▬ 0.00%
- Median HH income
- $63,457
- Composite
- 31.63/100
- National rank
- #5938
- State rank
- #477 of 826 in TX
Livability — Midland
- Score
- 79/100
- State rank
- #57
- US rank
- #2192
Category grades
Schools grade is shown separately in the Schools card above.
Census & demographics
- Census place
- Midland, TX
- County
- Midland County · 168,494 people
- City population
- 168,494
- Metro
- Midland, TX
- Population (ZIP)
- 46,653
- Household income
- $105,310
- Rent vs Own
- Severe rent burden
- 1557.0
Population outlook (Midland County) Hauer SSP2
- Today (2025)
- 220,895 people
- By 2030
- 253,667 · +14.8%
- By 2040
- 325,498 · +47.4%
- By 2050
- 404,168 · +83.0%
- By 2075
- 609,802 · +176.1%
- By 2100
- 760,172 · +244.1%
Race, ethnicity, and origin ACS 2023
- Neighborhood character
- Diverse neighborhood (Simpson 0.60)
- Race & ethnicity
- White 46% Hispanic / Latino 43% Two or more races 20% Black 8%
- Hispanic origin (detail)
- Mexican 35%
- Common ancestry
- Slovak 1% Lithuanian 1% Serbian 1%
- Foreign-born
- 10% · Canada, Jamaica
- Languages at home
- 72% English-only · Spanish 24% Arabic 1%
Political lean MEDSL · Midland
- 2024 margin
- Solid R (+60.5) · D 19.3% · R 79.8%
- 2008→2024 swing
- -3.3pp toward R · 2008: -57.3pp · 2024: -60.5pp
- All cycles
- 2024: R+60.5 2020: R+56.6 2016: R+55.2 2012: R+61.5 2008: R+57.3
Not yet ingested
- Civics
- —
Market trends
- HPI YoY
- ▼ -300.44%
- Current HPI
- 207.2904
- Rent YoY
- ▲ 2.56%
- Metro
- Midland, TX
- State GDP YoY
- ▲ 3.95%
- F500 in state
- 110
Industry mix (Fortune 500 HQ in TX)
| Industry | F500 HQs | Revenue |
|---|---|---|
| Energy | 16 | $1,198B |
|
||
| Technology | 5 | $198B |
|
||
| Engineering / Construction | 4 | $72B |
|
||
| Energy Services | 3 | $60B |
|
||
| Utilities | 3 | $41B |
|
||
| Healthcare | 2 | $330B |
|
||
Price history
+0.0% since first listed2 events — show timeline
- 2026-06-03 Listed $345,000 ODMLS
- 2026-06-03 Listed $345,000 PBBOR
Cash-flow waterfall
monthlySold comps — $/sqft
last 12 mo · ≤1 miLoading sold comps…