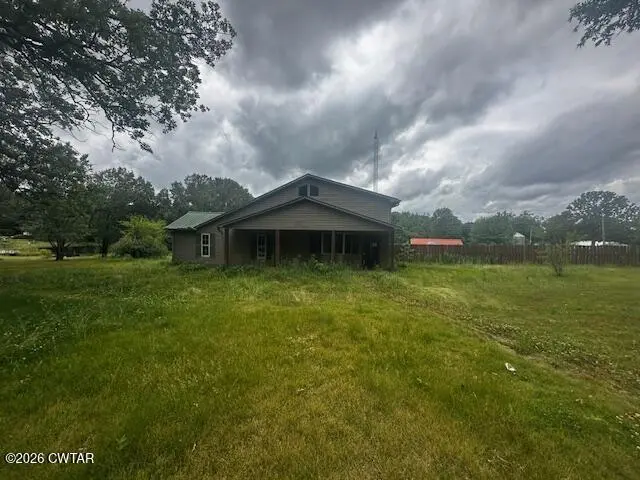
240 Pitts Rd · Sardis, TN
Flood risk 1/10 · Minimal
- FEMA flood zone
- X (unshaded)
- Chance of flooding over 30 yrs
- 0.0%
- Est. flood insurance / yr
- $507 – $1,088
Fire risk 5/10 · Moderate
- Est. fire insurance / yr
- $949 – $1,763
Heat risk 5/10 · Moderate
- Hot days now (above 109°F)
- 7 days/yr
- Hot days in 30 yrs
- 20 days/yr
Wind risk 4/10 · Minor
- Chance of severe wind over 30 yrs
- 15.0%
Air-quality risk 1/10 · Minimal
- Unhealthy air days now
- 0 days/yr
- Unhealthy air days in 30 yrs
- 0 days/yr
Risk factors via First Street. Map © Google.
Why this score? — see what drove the C- grade
The composite is a weighted blend of 9 inputs, each scored 0–100. Each bar is that input's sub-score; the figure is the points it added to the 100-point composite (weight × sub-score).
- Cash flow +16.8/30.0
- Appreciation +10.0/10.0
- ARV discount +7.5/15.0
- DSCR +5.2/10.0
- 1% rule +3.4/10.0
- Livability +2.8/5.0
- Schools +2.7/10.0
- Rent growth +2.5/5.0
- Condition / age +2.5/5.0
$150,000
🖨 Deal sheet 📄 Offer letter ✓ Due diligence
Listing remarks
Spacious 3-bedroom, 2-bath home offering approximately 1,775 square feet in a peaceful Sardis, TN setting. Property features an average overall condition with plenty of living space, a large in-ground swimming pool, and a generously sized yard perfect for entertaining or relaxing outdoors. Conveniently located just minutes from local amenities while still offering a quiet country feel. Don't miss this opportunity to own a well-maintained home with great outdoor features.
Key facts
- Local amenities
- 0.6 acre lot
- Parking
Tags
Property features AI
Exterior
- Parking: 1 parking space
- Utilities: Private well water; Septic tank
- Home design: Single family residence; Two levels (2-story)
- Exterior features: Patio; Shed(s); Private in-ground pool
Interior
- Kitchen: Dishwasher; Electric range; Range hood
- Bedrooms: 3 bedrooms on the main level
- Bathrooms: 2 full bathrooms (2 on the main level)
- Interior features: Dishwasher; Electric range; Range hood
Neighborhood map
What this means for you Summary
Snapshot
- This is a 3-bed/2.0-bath single-family listed at $150k.
Deal economics
- At list price, monthly cash flow is $95 ($1k/yr) — positive.
- The deal already cash-flows at list — no discount required.
- To meet the 1% rule (rent ≥ 1% of price), the offer needs to be $127k (15.5% below list).
- Recommended offer: $127k (15.5% below list) — sets the bar for 1% rule.
Location & tenants
- Location reads 56/100 on livability (#342 in TN) — a working-class tenant base; expect higher turnover. Strengths: cost of living A+, housing A+; Watch: health & safety C-, schools F, crime F.
- Henderson County (rural): math 32% / reading 32% proficiency, ranked #41 of 139 in TN (top 30%) — families likely to look elsewhere, expect single-tenant / working-renter base with shorter leases.
- Market conditions: 13 active listings in the ZIP; 27 units permitted in Henderson County in 2024 (0 in 5+ unit buildings).
Forward outlook
- In year one you build about $16k of equity ($1k loan paydown + $15k appreciation (10.0% local appreciation)).
- Henderson County population projected at -11% by 2050 — secular population decline; favor cash flow + early exit over multi-decade hold.
- At projected returns (10.0% appreciation + 3.0% rent growth), your $42k cash investment doubles in ~3 years — after that, you're playing with house money.
- By year 3, paydown + projected appreciation supports a ~$41k cash-out refi (75% LTV) — recoverable capital for the next deal without selling this one.
Negotiation context
- It's been on market 21 days — a 2% lower offer ($148k) is reasonable based on typical stale-listing flexibility.
- 2 sale attempts; this cycle's ask has dropped $20k (12%) from the opening price — seller is motivated, your offer sets the floor, not the list.
Risks & watch-outs
- Climate carrying-cost: moderate wildfire risk; extreme-heat days projected 7→20/yr by 2055 (HVAC capex compounding) — expect insurance premiums to compound above CPI over the hold.
Questions for the listing agent
- Is there a deadline driving the sale (1031 exchange, divorce, estate, relocation)? That informs how much negotiation room exists.
- Schools are F-rated, which usually means shorter tenancies and higher turnover. Who's the typical renter profile here, and what's been the actual vacancy rate?
- Crime grade is F in this area — have there been break-ins, vandalism, or insurance claims at this property in the last 3 years? What carrier currently insures it and at what premium?
- What's the average days-on-market for RENTAL listings here right now (not sales)? A rising rental-DOM trend means longer vacancies and softer asking-rent achievability than the comps imply.
- What's the recent tenant-quality profile in this submarket — average credit score on applications, eviction rate, late-payment / NSF rate, and stable-employment percentage? A property-management company in the area should have these aggregated.
- How much new for-sale + rental construction is in the pipeline within 1–3 miles? Heavy new supply typically softens prices + rents 12–24 months out; constrained supply supports both.
Investment metrics
- 1% rule
- 0.84% ✗
- Cap rate
- 7.05%
- Cash-on-cash
- 2.71%
- DSCR
- 1.12
- GRM
- 9.9
CMA / ARV
No comps found within radius.
Projected returns pro-forma
10.0% appreciation · 3.0% rent growth · sell at horizon
- IRR
- 26.2%
- Equity multiple
- 3.09×
- Total profit
- $87,670
- Equity at exit
- $135,132
- IRR
- 23.0%
- Equity multiple
- 7.03×
- Total profit
- $253,305
- Equity at exit
- $291,417
Cash invested: $42,000 (down + closing). Projections, not guarantees.
Landlord ↔ Tenant lean methodology
- Overall (STATE)
- 87 Strongly Landlord-Friendly
- State Tennessee
- 87 Strongly Landlord-Friendly · R+13
- County
- — inherits STATE
- City
- — inherits STATE
ZIP-level market 38371
- Home prices YoY
- 3.3%
- Active inventory
- 13
- Price-to-rent
- 9.9×
Monthly cashflow live
- Estimated rent
- $1,267 medium interval (Pro) →
- Mortgage (P&I)
- −$787
- Tax from tax record
- −$57 /mo · $685/yr
- Insurance
- −$62
- HOA
- −$0
- Vacancy / Maint / Mgmt
- −$266
- Net cashflow
- $95
Break-even live
UW: 25.0% down · 7.5% · 30yr · 1.5% tax · 5.0% vac · 8.0% maint · 8.0% mgmt
Financing live
Cash to close
- Down payment
- $37,500
- Closing costs
- $4,500
- Reserves months
- —
- Total cash needed
- —
Loan-product check · same deal, 3 products live
Conventional
25% down · 7.5% · 30yr
- Down + closing
- —
- Monthly P&I
- —
- Monthly cashflow
- —
- DSCR
- —
- Eligible?
- —
Personal DTI + credit; lowest rate.
DSCR
20% down · 8.5% · 30yr
- Down + closing
- —
- Monthly P&I
- —
- Monthly cashflow
- —
- DSCR
- —
- Eligible?
- —
No personal income docs; deal must DSCR.
Hard money
10% down · 12.0% · 12mo
- Down + closing
- —
- Monthly P&I
- —
- Monthly cashflow
- —
- DSCR
- —
- Eligible?
- —
Short-term bridge; refi at stabilization.
Listing history 21 events
-
2026-06-19days on market $150,000 Active 21 DOM
-
2026-06-18days on market $150,000 Active 20 DOM
-
2026-06-17days on market $150,000 Active 19 DOM
-
2026-06-16days on market $150,000 Active 18 DOM
-
2026-06-15days on market $150,000 Active 17 DOM
-
2026-06-14days on market $150,000 Active 15 DOM
-
2026-06-13pricedays on market $150,000 Active 14 DOM
-
2026-06-10days on market $169,900 Active 12 DOM
-
2026-06-09days on market $169,900 Active 11 DOM
-
2026-06-08days on market $169,900 Active 10 DOM
-
2026-06-07days on market $169,900 Active 9 DOM
-
2026-06-05days on market $169,900 Active 6 DOM
-
2026-06-03days on market $169,900 Active 5 DOM
-
2026-06-02days on market $169,900 Active 4 DOM
-
2026-06-01days on market $169,900 Active 3 DOM
-
2026-05-31days on market $169,900 Active 2 DOM
-
2026-05-26$169,900 Active
-
2026-05-12historical
-
2026-03-03$169,900 Active
-
2022-06-01soldstatus $179,000
-
2005-02-10soldstatus $75,000
ⓘ Source: listings_history table (triggers on properties + properties_extension) + one-shot
backfill from property_details.listing_events for pre-trigger history.
Tax reassessment forecast TN · Resets to sale price
- Current annual tax
- $685 · $57/mo
- Projected year-2 tax
- $1,065 · $89/mo
- Expected delta
- +$380/yr (+$32/mo · 55.5%)
ⓘ Screening estimate from a state-policy table — verify with the county assessor before closing.
Climate risk First Street
- Flood 1/10 Low FEMA zone X (unshaded) · 0% chance over 30 yrs
- Wildfire 5/10 Major
- Heat 5/10 Major 7 d/yr ≥109°F today · 20 d/yr by 30 yrs out
- Wind 4/10 Moderate 15% chance of damaging wind over 30 yrs
- Air quality 1/10 Low 0 unhealthy d/yr today · 0 by 30 yrs out
Nearby sold comps map
Loading sold comps map…
Walkable amenities ~0.75 mi
Loading nearby amenities…
Taxation est. · year 1
- Rental income
- $15,205
- − Mortgage interest
- −$8,402
- − Property taxes
- −$685
- − Insurance
- −$750
- − Repairs & maintenance
- −$1,216
- − Management
- −$1,216
- − Depreciation
- −$4,364
- Taxable loss
- −$1,429
- Est. tax savings @ 24.0%
- +$343
- After-tax cash flow
- $1,480/yr
For passive investors: Depreciation is non-cash, so a rental often shows a tax loss while cash-flowing — sheltering income. Rental losses are passive: they offset passive income freely, and up to $25,000/yr can offset ordinary (W-2) income if you actively participate and your MAGI is under $100k (phasing out to $0 by $150k); unused losses carry forward. On sale, claimed depreciation is recaptured at up to 25%, and gains may owe capital-gains tax (a 1031 exchange can defer both). Figures are a year-1 estimate at your 24.0% rate — not tax advice; consult a CPA.
Schools (NCES district)
- District
- Henderson County
- NCES district ID
- 4701800
- Math proficiency
- 32% ▼ -19.00%
- Reading proficiency
- 32% ▼ -10.00%
- Median HH income
- $39,119
- Composite
- 26.83/100
- National rank
- #7114
- State rank
- #41 of 139 in TN
Livability — Sardis
- Score
- 56/100
- State rank
- #342
- US rank
- #22649
Category grades
Schools grade is shown separately in the Schools card above.
Census & demographics
- Population (ZIP)
- 916
Population outlook (Henderson County) Hauer SSP2
- Today (2025)
- 28,057 people
- By 2030
- 27,730 · -1.2%
- By 2040
- 26,664 · -5.0%
- By 2050
- 25,081 · -10.6%
- By 2075
- 20,747 · -26.1%
- By 2100
- 15,603 · -44.4%
Race, ethnicity, and origin ACS 2023
- Neighborhood character
- Predominantly White (91%)
- Race & ethnicity
- White 91% Hispanic / Latino 6% Two or more races 4%
- Hispanic origin (detail)
- Mexican 6%
- Common ancestry
- Slovak 3% Italian 1% Romanian 1%
- Foreign-born
- 2% · Canada
- Languages at home
- 95% English-only · Spanish 5%
Political lean MEDSL · Henderson
- 2024 margin
- Solid R (+67.9) · D 15.8% · R 83.7%
- 2008→2024 swing
- -25.0pp toward R · 2008: -42.9pp · 2024: -67.9pp
- All cycles
- 2024: R+67.9 2020: R+64.1 2016: R+62.1 2012: R+48.8 2008: R+42.9
Not yet ingested
- Civics
- —
Market trends
- HPI YoY
- ▲ 10.82%
- Current HPI
- 336.9802
- Rent YoY
- —
- Metro
- —
- State GDP YoY
- ▲ 2.78%
- F500 in state
- 22
Industry mix (Fortune 500 HQ in TN)
| Industry | F500 HQs | Revenue |
|---|---|---|
| Healthcare | 3 | $91B |
|
||
| Retail | 3 | $72B |
|
||
| Transportation / Logistics | 1 | $88B |
|
||
| Paper / Packaging | 1 | $19B |
|
||
| Insurance | 1 | $13B |
|
||
| Energy | 1 | $12B |
|
||
Price history
+126.5% since first listed5 events — show timeline
- 2026-05-26 Listed $169,900 CWTAR
- 2026-05-12 Listing Removed — REALTRACS as Distributed by MLS Grid
- 2026-03-03 Listed $169,900 REALTRACS as Distributed by MLS Grid
- 2022-06-01 Sold (Public Records) $179,000 Public Records
- 2005-02-10 Sold (Public Records) $75,000 Public Records
Property tax history
+4.7%/yrLatest (2025): $685 · +0.0% YoY. Source: county tax records.
Cash-flow waterfall
monthlySold comps — $/sqft
last 12 mo · ≤1 miLoading sold comps…