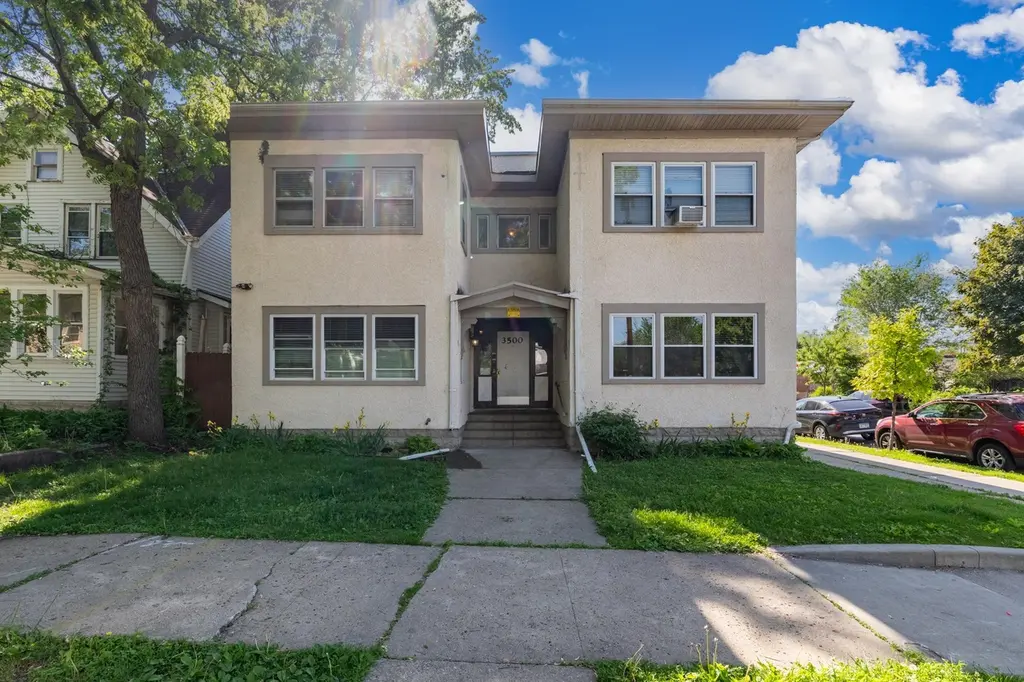
 Fourplex
3500 1st Ave S · Minneapolis, MN
Flood risk 6/10 · Moderate
- FEMA flood zone
- X (unshaded)
- Chance of flooding over 30 yrs
- 0.73%
- Est. flood insurance / yr
- $473 – $860
Fire risk 1/10 · Minimal
- Est. fire insurance / yr
- $888 – $1,650
Heat risk 2/10 · Minimal
- Hot days now (above 99°F)
- 7 days/yr
- Hot days in 30 yrs
- 14 days/yr
Wind risk 2/10 · Minimal
- Chance of severe wind over 30 yrs
- —
Air-quality risk 2/10 · Minimal
- Unhealthy air days now
- 1 days/yr
- Unhealthy air days in 30 yrs
- 1 days/yr
Risk factors via First Street. Map © Google.
Why this score? — see what drove the D+ grade
The composite is a weighted blend of 9 inputs, each scored 0–100. Each bar is that input's sub-score; the figure is the points it added to the 100-point composite (weight × sub-score).
- Cash flow +15.2/30.0
- ARV discount +7.5/15.0
- DSCR +4.7/10.0
- 1% rule +4.1/10.0
- Livability +3.9/5.0
- Rent growth +3.7/5.0
- Schools +3.5/10.0
- Condition / age +2.5/5.0
- Appreciation +0.0/10.0
$774,900
🖨 Deal sheet (PDF) 📄 Offer letter ✓ Due diligence
Multi-family units
County records classify this as Multi-Family (5+ Unit). Listing-text estimate: 4 units. estimate disagrees with records
5+ unit building — per-unit beds/baths from public records are typically unavailable; the breakdown below (if shown) is an estimate from the listing text.
Listing remarks MLS
Quick close possible. Well maintained 4 plex with a 3 car detached garage. Each unit has 3 bedrooms/1 bath. Kitchens have been updated and have stainless steel appliances. Separate metered utilities. Excellent convenient location. Great opportunity for Investor or owner occupy. Pictures are from one of the units in the building.
Key facts
- Proximity to transit
- Updated kitchens
- Strong rental income
Tags
Property features AI
Finance
- Financial info: Property configured as 4 rental units; Gross income reported $78,540; Net operating income reported $33,864; Owner pays insurance, grounds care, repairs, snow removal, taxes, and trash collection; Tenant pays cable TV, electricity, and fuel; Estimated annual expenses: Fuel $1,200; Water/Sewer $1,500; Electric $1,000; Insurance $2,000; Maintenance $2,000; Management $1,500; Other $1,000
- HOA & community: Patio listed as an association amenity
Exterior
- Parking: 3-car garage (approximately 740 sq ft)
- Utilities: City water (in street); City sewer (connected); Natural gas; Electric with circuit breakers
- Home design: Residential income property; Two levels; Flat roof; Stone foundation; Above-grade finished area 4,680; Below-grade area 2,340; Total building area 7,020
- Construction: Stucco construction; Stone foundation; Flat roof
- Exterior features: Stucco exterior; Privacy wood fencing; Public transit within six blocks; City street frontage with curbs, paved streets and sidewalks; Patio (association amenity)
Interior
- Kitchen: Cooktop; Range; Refrigerator
- Bedrooms: 12 bedrooms total; Units include multiple 3-bedroom layouts
- Flooring: Hardwood floors
- Bathrooms: Multiple full bathrooms (unit-level counts: each main unit has 1 full bath)
- Heating & cooling: Boiler heating
- Interior features: Historic/period millwork; Natural woodwork
- Laundry & utility: Has basement (full)
Neighborhood map
What this means for you Summary
Snapshot
- This is a 4 × 3-bed/1.0-bath units multifamily listed at $775k.
Deal economics
- At list price, monthly cash flow is $270 ($3k/yr) — positive. Per door: $68/mo.
- The deal already cash-flows at list — no discount required.
- To meet the 1% rule (rent ≥ 1% of price), the offer needs to be $709k (8.5% below list).
- Recommended offer: $709k (8.5% below list) — sets the bar for 1% rule.
- Cap rate 6.7% vs local median 3.1% in Minneapolis — top-decile yield for the area; either an underpriced asset or a hidden risk that comps aren't pricing in. Stress-test before assuming the spread holds.
Location & tenants
- Location reads 78/100 on livability (#110 in MN, #2,525 nationally) — a middle-class / working-renter tenant base. Strengths: amenities A+, commute A+, housing A+; Watch: cost of living C-, crime F.
- Minneapolis Public School District (urban): math 35% / reading 46% proficiency, ranked #217 of 301 in MN (top 72%) — families likely to look elsewhere, expect single-tenant / working-renter base with shorter leases.
- Zoned schools: Lyndale Elementary (math 42% / reading 52%, grade D-, #492 of 857 statewide, top 61%, 360 students, 74% FRL); Justice Page Middle (math 44% / reading 50%, grade D+, #97 of 258 statewide, top 39%, 925 students, 32% FRL); Washburn High (math 52% / reading 67%, grade C+, #46 of 471 statewide, top 11%, 1,582 students, 37% FRL).
- Market conditions: Rents rising fast (+4.8%/yr); 178 active listings in the ZIP; 4,651 units permitted in Hennepin County in 2024 (2,443 in 5+ unit buildings).
- At $7,087/mo this rent would consume 121% of the median local household income ($70k/yr) (locally 2619% of renters already pay >50% of income on rent) — very limited rent-growth headroom before tenants either downsize or default.
Forward outlook
- Local home prices are declining (-3.0%/yr); year-one equity from $5k of loan paydown is wiped out by about $23k of value loss. Plan a longer hold.
- Hennepin County population projected at +30% by 2050 — long-run rental-demand tailwind backs the buy-and-hold thesis.
Negotiation context
- It's been on market 20 days — a 2% lower offer ($763k) is reasonable based on typical stale-listing flexibility.
- 6 sale attempts since 22y ago with the ask held roughly flat each time — persistent listings suggest the price (not the market) is what's stuck; bring a comps-based counter.
- Current owner paid $665k; 17% above their basis — modest negotiation headroom, anchor on the comps not their cost.
Risks & watch-outs
- Watch-outs: built in 1914 — expect roof / HVAC / electrical / plumbing capex.
- Climate carrying-cost: major flood risk — expect insurance premiums to compound above CPI over the hold.
Questions for the listing agent
- Can we see the unit-by-unit rent roll, current vacancy, and any below-market leases? What's the average tenancy length?
- What capital expenditures (roof, boiler, parking lot, exteriors) have been made in the last 5 years, and what's planned in the next 2?
- Built in 1914 — when were the roof, HVAC, electrical panel, plumbing, and water heater last replaced?
- Is there a deadline driving the sale (1031 exchange, divorce, estate, relocation)? That informs how much negotiation room exists.
- Crime grade is F in this area — have there been break-ins, vandalism, or insurance claims at this property in the last 3 years? What carrier currently insures it and at what premium?
- The area grade is low — what's the realistic commute time and amenity access for the typical tenant pool here? Any planned neighborhood developments (good or bad) we should know about?
- What's the average days-on-market for RENTAL listings here right now (not sales)? A rising rental-DOM trend means longer vacancies and softer asking-rent achievability than the comps imply.
- What's the recent tenant-quality profile in this submarket — average credit score on applications, eviction rate, late-payment / NSF rate, and stable-employment percentage? A property-management company in the area should have these aggregated.
- How much new apartment / multifamily construction is in the pipeline within 1–3 miles? Heavy new supply (>2% of stock underway) typically softens rents 12–24 months out; light construction supports rent growth.
Investment metrics
- 1% rule
- 0.91% ✗
- Cap rate
- 6.71%
- Cash-on-cash
- 1.49%
- DSCR
- 1.07
- GRM
- 9.1
CMA / ARV
No comps found within radius.
Projected returns pro-forma
-3.0% appreciation · 4.77% rent growth · sell at horizon
- IRR
- -11.9%
- Equity multiple
- 0.56×
- Total profit
- $-95,426
- Equity at exit
- $115,540
- IRR
- -0.4%
- Equity multiple
- 0.97×
- Total profit
- $-5,926
- Equity at exit
- $66,999
Cash invested: $216,972 (down + closing). Projections, not guarantees.
Landlord ↔ Tenant lean methodology
- Overall (CITY)
- 34 Tenant-Leaning
- State Minnesota
- 46 Balanced · D+2
- County
- — inherits STATE
- City Minneapolis
- 34 Tenant-Leaning · D+50
ZIP-level market 55408
- Rents YoY
- 4.8%
- Active inventory
- 178
- Price-to-rent
- 36.4×
Monthly cashflow live
- Estimated rent
- $7,087 high interval (Pro) →
- Mortgage (P&I)
- −$4,064
- Tax from tax record
- −$942 /mo · $11,304/yr
- Insurance
- −$323
- HOA
- −$0
- Vacancy / Maint / Mgmt
- −$1,488
- Net cashflow
- $270
Break-even live
Sensitivity live
| Price | -10% $709 | -5% $489 | +0% $270 | +5% $51 | +10% $-168 |
|---|---|---|---|---|---|
| Rent | -10% $-290 | -5% $-10 | +0% $270 | +5% $550 | +10% $830 |
| Rate | -1.0pp $660 | -0.5pp $467 | base $270 | +0.5pp $69 | +1.0pp $-135 |
4-unit breakdown (identical units grouped — click to expand)
| Units | Beds | Baths | Est. rent |
|---|---|---|---|
| 4× units | 3 | 1 | $7,088 |
| #1 | 3 | 1 | $1,772 |
| #2 | 3 | 1 | $1,772 |
| #3 | 3 | 1 | $1,772 |
| #4 | 3 | 1 | $1,772 |
| Total (4 units) | $7,087 | ||
UW: 25.0% down · 7.5% · 30yr · 1.5% tax · 5.0% vac · 8.0% maint · 8.0% mgmt
Financing live
Cash to close
- Down payment
- $193,725
- Closing costs
- $23,247
- Reserves months
- —
- Total cash needed
- —
Loan-product check · same deal, 3 products live
Conventional
25% down · 7.5% · 30yr
- Down + closing
- —
- Monthly P&I
- —
- Monthly cashflow
- —
- DSCR
- —
- Eligible?
- —
Personal DTI + credit; lowest rate.
DSCR
20% down · 8.5% · 30yr
- Down + closing
- —
- Monthly P&I
- —
- Monthly cashflow
- —
- DSCR
- —
- Eligible?
- —
No personal income docs; deal must DSCR.
Hard money
10% down · 12.0% · 12mo
- Down + closing
- —
- Monthly P&I
- —
- Monthly cashflow
- —
- DSCR
- —
- Eligible?
- —
Short-term bridge; refi at stabilization.
Listing history 13 events
-
2026-06-21days on market $774,900 Active 20 DOM
-
2026-06-18days on market $774,900 Active 17 DOM
-
2026-06-17days on market $774,900 Active 16 DOM
-
2026-06-16days on market $774,900 Active 15 DOM
-
2026-06-15days on market $774,900 Active 14 DOM
-
2026-06-13days on market $774,900 Active 12 DOM
-
2026-06-09days on market $774,900 Active 8 DOM
-
2026-06-08days on market $774,900 Active 7 DOM
-
2026-06-07days on market $774,900 Active 6 DOM
-
2026-06-04days on market $774,900 Active 3 DOM
-
2026-06-03days on market $774,900 Active 2 DOM
-
2026-06-02remarks 699-char remark
-
2026-06-02$774,900 Active 1 DOM
ⓘ Source: listings_history table (triggers on properties + properties_extension) + one-shot
backfill from property_details.listing_events for pre-trigger history.
Tax reassessment forecast MN · Partial reset (capped growth)
- Current annual tax
- $11,304 · $942/mo
- Projected year-2 tax
- $11,304 · $942/mo
- Expected delta
- $0/yr ($0/mo · 0.0%)
ⓘ Screening estimate from a state-policy table — verify with the county assessor before closing.
Climate risk First Street
- Flood 6/10 Major FEMA zone X (unshaded) · 73% chance over 30 yrs
- Wildfire 1/10 Low
- Heat 2/10 Low 7 d/yr ≥99°F today · 14 d/yr by 30 yrs out
- Wind 2/10 Low
- Air quality 2/10 Low 1 unhealthy d/yr today · 1 by 30 yrs out
Nearby sold comps map
Loading sold comps map…
Walkable amenities ~0.75 mi
Loading nearby amenities…
Taxation est. · year 1
- Rental income
- $85,044
- − Mortgage interest
- −$43,406
- − Property taxes
- −$11,304
- − Insurance
- −$3,874
- − Repairs & maintenance
- −$6,804
- − Management
- −$6,804
- − Depreciation
- −$22,543
- Taxable loss
- −$9,691
- Est. tax savings @ 24.0%
- +$2,326
- After-tax cash flow
- $5,568/yr
For passive investors: Depreciation is non-cash, so a rental often shows a tax loss while cash-flowing — sheltering income. Rental losses are passive: they offset passive income freely, and up to $25,000/yr can offset ordinary (W-2) income if you actively participate and your MAGI is under $100k (phasing out to $0 by $150k); unused losses carry forward. On sale, claimed depreciation is recaptured at up to 25%, and gains may owe capital-gains tax (a 1031 exchange can defer both). Figures are a year-1 estimate at your 24.0% rate — not tax advice; consult a CPA.
Schools (NCES district)
- District
- Minneapolis Public School District
- NCES district ID
- 2721240
- Math proficiency
- 35% ▼ -7.00%
- Reading proficiency
- 46% ▼ -1.00%
- Median HH income
- $50,521
- Composite
- 34.92/100
- National rank
- #5067
- State rank
- #217 of 301 in MN
Livability — Minneapolis
- Score
- 78/100
- State rank
- #110
- US rank
- #2525
Category grades
Schools grade is shown separately in the Schools card above.
Census & demographics
- Census place
- Minneapolis, MN
- County
- Hennepin County · 1,150,272 people
- City population
- 417,555
- Metro
- Minneapolis-St. Paul-Bloomington, MN-WI
- Population (ZIP)
- 31,507
- Household income
- $70,326
- Rent vs Own
- Severe rent burden
- 2619.0
Population outlook (Hennepin County) Hauer SSP2
- Today (2025)
- 1,405,227 people
- By 2030
- 1,492,650 · +6.2%
- By 2040
- 1,660,157 · +18.1%
- By 2050
- 1,823,498 · +29.8%
- By 2075
- 2,221,283 · +58.1%
- By 2100
- 2,509,976 · +78.6%
Race, ethnicity, and origin ACS 2023
- Neighborhood character
- Diverse neighborhood (Simpson 0.60)
- Race & ethnicity
- White 59% Black 17% Hispanic / Latino 11% Two or more races 9% Asian 5% Native American 1%
- Hispanic origin (detail)
- Mexican 7%
- Common ancestry
- Portuguese 8% Romanian 6% Lithuanian 3%
- Foreign-born
- 15% · Canada, South Korea, Vietnam
- Languages at home
- 79% English-only · Spanish 8% Other Indo-European 1% Other Asian/Pacific 1%
Political lean MEDSL · Hennepin
- 2024 margin
- Solid D (+42.6) · D 70.2% · R 27.5% · Other 2.3%
- 2008→2024 swing
- +14.0pp toward D · 2008: 28.6pp · 2024: 42.6pp
- All cycles
- 2024: D+42.6 2020: D+43.2 2016: D+35.3 2012: D+27.1 2008: D+28.6
Not yet ingested
- Civics
- —
Market trends
- HPI YoY
- ▼ -148.08%
- Current HPI
- 256.0491
- Rent YoY
- ▲ 4.77%
- Metro
- Minneapolis-St. Paul-Bloomington, MN-WI
- State GDP YoY
- ▲ 2.41%
- F500 in state
- 34
Industry mix (Fortune 500 HQ in MN)
| Industry | F500 HQs | Revenue |
|---|---|---|
| Healthcare | 2 | $407B |
|
||
| Retail | 2 | $150B |
|
||
| Consumer Goods | 2 | $32B |
|
||
| Industrial Machinery | 2 | $6B |
|
||
| Agriculture | 1 | $40B |
|
||
| Healthcare / Medical Devices | 1 | $32B |
|
||
Price history
+136.2% since first listed17 events — show timeline
- 2026-06-01 Listed $774,900 NORTHSTARMLS as Distributed by MLS Grid
- 2019-08-12 Sold (Public Records) $665,000 Public Records
- 2019-08-08 Sold (MLS) $665,000 NORTHSTARMLS as Distributed by MLS Grid
- 2019-06-27 Pending — NORTHSTARMLS as Distributed by MLS Grid
- 2019-05-21 Listing Removed — NORTHSTARMLS as Distributed by MLS Grid
- 2019-05-17 Listed $699,900 NORTHSTARMLS as Distributed by MLS Grid
- 2009-07-30 Sold (MLS) $235,000 NORTHSTARMLS as Distributed by MLS Grid
- 2009-06-30 Listing Removed — NORTHSTARMLS as Distributed by MLS Grid
- 2009-05-27 Listed $250,000 NORTHSTARMLS as Distributed by MLS Grid
- 2004-10-18 Sold (MLS) $421,000 NORTHSTARMLS as Distributed by MLS Grid
- 2004-10-01 Listing Removed — NORTHSTARMLS as Distributed by MLS Grid
- 2004-08-02 Listed $419,500 NORTHSTARMLS as Distributed by MLS Grid
- 2004-07-30 Listing Removed — NORTHSTARMLS as Distributed by MLS Grid
- 2004-04-12 Listing Removed — NORTHSTARMLS as Distributed by MLS Grid
- 2004-04-12 Listed $445,000 NORTHSTARMLS as Distributed by MLS Grid
- 2004-02-16 Listed $489,900 NORTHSTARMLS as Distributed by MLS Grid
- 2002-11-15 Sold (Public Records) $328,000 Public Records
Property tax history
+3.9%/yrLatest (2025): $11,304 · -0.8% YoY. Source: county tax records.
Cash-flow waterfall
monthlySold comps — $/sqft
last 12 mo · ≤1 miLoading sold comps…