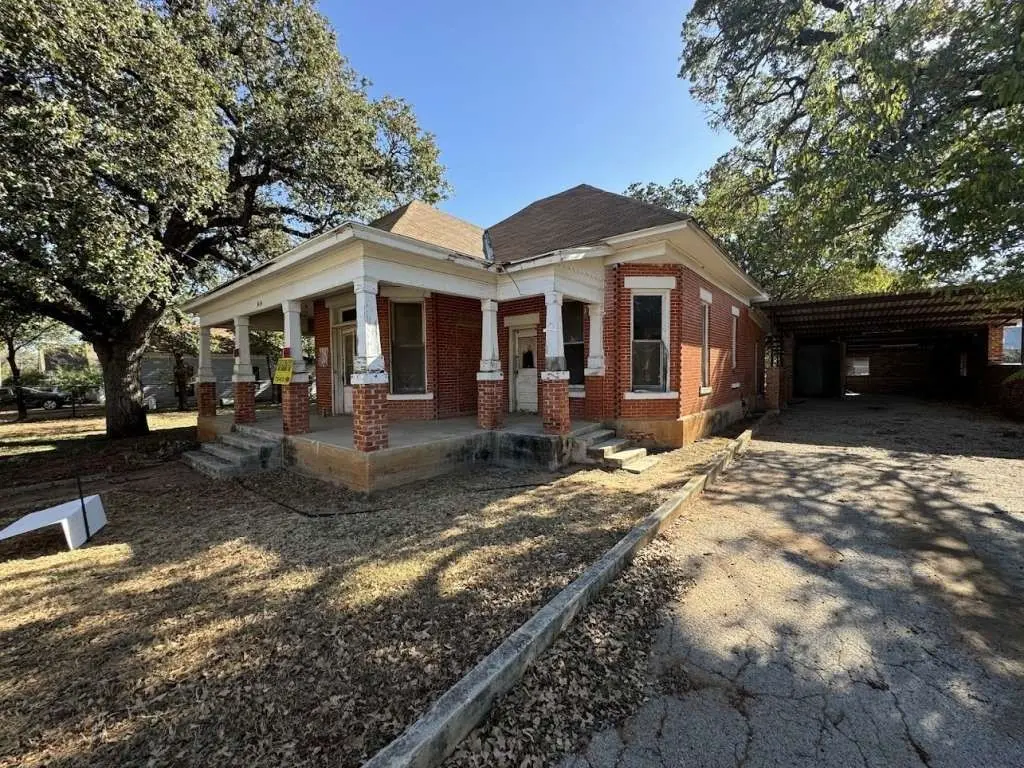
1414 Avenue A · Brownwood, TX
Flood risk 1/10 · Minimal
- FEMA flood zone
- X (unshaded)
- Chance of flooding over 30 yrs
- 0.0%
- Est. flood insurance / yr
- $507 – $1,088
Fire risk 6/10 · Moderate
- Est. fire insurance / yr
- $1,222 – $2,270
Heat risk 7/10 · Major
- Hot days now (above 107°F)
- 7 days/yr
- Hot days in 30 yrs
- 23 days/yr
Wind risk 6/10 · Moderate
- Chance of severe wind over 30 yrs
- 27.0%
Air-quality risk 1/10 · Minimal
- Unhealthy air days now
- 0 days/yr
- Unhealthy air days in 30 yrs
- 0 days/yr
Risk factors via First Street. Map © Google.
Why this score? — see what drove the B- grade
The composite is a weighted blend of 9 inputs, each scored 0–100. Each bar is that input's sub-score; the figure is the points it added to the 100-point composite (weight × sub-score).
- Cash flow +26.5/30.0
- ARV discount +15.0/15.0
- DSCR +9.0/10.0
- 1% rule +6.3/10.0
- Schools +3.6/10.0
- Livability +3.2/5.0
- Rent growth +2.5/5.0
- Condition / age +2.5/5.0
- Appreciation +0.0/10.0
$109,999
🖨 Deal sheet 📄 Offer letter ✓ Due diligence
Listing remarks MLS
NEW LISTING! Don't miss the opportunity to make 1414 Avenue A your home. This property is a bit of a fixer-upper with endless potential and unique features. The home is approximately 1,837 Sq. Ft. with three bedrooms, and two bathrooms. The main area is incredibly spacious, the kitchen is equipped with plenty of cabinet and counterspace, and the bedrooms are all a great size. There is also a two-car carport and covered front porch area that adds even more charm! This home sits on an expansive 30,000 Sq. Ft. CORNER LOT that provides you with so much yard space. The location has direct access to both US-377 and US-183. WE MAKE IT EASY TO OWN. This is a great opportunity! Don't wait, call us today to get more information on the owner's easy terms and smooth process that may be able to put the deed in your name and make this your dream home. When you call be sure and ask us about the other homes we may have in this area. We might even have a PACKAGE DEAL available in this same area.
Key facts
- Covered front porch
- Direct access
- Corner lot
Tags
Neighborhood map
What this means for you Summary
Snapshot
- This is a 3-bed/2.0-bath single-family listed at $110k.
Deal economics
- At list price, monthly cash flow is $289 ($3k/yr) — positive.
- The deal already cash-flows at list — no discount required.
- Meets the 1% rule at list price ($1k rent vs $110k).
- Recommended offer: $97k (12.0% below list) — sets the bar for market timing.
- Cap rate 9.4% vs local median 3.7% in Brownwood — top-decile yield for the area; either an underpriced asset or a hidden risk that comps aren't pricing in. Stress-test before assuming the spread holds.
Location & tenants
- Location reads 64/100 on livability (#781 in TX) — a middle-class / working-renter tenant base. Strengths: cost of living A+, housing A+; Watch: crime D+, health & safety D+, schools F.
- Brownwood ISD (town): math 45% / reading 41% proficiency, ranked #344 of 826 in TX (top 42%) — families likely to look elsewhere, expect single-tenant / working-renter base with shorter leases.
- Market conditions: 377 active listings in the ZIP; 2 comparable units currently listed for rent nearby; 142 units permitted in Brown County in 2024 (0 in 5+ unit buildings).
Forward outlook
- Local home prices are declining (-3.0%/yr); year-one equity from $760 of loan paydown is wiped out by about $3k of value loss. Plan a longer hold.
- At projected returns (-3.0% appreciation + 3.0% rent growth), your $31k cash investment doubles in ~10 years — after that, you're playing with house money.
Negotiation context
- It's been on market 134 days — a 12% lower offer ($97k) is reasonable based on typical stale-listing flexibility.
Risks & watch-outs
- Watch-outs: built in 1935 — expect roof / HVAC / electrical / plumbing capex.
- Climate carrying-cost: major wind risk, 27% chance of damaging wind over 30y; major wildfire risk; extreme-heat days projected 7→23/yr by 2055 (HVAC capex compounding) — expect insurance premiums to compound above CPI over the hold.
Questions for the listing agent
- It's been on market 134 days. Have you received any prior offers? Is the seller open to a 12% concession, seller financing, or rate buy-down credit?
- Built in 1935 — when were the roof, HVAC, electrical panel, plumbing, and water heater last replaced?
- Why hasn't it sold? Are there any deal-killer items the seller is aware of (foundation, flood, title, zoning, code violations)?
- Is there a deadline driving the sale (1031 exchange, divorce, estate, relocation)? That informs how much negotiation room exists.
- Schools are F-rated, which usually means shorter tenancies and higher turnover. Who's the typical renter profile here, and what's been the actual vacancy rate?
- Crime grade is D in this area — have there been break-ins, vandalism, or insurance claims at this property in the last 3 years? What carrier currently insures it and at what premium?
- What's the average days-on-market for RENTAL listings here right now (not sales)? A rising rental-DOM trend means longer vacancies and softer asking-rent achievability than the comps imply.
- What's the recent tenant-quality profile in this submarket — average credit score on applications, eviction rate, late-payment / NSF rate, and stable-employment percentage? A property-management company in the area should have these aggregated.
- How much new for-sale + rental construction is in the pipeline within 1–3 miles? Heavy new supply typically softens prices + rents 12–24 months out; constrained supply supports both.
Investment metrics
- 1% rule
- 1.13% ✓
- Cap rate
- 9.45%
- Cash-on-cash
- 11.27%
- DSCR
- 1.50
- GRM
- 7.4
CMA / ARV
- ARV (median comp)
- $140,890
- List price
- $109,999
- Delta
- -21.93%
- Verdict
- UNDERPRICED
- Comps
- 20 within 1.0 mi
Show comp detail 12 sales within ~0.75 mi
| Address | Dist | Beds/Ba | Sqft | Sold | Price | $/sf | Match |
|---|---|---|---|---|---|---|---|
| 1515 Avenue D | 0.20mi | 3/2.0 | 1,710 (-7%) | 18mo | $129,900 | $76 | 64 |
| 1903 Avenue E | 0.42mi | 3/2.0 | 1,746 (-5%) | 15mo | $149,900 | $86 | 60 |
| 1102 1st St | 0.21mi | 3/2.0 | 1,675 (-9%) | 19mo | $189,900 | $113 | 60 |
| 1701 1st St | 0.59mi | 3/2.0 | 1,698 (-8%) | 2mo | $185,000 | $109 | 59 |
| 1605 6th St | 0.54mi | 3/2.0 | 1,960 (+7%) | 6mo | $105,000 | $54 | 59 |
| 1203 8th St | 0.45mi | 3/2.0 | 1,605 (-13%) | 1mo | $110,000 | $69 | 57 |
| 606 Avenue C | 0.61mi | 3/1.0 | 2,057 (+12%) | 3mo | $45,000 | $22 | 45 |
| 1617 6th St | 0.57mi | 4/1.0 (+1) | 2,048 (+12%) | 4mo | $75,000 | $37 | 42 |
| 1608 1st St | 0.55mi | 3/2.0 | 1,663 (-10%) | 23mo | $129,000 | $78 | 39 |
| 2305 Avenue B | 0.61mi | 4/2.0 (+1) | 1,680 (-8%) | 18mo | $234,900 | $140 | 38 |
| 2305 Avenue E | 0.65mi | 3/2.0 | 1,572 (-14%) | 14mo | $269,000 | $171 | 34 |
| 1612 11th St | 0.73mi | 3/1.0 | 1,573 (-14%) | 16mo | $173,000 | $110 | 25 |
Match score weights: distance 35% · size 25% · config 20% · recency 20%. Top-matched comps best support the ARV.
Projected returns pro-forma
-3.0% appreciation · 3.0% rent growth · sell at horizon
- IRR
- 0.5%
- Equity multiple
- 1.02×
- Total profit
- $576
- Equity at exit
- $16,401
- IRR
- 10.1%
- Equity multiple
- 1.78×
- Total profit
- $24,132
- Equity at exit
- $9,511
Cash invested: $30,800 (down + closing). Projections, not guarantees.
Landlord ↔ Tenant lean methodology
- Overall (STATE)
- 87 Strongly Landlord-Friendly
- State Texas
- 87 Strongly Landlord-Friendly · R+5
- County
- — inherits STATE
- City
- — inherits STATE
ZIP-level market 76801
- Active inventory
- 377
- Price-to-rent
- 7.4×
Monthly cashflow live
- Estimated rent
- $1,242 medium interval (Pro) →
- Mortgage (P&I)
- −$577
- Tax from tax record
- −$70 /mo · $834/yr
- Insurance
- −$46
- HOA
- −$0
- Vacancy / Maint / Mgmt
- −$261
- Net cashflow
- $289
Break-even live
UW: 25.0% down · 7.5% · 30yr · 1.5% tax · 5.0% vac · 8.0% maint · 8.0% mgmt
Financing live
Cash to close
- Down payment
- $27,500
- Closing costs
- $3,300
- Reserves months
- —
- Total cash needed
- —
Loan-product check · same deal, 3 products live
Conventional
25% down · 7.5% · 30yr
- Down + closing
- —
- Monthly P&I
- —
- Monthly cashflow
- —
- DSCR
- —
- Eligible?
- —
Personal DTI + credit; lowest rate.
DSCR
20% down · 8.5% · 30yr
- Down + closing
- —
- Monthly P&I
- —
- Monthly cashflow
- —
- DSCR
- —
- Eligible?
- —
No personal income docs; deal must DSCR.
Hard money
10% down · 12.0% · 12mo
- Down + closing
- —
- Monthly P&I
- —
- Monthly cashflow
- —
- DSCR
- —
- Eligible?
- —
Short-term bridge; refi at stabilization.
Rent comps 2 comps
| Address | Beds | Baths | Sqft | Rent | $/sqft | DOM | Units | Dist |
|---|---|---|---|---|---|---|---|---|
| 2001 Brady Ave Unit Booker 703 Brownwood, TX | 2.0 | 1.0 | 1247 | $1,045 | $0.84 | 43d | 1 | 0.43mi |
| 2411 13th St Brownwood, TX | 3.0 | 2.0 | 1466 | $1,800 | $1.23 | 43d | 1 | 1.43mi |
Listing history 17 events
-
2026-06-18days on market $109,999 Active 134 DOM
-
2026-06-17days on market $109,999 Active 133 DOM
-
2026-06-16days on market $109,999 Active 132 DOM
-
2026-06-15days on market $109,999 Active 131 DOM
-
2026-06-13days on market $109,999 Active 129 DOM
-
2026-06-12days on market $109,999 Active 128 DOM
-
2026-06-09days on market $109,999 Active 125 DOM
-
2026-06-08days on market $109,999 Active 124 DOM
-
2026-06-08days on market $109,999 Active 123 DOM
-
2026-06-07days on market $109,999 Active 122 DOM
-
2026-06-03days on market $109,999 Active 119 DOM
-
2026-06-02days on market $109,999 Active 118 DOM
-
2026-06-01days on market $109,999 Active 117 DOM
-
2026-05-31days on market $109,999 Active 116 DOM
-
2026-02-04$109,999 Active 993-char remark
Show marketing remark (993 chars)
NEW LISTING! Don't miss the opportunity to make 1414 Avenue A your home. This property is a bit of a fixer-upper with endless potential and unique features. The home is approximately 1,837 Sq. Ft. with three bedrooms, and two bathrooms. The main area is incredibly spacious, the kitchen is equipped with plenty of cabinet and counterspace, and the bedrooms are all a great size. There is also a two-car carport and covered front porch area that adds even more charm! This home sits on an expansive 30,000 Sq. Ft. CORNER LOT that provides you with so much yard space. The location has direct access to both US-377 and US-183. WE MAKE IT EASY TO OWN. This is a great opportunity! Don't wait, call us today to get more information on the owner's easy terms and smooth process that may be able to put the deed in your name and make this your dream home. When you call be sure and ask us about the other homes we may have in this area. We might even have a PACKAGE DEAL available in this same area.
-
2023-05-08soldstatus
-
1992-08-06soldstatus
ⓘ Source: listings_history table (triggers on properties + properties_extension) + one-shot
backfill from property_details.listing_events for pre-trigger history.
Tax reassessment forecast TX · Resets to sale price
- Current annual tax
- $834 · $70/mo
- Projected year-2 tax
- $2,013 · $168/mo
- Expected delta
- +$1,179/yr (+$98/mo · 141.3%)
ⓘ Screening estimate from a state-policy table — verify with the county assessor before closing.
Climate risk First Street
- Flood 1/10 Low FEMA zone X (unshaded) · 0% chance over 30 yrs
- Wildfire 6/10 Major
- Heat 7/10 Severe 7 d/yr ≥107°F today · 23 d/yr by 30 yrs out
- Wind 6/10 Major 27% chance of damaging wind over 30 yrs
- Air quality 1/10 Low 0 unhealthy d/yr today · 0 by 30 yrs out
Nearby sold comps map
Loading sold comps map…
Walkable amenities ~0.75 mi
Loading nearby amenities…
Taxation est. · year 1
- Rental income
- $14,908
- − Mortgage interest
- −$6,162
- − Property taxes
- −$834
- − Insurance
- −$550
- − Repairs & maintenance
- −$1,193
- − Management
- −$1,193
- − Depreciation
- −$3,200
- Taxable income
- $1,777
- Est. tax owed @ 24.0%
- −$427
- After-tax cash flow
- $3,045/yr
For passive investors: Depreciation is non-cash, so a rental often shows a tax loss while cash-flowing — sheltering income. Rental losses are passive: they offset passive income freely, and up to $25,000/yr can offset ordinary (W-2) income if you actively participate and your MAGI is under $100k (phasing out to $0 by $150k); unused losses carry forward. On sale, claimed depreciation is recaptured at up to 25%, and gains may owe capital-gains tax (a 1031 exchange can defer both). Figures are a year-1 estimate at your 24.0% rate — not tax advice; consult a CPA.
Schools (NCES district)
- District
- Brownwood ISD
- NCES district ID
- 4811700
- Math proficiency
- 45% ▲ 4.00%
- Reading proficiency
- 41% ▲ 1.00%
- Median HH income
- $37,395
- Composite
- 35.8/100
- National rank
- #4833
- State rank
- #344 of 826 in TX
Livability — Brownwood
- Score
- 64/100
- State rank
- #781
- US rank
- #14230
Category grades
Schools grade is shown separately in the Schools card above.
Census & demographics
- Census place
- Brownwood, TX
- Population (ZIP)
- 25,152
Population outlook (Brown County) Hauer SSP2
- Today (2025)
- 38,381 people
- By 2030
- 38,288 · -0.2%
- By 2040
- 38,120 · -0.7%
- By 2050
- 38,227 · -0.4%
- By 2075
- 39,362 · +2.6%
- By 2100
- 39,171 · +2.1%
Race, ethnicity, and origin ACS 2023
- Neighborhood character
- Predominantly White (66%)
- Race & ethnicity
- White 66% Hispanic / Latino 26% Two or more races 15% Black 4%
- Hispanic origin (detail)
- Mexican 23%
- Common ancestry
- Italian 12% Slovak 2% Lithuanian 1%
- Foreign-born
- 4% · Canada
- Languages at home
- 82% English-only · Spanish 17%
Political lean MEDSL · Brown
- 2024 margin
- Solid R (+73.9) · D 12.7% · R 86.6%
- 2008→2024 swing
- -12.5pp toward R · 2008: -61.5pp · 2024: -73.9pp
- All cycles
- 2024: R+73.9 2020: R+72.6 2016: R+74.5 2012: R+71.7 2008: R+61.5
Not yet ingested
- Civics
- —
Market trends
- HPI YoY
- ▼ -121.52%
- Current HPI
- 164.0992
- Rent YoY
- —
- Metro
- —
- State GDP YoY
- ▲ 3.95%
- F500 in state
- 110
Industry mix (Fortune 500 HQ in TX)
| Industry | F500 HQs | Revenue |
|---|---|---|
| Energy | 16 | $1,198B |
|
||
| Technology | 5 | $198B |
|
||
| Engineering / Construction | 4 | $72B |
|
||
| Energy Services | 3 | $60B |
|
||
| Utilities | 3 | $41B |
|
||
| Healthcare | 2 | $330B |
|
||
Price history
3 events — show timeline
- 2026-02-04 Listed $109,999 HARMLS
- 2023-05-08 Sold (Public Records) — Public Records
- 1992-08-06 Sold (Public Records) — Public Records
Property tax history
-1.1%/yrLatest (2025): $834 · -2.3% YoY. Source: county tax records.
Cash-flow waterfall
monthlySold comps — $/sqft
last 12 mo · ≤1 miLoading sold comps…