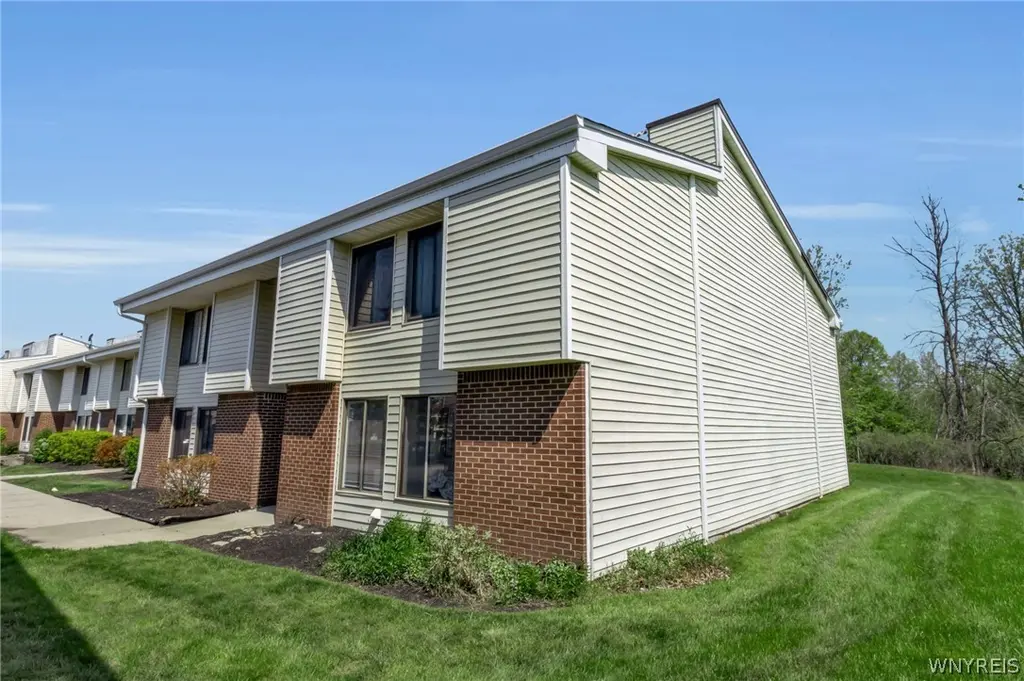
43 Bee Hunter Ct Unit A · Rapids, NY
Flood risk 4/10 · Minor
- FEMA flood zone
- X (shaded)
- Chance of flooding over 30 yrs
- 0.38%
- Est. flood insurance / yr
- $473 – $860
Fire risk 3/10 · Minor
- Est. fire insurance / yr
- $691 – $1,283
Heat risk 3/10 · Minor
- Hot days now (above 94°F)
- 7 days/yr
- Hot days in 30 yrs
- 16 days/yr
Wind risk 1/10 · Minimal
- Chance of severe wind over 30 yrs
- —
Air-quality risk 2/10 · Minimal
- Unhealthy air days now
- 2 days/yr
- Unhealthy air days in 30 yrs
- 2 days/yr
Risk factors via First Street. Map © Google.
Why this score? — see what drove the C grade
The composite is a weighted blend of 9 inputs, each scored 0–100. Each bar is that input's sub-score; the figure is the points it added to the 100-point composite (weight × sub-score).
- Cash flow +20.5/30.0
- ARV discount +7.5/15.0
- 1% rule +7.0/10.0
- DSCR +6.5/10.0
- Schools +6.3/10.0
- Rent growth +3.9/5.0
- Livability +2.5/5.0
- Condition / age +2.5/5.0
- Appreciation +0.0/10.0
$149,900
🖨 Deal sheet 📄 Offer letter ✓ Due diligence
Listing remarks
43 Beehunter Unit A offers one of the best condo locations you’ll find! This beautifully maintained first-floor, end-unit condo combines easy living with a setting that feels incredibly private and peaceful. With no stairs to worry about, this 1-bedroom, 1-bath unit looks out to a gorgeous wooded yard surrounding Ransom Creek, where you can enjoy watching deer and other wildlife right from your home. Inside, the unit has been freshly painted, features brand new carpet, and is completely move-in ready for its next owner. All of this in the highly regarded Williamsville School District! Enjoy pool, tennis courts, and other amenities part of the Ransom Oaks community.
Key facts
- End-unit
- Ransom creek
- Wooded yard
Tags
Property features AI
Finance
- Financial info: Pets allowed: cats and dogs (size limit)
- HOA & community: Fairwood association with a monthly fee of $233; Association fee includes common area maintenance, structure maintenance, sewer, snow removal, trash and water
Exterior
- Parking: Assigned open parking space (one space); No garage
- Utilities: Public water (connected); Sewer connected
- Home design: Single-story property; Existing/resale condition
- Construction: Slab foundation; See remarks for construction materials
- Exterior features: Rectangular lot; Private road frontage
Interior
- Kitchen: Electric oven; Electric range; Refrigerator
- Bedrooms: One main-level bedroom
- Flooring: Carpet; Varies
- Bathrooms: One full bathroom (main level)
- Heating & cooling: Gas forced-air heating; Central air conditioning
- Interior features: Separate/formal dining room
- Laundry & utility: Gas water heater
Neighborhood map
What this means for you Summary
Snapshot
- This is a 1-bed/1.0-bath condo listed at $150k.
Deal economics
- At list price, monthly cash flow is $196 ($2k/yr) — positive.
- The deal already cash-flows at list — no discount required.
- Meets the 1% rule at list price ($2k rent vs $150k).
- Recommended offer: $148k (1.5% below list) — sets the bar for market timing.
Location & tenants
- Location reads 49/100 on livability (#1,176 in NY) — a working-class tenant base; expect higher turnover. Strengths: cost of living A+, crime A; Watch: schools D+, amenities F, commute F.
- Williamsville Central School District (suburban): math 64% / reading 77% proficiency, ranked #114 of 590 in NY (top 19%) — strong family-tenant draw, lease renewals of 3-5y typical; only 10% free/reduced lunch — higher-income household profile.
- Market conditions: Rents rising fast (+5.6%/yr); 152 active listings in the ZIP; 4 comparable units currently listed for rent nearby; rentals leasing fast (median 2d on market — plan ~1-2 weeks tenant-placement turnaround); high-income renter base; 1,244 units permitted in Erie County in 2024 (563 in 5+ unit buildings).
- This rent is only 16% of the median local income ($136k/yr) — well below the 30% rent-burden line; pricing power to push rent on renewal without tenant pushback.
Forward outlook
- Local home prices are declining (-3.0%/yr); year-one equity from $1k of loan paydown is wiped out by about $4k of value loss. Plan a longer hold.
- At projected returns (-3.0% appreciation + 5.6% rent growth), your $42k cash investment doubles in ~10 years — after that, you're playing with house money.
Negotiation context
- It's been on market 20 days — a 2% lower offer ($148k) is reasonable based on typical stale-listing flexibility.
- Current owner paid $58k; list at $150k implies a 157% gain — meaningful room to come down on a strong offer.
Questions for the listing agent
- Built in 1973 — when were the roof, HVAC, electrical panel, plumbing, and water heater last replaced?
- What does the HOA fee cover, when was the last increase, and are there any pending special assessments or reserve-fund shortfalls?
- Any open or pending special assessments — roof, HVAC, plumbing, elevator, façade? What's the per-unit balance and payoff schedule, and is the seller paying it off at close or rolling it to the buyer?
- Is there a deadline driving the sale (1031 exchange, divorce, estate, relocation)? That informs how much negotiation room exists.
- Schools are D-rated, which usually means shorter tenancies and higher turnover. Who's the typical renter profile here, and what's been the actual vacancy rate?
- What's the average days-on-market for RENTAL listings here right now (not sales)? A rising rental-DOM trend means longer vacancies and softer asking-rent achievability than the comps imply.
- What's the recent tenant-quality profile in this submarket — average credit score on applications, eviction rate, late-payment / NSF rate, and stable-employment percentage? A property-management company in the area should have these aggregated.
- How much new apartment / multifamily construction is in the pipeline within 1–3 miles? Heavy new supply (>2% of stock underway) typically softens rents 12–24 months out; light construction supports rent growth.
Investment metrics
- 1% rule
- 1.20% ✓
- Cap rate
- 7.86%
- Cash-on-cash
- 5.61%
- DSCR
- 1.25
- GRM
- 6.9
CMA / ARV
No comps found within radius.
Projected returns pro-forma
-3.0% appreciation · 5.59% rent growth · sell at horizon
- IRR
- -4.2%
- Equity multiple
- 0.84×
- Total profit
- $-6,826
- Equity at exit
- $22,351
- IRR
- 8.7%
- Equity multiple
- 1.75×
- Total profit
- $31,588
- Equity at exit
- $12,961
Cash invested: $41,972 (down + closing). Projections, not guarantees.
Landlord ↔ Tenant lean methodology
- Overall (STATE)
- 15 Strongly Tenant-Friendly
- State New York
- 15 Strongly Tenant-Friendly · D+10
- County
- — inherits STATE
- City
- — inherits STATE
ZIP-level market 14051
- Home prices YoY
- -22.5%
- Rents YoY
- 5.6%
- Active inventory
- 152
- Price-to-rent
- 6.9×
Monthly cashflow live
- Estimated rent
- $1,802 medium interval (Pro) →
- Mortgage (P&I)
- −$786
- Tax from tax record
- −$146 /mo · $1,747/yr
- Insurance
- −$62
- HOA
- −$233
- Vacancy / Maint / Mgmt
- −$378
- Net cashflow
- $196
Break-even live
UW: 25.0% down · 7.5% · 30yr · 1.5% tax · 5.0% vac · 8.0% maint · 8.0% mgmt
Financing live
Cash to close
- Down payment
- $37,475
- Closing costs
- $4,497
- Reserves months
- —
- Total cash needed
- —
Loan-product check · same deal, 3 products live
Conventional
25% down · 7.5% · 30yr
- Down + closing
- —
- Monthly P&I
- —
- Monthly cashflow
- —
- DSCR
- —
- Eligible?
- —
Personal DTI + credit; lowest rate.
DSCR
20% down · 8.5% · 30yr
- Down + closing
- —
- Monthly P&I
- —
- Monthly cashflow
- —
- DSCR
- —
- Eligible?
- —
No personal income docs; deal must DSCR.
Hard money
10% down · 12.0% · 12mo
- Down + closing
- —
- Monthly P&I
- —
- Monthly cashflow
- —
- DSCR
- —
- Eligible?
- —
Short-term bridge; refi at stabilization.
Rent comps 4 comps
| Address | Beds | Baths | Sqft | Rent | $/sqft | DOM | Units | Dist |
|---|---|---|---|---|---|---|---|---|
| 45 Beehunter Ct Unit D East Amherst, NY | 2.0 | 2.0 | 1102 | $1,850 | $1.68 | 43d | 1 | 0.02mi |
| 20 Dockside Pkwy East Amherst, NY | 1.0–3.0 | 1.0–2.0 | 1120 | $1,685 | $1.50 | 1d | 11 | 1.22mi |
| 4410-4420 N French Rd East Amherst, NY | 1.0–3.0 | 1.0–2.5 | 1176 | $1,750 | $1.49 | 1d | 1 | 1.42mi |
| 5 Autumn Creek Ln East Amherst, NY | 1.0–2.0 | 1.0–2.0 | 1120 | $1,729 | $1.54 | 1d | 10 | 1.49mi |
HOA detail condo
- Monthly dues
- $233 · $2,796/yr
- Likely covers
- pool
- Assessments
- None detected in remarks — confirm with the listing agent.
Listing history 11 events
-
2026-06-10status $149,900 Pending 20 DOM
-
2026-06-09days on market $149,900 Active 20 DOM
-
2026-06-08days on market $149,900 Active 19 DOM
-
2026-06-07days on market $149,900 Active 18 DOM
-
2026-06-05days on market $149,900 Active 15 DOM
-
2026-06-03days on market $149,900 Active 14 DOM
-
2026-06-02days on market $149,900 Active 13 DOM
-
2026-06-01days on market $149,900 Active 12 DOM
-
2026-05-31days on market $149,900 Active 11 DOM
-
2026-05-20$149,900 Active
-
2009-09-17soldstatus $58,300
ⓘ Source: listings_history table (triggers on properties + properties_extension) + one-shot
backfill from property_details.listing_events for pre-trigger history.
Tax reassessment forecast NY · Partial reset (capped growth)
- Current annual tax
- $1,747 · $146/mo
- Projected year-2 tax
- $2,140 · $178/mo
- Expected delta
- +$393/yr (+$33/mo · 22.5%)
ⓘ Screening estimate from a state-policy table — verify with the county assessor before closing.
Climate risk First Street
- Flood 4/10 Moderate FEMA zone X (shaded) · 38% chance over 30 yrs
- Wildfire 3/10 Moderate
- Heat 3/10 Moderate 7 d/yr ≥94°F today · 16 d/yr by 30 yrs out
- Wind 1/10 Low
- Air quality 2/10 Low 2 unhealthy d/yr today · 2 by 30 yrs out
Nearby sold comps map
Loading sold comps map…
Walkable amenities ~0.75 mi
Loading nearby amenities…
Taxation est. · year 1
- Rental income
- $21,622
- − Mortgage interest
- −$8,397
- − Property taxes
- −$1,747
- − Insurance
- −$750
- − Repairs & maintenance
- −$1,730
- − Management
- −$1,730
- − HOA
- −$2,796
- − Depreciation
- −$4,361
- Taxable income
- $112
- Est. tax owed @ 24.0%
- −$27
- After-tax cash flow
- $2,329/yr
For passive investors: Depreciation is non-cash, so a rental often shows a tax loss while cash-flowing — sheltering income. Rental losses are passive: they offset passive income freely, and up to $25,000/yr can offset ordinary (W-2) income if you actively participate and your MAGI is under $100k (phasing out to $0 by $150k); unused losses carry forward. On sale, claimed depreciation is recaptured at up to 25%, and gains may owe capital-gains tax (a 1031 exchange can defer both). Figures are a year-1 estimate at your 24.0% rate — not tax advice; consult a CPA.
Schools (NCES district)
- District
- Williamsville Central School District
- NCES district ID
- 3631470
- Math proficiency
- 64% ▼ -14.00%
- Reading proficiency
- 77% ▲ 6.00%
- Median HH income
- $79,907
- Composite
- 62.59/100
- National rank
- #678
- State rank
- #114 of 590 in NY
Livability — Rapids
- Score
- 49/100
- State rank
- #1176
- US rank
- #25855
Category grades
Schools grade is shown separately in the Schools card above.
Census & demographics
- County
- Erie County · 714,559 people
- Metro
- Buffalo-Cheektowaga, NY
- Population (ZIP)
- 19,739
- Household income
- $135,663
- Rent vs Own
- Severe rent burden
- 375.0
Population outlook (Erie County) Hauer SSP2
- Today (2025)
- 933,037 people
- By 2030
- 935,181 · +0.2%
- By 2040
- 928,531 · -0.5%
- By 2050
- 905,725 · -2.9%
- By 2075
- 834,037 · -10.6%
- By 2100
- 708,033 · -24.1%
Race, ethnicity, and origin ACS 2023
- Neighborhood character
- Predominantly White (82%)
- Race & ethnicity
- White 82% Asian 9% Two or more races 4% Hispanic / Latino 4% Black 2%
- Common ancestry
- Romanian 13% Italian 2% Subsaharan African 2%
- Foreign-born
- 14% · Canada, China, Jamaica
- Languages at home
- 85% English-only · Other Indo-European 6% Chinese 2% Russian/Polish/Slavic 2%
Political lean MEDSL · Erie
- 2024 margin
- Lean D (+9.7) · D 54.8% · R 45.2%
- 2008→2024 swing
- -7.9pp toward R · 2008: 17.5pp · 2024: 9.7pp
- All cycles
- 2024: D+9.7 2020: D+14.7 2016: D+4.8 2012: D+15.6 2008: D+17.5
Not yet ingested
- Civics
- —
Market trends
- HPI YoY
- ▼ -93.55%
- Current HPI
- 322.688
- Rent YoY
- ▲ 5.59%
- Metro
- Buffalo-Cheektowaga, NY
- State GDP YoY
- ▲ 2.60%
- F500 in state
- 92
Industry mix (Fortune 500 HQ in NY)
| Industry | F500 HQs | Revenue |
|---|---|---|
| Financial Services | 10 | $950B |
|
||
| Consumer Goods | 9 | $162B |
|
||
| Insurance | 4 | $225B |
|
||
| Telecommunications | 2 | $144B |
|
||
| Pharmaceuticals | 2 | $112B |
|
||
| Media / Entertainment | 2 | $69B |
|
||
Price history
+157.1% since first listed2 events — show timeline
- 2026-05-20 Listed $149,900 WNYREIS
- 2009-09-17 Sold (Public Records) $58,300 Public Records
Property tax history
+2.8%/yrLatest (2025): $1,747 · +1.6% YoY. Source: county tax records.
Cash-flow waterfall
monthlySold comps — $/sqft
last 12 mo · ≤1 miLoading sold comps…