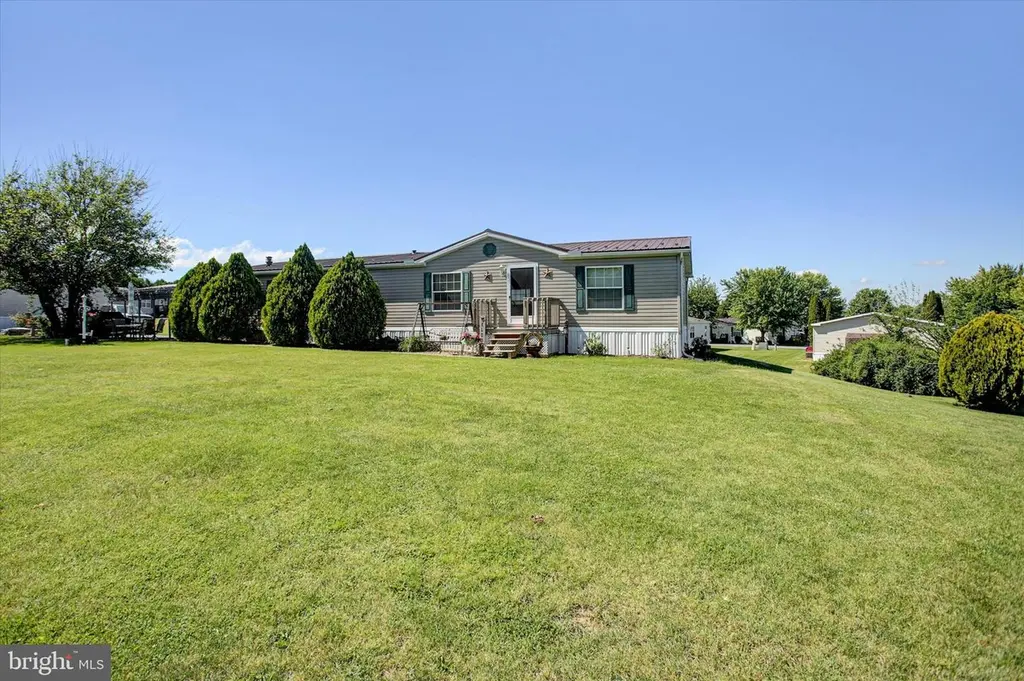
64 Tiffany Dr · Southampton, PA
Flood risk 9/10 · Severe
- FEMA flood zone
- X (unshaded)
- Chance of flooding over 30 yrs
- 0.99%
- Est. flood insurance / yr
- $507 – $1,088
Fire risk 1/10 · Minimal
- Est. fire insurance / yr
- $511 – $949
Heat risk 5/10 · Moderate
- Hot days now (above 99°F)
- 7 days/yr
- Hot days in 30 yrs
- 16 days/yr
Wind risk 2/10 · Minimal
- Chance of severe wind over 30 yrs
- 3.0%
Air-quality risk 2/10 · Minimal
- Unhealthy air days now
- 1 days/yr
- Unhealthy air days in 30 yrs
- 2 days/yr
Risk factors via First Street. Map © Google.
Why this score? — see what drove the C grade
The composite is a weighted blend of 9 inputs, each scored 0–100. Each bar is that input's sub-score; the figure is the points it added to the 100-point composite (weight × sub-score).
- Cash flow +27.3/30.0
- DSCR +9.5/10.0
- 1% rule +7.4/10.0
- Schools +3.5/10.0
- Rent growth +2.5/5.0
- Livability +2.5/5.0
- Condition / age +2.2/5.0
- ARV discount +0.0/15.0
- Appreciation +0.0/10.0
$125,000
🖨 Deal sheet (PDF) 📄 Offer letter ✓ Due diligence
Listing remarks
Beautiful and well-maintained 3-bedroom, 2-bath home offering convenient one-floor living. This spacious home not only features a detached carport, and shed for extra storage, but an enclosed sun porch, providing the perfect place to relax and enjoy the seasons. With plenty of room throughout, you'll appreciate the comfortable layout and pride of ownership. Financing assistance available through local lenders—ask your agent for more information. Buyer must obtain park approval promptly upon acceptance of an offer.
Key facts
- Detached carport
- Extra storage
- One-floor living
Tags
Property features AI
Finance
- Other: Property manager present; Not in a federal flood zone; Property condition listed as excellent
- Financial info: Monthly ground rent payment; Ownership interest: Ground rent
- HOA & community: Property located in Mount Rock Manor park; Ground rent exists (paid monthly)
Exterior
- Parking: Detached carport (2 spaces); Asphalt driveway; Two total garage/parking spaces
- Utilities: Public water; Public sewer; Electric service
- Home design: Manufactured double-wide (Commadore); Estimated year built; End-of-road location (property at the end on the left)
- Construction: Vinyl siding; Metal roof; Above-grade structures
- Exterior features: Front yard; No thru street; Rented lot; Enclosed porch; Porches; Breezeway; Shed; Located in a park (Mount Rock Manor)
Interior
- Kitchen: Stove; Refrigerator; Dishwasher; Water conditioner (owned)
- Bedrooms: Three bedrooms on the main level; Rooms include: Living Room, Master Bedroom, Bedroom 2, Bedroom 3, Kitchen, Laundry
- Flooring: Carpet; Vinyl
- Bathrooms: Two full bathrooms on the main level
- Heating & cooling: Forced air heating (oil); Central air conditioning; Electric hot water
- Interior features: Combination dining/living area; Combination kitchen/dining area; Breakfast area; Insulated doors; No basement
- Laundry & utility: Main floor laundry
Neighborhood map
What this means for you Summary
Snapshot
- This is a 3-bed/2.0-bath single-family listed at $125k. Condition is rated fair.
Deal economics
- At list price, monthly cash flow is $296 ($4k/yr) — positive.
- The deal already cash-flows at list — no discount required.
- Meets the 1% rule at list price ($2k rent vs $125k).
- Recommended offer: $123k (1.5% below list) — sets the bar for market timing.
Location & tenants
- Location reads: area grade C — affects rentability + tenant quality, not the cash-flow math above.
- Shippensburg Area SD (town): math 31% / reading 52% proficiency, ranked #335 of 539 in PA (top 62%) — families likely to look elsewhere, expect single-tenant / working-renter base with shorter leases.
- Market conditions: 161 active listings in the ZIP; 633 units permitted in Franklin County in 2024 (112 in 5+ unit buildings).
Forward outlook
- Local home prices are declining (-3.0%/yr); year-one equity from $864 of loan paydown is wiped out by about $4k of value loss. Plan a longer hold.
Negotiation context
- It's been on market 15 days — a 2% lower offer ($123k) is reasonable based on typical stale-listing flexibility.
Risks & watch-outs
- Watch-outs: flood insurance adds $66/mo.
- Climate carrying-cost: severe flood risk; extreme-heat days projected 7→16/yr by 2055 (HVAC capex compounding) — expect insurance premiums to compound above CPI over the hold.
Questions for the listing agent
- Have any recent inspections been done? Can we get a copy of the seller's disclosures and any deferred-maintenance estimates?
- What's the actual annual flood-insurance premium (NFIP or private), and is the property in a SFHA with mandatory coverage?
- Is there a deadline driving the sale (1031 exchange, divorce, estate, relocation)? That informs how much negotiation room exists.
- What's the average days-on-market for RENTAL listings here right now (not sales)? A rising rental-DOM trend means longer vacancies and softer asking-rent achievability than the comps imply.
- What's the recent tenant-quality profile in this submarket — average credit score on applications, eviction rate, late-payment / NSF rate, and stable-employment percentage? A property-management company in the area should have these aggregated.
- How much new for-sale + rental construction is in the pipeline within 1–3 miles? Heavy new supply typically softens prices + rents 12–24 months out; constrained supply supports both.
Investment metrics
- 1% rule
- 1.24% ✓
- Cap rate
- 9.77%
- Cash-on-cash
- 12.43%
- DSCR
- 1.55
- GRM
- 6.7
CMA / ARV
- ARV (on-the-fly)
- $101,790
- Comps found
- 5
Show comp detail 5 sales within ~0.75 mi
| Address | Dist | Beds/Ba | Sqft | Sold | Price | $/sf | Match |
|---|---|---|---|---|---|---|---|
| 12 Lenwood Park #12 | 0.25mi | 3/2.0 | 1,680 (-4%) | 13mo | $85,000 | $51 | 70 |
| 14 Tiffany Dr | 0.09mi | 3/2.0 | 1,544 (-12%) | 8mo | $90,000 | $58 | 69 |
| 100 Mount Rock Rd #5 | 0.07mi | 3/2.0 | 1,563 (-11%) | 21mo | $114,000 | $73 | 61 |
| 8074 Molly Pitcher Hwy | 0.48mi | 4/2.0 (+1) | 1,804 (+3%) | 10mo | $286,000 | $159 | 59 |
| 8 Travis Ave | 0.02mi | 4/2.0 (+1) | 2,000 (+14%) | 17mo | $89,900 | $45 | 56 |
Match score weights: distance 35% · size 25% · config 20% · recency 20%. Top-matched comps best support the ARV.
Projected returns pro-forma
-3.0% appreciation · 3.0% rent growth · sell at horizon
- IRR
- -1.0%
- Equity multiple
- 0.96×
- Total profit
- $-1,335
- Equity at exit
- $18,638
- IRR
- 8.7%
- Equity multiple
- 1.67×
- Total profit
- $23,379
- Equity at exit
- $10,808
Cash invested: $35,000 (down + closing). Projections, not guarantees.
Landlord ↔ Tenant lean methodology
- Overall (STATE)
- 62 Landlord-Friendly
- State Pennsylvania
- 62 Landlord-Friendly · EVEN
- County
- — inherits STATE
- City
- — inherits STATE
ZIP-level market 17257
- Home prices YoY
- -17.3%
- Active inventory
- 161
- Price-to-rent
- 6.7×
Monthly cashflow live
- Estimated rent
- $1,552 medium interval (Pro) →
- Mortgage (P&I)
- −$656
- Tax est. 1.5%
- −$156 /mo · $1,875/yr
- Insurance
- −$52
- Flood insurance flood zone
- −$66 /mo · $798/yr
- HOA
- −$0
- Vacancy / Maint / Mgmt
- −$326
- Net cashflow
- $296
Break-even live
Sensitivity live
| Price | -10% $382 | -5% $339 | +0% $296 | +5% $253 | +10% $210 |
|---|---|---|---|---|---|
| Rent | -10% $173 | -5% $235 | +0% $296 | +5% $357 | +10% $419 |
| Rate | -1.0pp $359 | -0.5pp $328 | base $296 | +0.5pp $264 | +1.0pp $231 |
UW: 25.0% down · 7.5% · 30yr · 1.5% tax · 5.0% vac · 8.0% maint · 8.0% mgmt
Financing live
Cash to close
- Down payment
- $31,250
- Closing costs
- $3,750
- Reserves months
- —
- Total cash needed
- —
Loan-product check · same deal, 3 products live
Conventional
25% down · 7.5% · 30yr
- Down + closing
- —
- Monthly P&I
- —
- Monthly cashflow
- —
- DSCR
- —
- Eligible?
- —
Personal DTI + credit; lowest rate.
DSCR
20% down · 8.5% · 30yr
- Down + closing
- —
- Monthly P&I
- —
- Monthly cashflow
- —
- DSCR
- —
- Eligible?
- —
No personal income docs; deal must DSCR.
Hard money
10% down · 12.0% · 12mo
- Down + closing
- —
- Monthly P&I
- —
- Monthly cashflow
- —
- DSCR
- —
- Eligible?
- —
Short-term bridge; refi at stabilization.
Listing history 11 events
-
2026-06-18days on market $125,000 Active 15 DOM
-
2026-06-17days on market $125,000 Active 14 DOM
-
2026-06-16days on market $125,000 Active 13 DOM
-
2026-06-15days on market $125,000 Active 12 DOM
-
2026-06-14days on market $125,000 Active 10 DOM
-
2026-06-13days on market $125,000 Active 9 DOM
-
2026-06-10days on market $125,000 Active 7 DOM
-
2026-06-09days on market $125,000 Active 6 DOM
-
2026-06-08days on market $125,000 Active 5 DOM
-
2026-06-07remarks 519-char remark
-
2026-06-07$125,000 Active 4 DOM
ⓘ Source: listings_history table (triggers on properties + properties_extension) + one-shot
backfill from property_details.listing_events for pre-trigger history.
Climate risk First Street
- Flood 9/10 Extreme FEMA zone X (unshaded) · 99% chance over 30 yrs
- Wildfire 1/10 Low
- Heat 5/10 Major 7 d/yr ≥99°F today · 16 d/yr by 30 yrs out
- Wind 2/10 Low 3% chance of damaging wind over 30 yrs
- Air quality 2/10 Low 1 unhealthy d/yr today · 2 by 30 yrs out
Nearby sold comps map
Loading sold comps map…
Walkable amenities ~0.75 mi
Loading nearby amenities…
Taxation est. · year 1
- Rental income
- $18,628
- − Mortgage interest
- −$7,002
- − Property taxes
- −$1,875
- − Insurance
- −$1,422
- − Repairs & maintenance
- −$1,490
- − Management
- −$1,490
- − Depreciation
- −$3,636
- Taxable income
- $1,712
- Est. tax owed @ 24.0%
- −$411
- After-tax cash flow
- $3,142/yr
For passive investors: Depreciation is non-cash, so a rental often shows a tax loss while cash-flowing — sheltering income. Rental losses are passive: they offset passive income freely, and up to $25,000/yr can offset ordinary (W-2) income if you actively participate and your MAGI is under $100k (phasing out to $0 by $150k); unused losses carry forward. On sale, claimed depreciation is recaptured at up to 25%, and gains may owe capital-gains tax (a 1031 exchange can defer both). Figures are a year-1 estimate at your 24.0% rate — not tax advice; consult a CPA.
Condition & rehab AI · 13 photos
The home is in fair condition with some minor repairs and maintenance needed. Painting, flooring, and bathroom fixtures can significantly increase its resale value.
Repairs flagged
- Minor Paint — Paint appears to be in fair condition, with some wear visible.
- Minor Flooring — Hardwood flooring in the kitchen and dining area appears to be in fair condition, with some wear visible.
- Minor Bathroom Fixtures — Bathroom fixtures appear to be in fair condition, with some wear visible.
Value-add opportunities
- Resale Painting — Painting can significantly improve the home's curb appeal and overall appearance, which can increase its resale value.
- Resale Flooring — Replacing worn-out flooring can improve the home's appearance and increase its resale value.
- Resale Bathroom Fixtures — Updating worn-out bathroom fixtures can improve the home's appearance and increase its resale value.
Renovation cost estimate screening
| Repair item | Severity | Est. cost |
|---|---|---|
| Paint · Paint appears to be in fair condition, with some wear visible. | Minor | $500–3,000 |
| Flooring · Hardwood flooring in the kitchen and dining area appears to be in fair condition, with some wear visible. | Minor | $500–3,000 |
| Bathroom Fixtures · Bathroom fixtures appear to be in fair condition, with some wear visible. | Minor | $500–3,000 |
| Total estimated repair cost · 3 items | $1,500–9,000 |
Value-add ROI direction
- Resale Painting — Painting can significantly improve the home's curb appeal and overall appearance, which can increase its resale value. ↑
- Resale Flooring — Replacing worn-out flooring can improve the home's appearance and increase its resale value. ↑
- Resale Bathroom Fixtures — Updating worn-out bathroom fixtures can improve the home's appearance and increase its resale value. ↑
ⓘ Cost ranges are severity-bucket heuristics (US national rule-of-thumb). Get contractor quotes + a written scope before underwriting a rehab budget.
Schools (NCES district)
- District
- Shippensburg Area SD
- NCES district ID
- 4221570
- Math proficiency
- 31% ▼ -21.00%
- Reading proficiency
- 52% ▼ -14.00%
- Median HH income
- $47,585
- Composite
- 35.42/100
- National rank
- #4938
- State rank
- #335 of 539 in PA
Livability — Southampton
No livability data for this city. (Only ~50 U.S. cities are tracked.)
Census & demographics
- County
- Cumberland County · 257,673 people
- Metro
- Harrisburg-Carlisle, PA
- Population (ZIP)
- 29,204
- Household income
- $71,181
- Rent vs Own
- Severe rent burden
- 855.0
Population outlook (Franklin County) Hauer SSP2
- Today (2025)
- 157,827 people
- By 2030
- 158,933 · +0.7%
- By 2040
- 159,060 · +0.8%
- By 2050
- 155,132 · -1.7%
- By 2075
- 138,545 · -12.2%
- By 2100
- 112,321 · -28.8%
Race, ethnicity, and origin ACS 2023
- Neighborhood character
- Predominantly White (89%)
- Race & ethnicity
- White 89% Black 4% Two or more races 3% Hispanic / Latino 3% Asian 2%
- Common ancestry
- Romanian 2% Slovak 2% Serbian 1%
- Foreign-born
- 4% · Canada, China
- Languages at home
- 90% English-only · German/W. Germanic 5% Spanish 2% Other Indo-European 1%
Political lean MEDSL · Franklin
- 2024 margin
- Solid R (+43.0) · D 28.1% · R 71.1%
- 2008→2024 swing
- -10.4pp toward R · 2008: -32.6pp · 2024: -43.0pp
- All cycles
- 2024: R+43.0 2020: R+43.1 2016: R+46.5 2012: R+38.5 2008: R+32.6
Not yet ingested
- Civics
- —
Market trends
- HPI YoY
- ▼ -62.12%
- Current HPI
- 297.1586
- Rent YoY
- —
- Metro
- Harrisburg-Carlisle, PA
- State GDP YoY
- ▲ 1.68%
- F500 in state
- 34
Industry mix (Fortune 500 HQ in PA)
| Industry | F500 HQs | Revenue |
|---|---|---|
| Healthcare | 2 | $309B |
|
||
| Insurance | 2 | $27B |
|
||
| Telecommunications / Media | 1 | $124B |
|
||
| Industrial Distribution | 1 | $22B |
|
||
| Financial Services | 1 | $20B |
|
||
| Chemicals / Materials | 1 | $18B |
|
||
Price history
1 event — show timeline
- 2026-06-03 Listed $125,000 BRIGHT MLS
Cash-flow waterfall
monthlySold comps — $/sqft
last 12 mo · ≤1 miLoading sold comps…