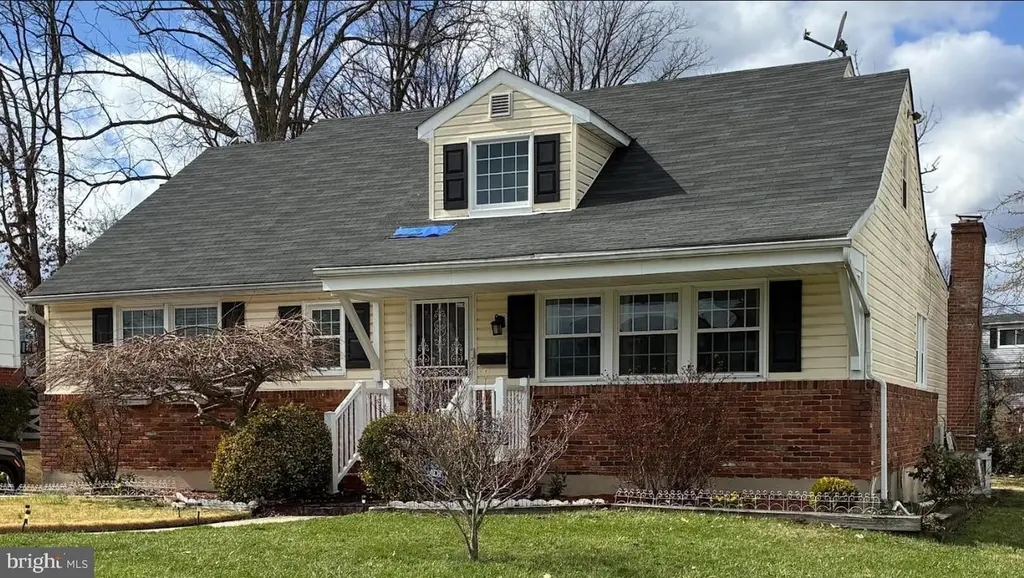
1912 Greengage Rd · Woodlawn, MD
Flood risk 1/10 · Minimal
- FEMA flood zone
- X (unshaded)
- Chance of flooding over 30 yrs
- 0.0%
- Est. flood insurance / yr
- $473 – $860
Fire risk 3/10 · Minor
- Est. fire insurance / yr
- $755 – $1,403
Heat risk 6/10 · Moderate
- Hot days now (above 103°F)
- 7 days/yr
- Hot days in 30 yrs
- 15 days/yr
Wind risk 4/10 · Minor
- Chance of severe wind over 30 yrs
- 17.0%
Air-quality risk 3/10 · Minor
- Unhealthy air days now
- 2 days/yr
- Unhealthy air days in 30 yrs
- 4 days/yr
Risk factors via First Street. Map © Google.
Why this score? — see what drove the C- grade
The composite is a weighted blend of 9 inputs, each scored 0–100. Each bar is that input's sub-score; the figure is the points it added to the 100-point composite (weight × sub-score).
- Cash flow +16.8/30.0
- ARV discount +15.0/15.0
- DSCR +5.2/10.0
- 1% rule +4.2/10.0
- Livability +3.9/5.0
- Rent growth +3.5/5.0
- Condition / age +2.5/5.0
- Schools +2.3/10.0
- Appreciation +0.0/10.0
$350,000
🖨 Deal sheet 📄 Offer letter ✓ Due diligence
Listing remarks MLS
Stay tuned, more details professional photos coming soon!
Key facts
- 8,775 sq ft lot
- Built 1962
- Listed 73 days
Neighborhood map
What this means for you Summary
Snapshot
- This is a 5-bed/2.5-bath single-family listed at $350k.
Deal economics
- At list price, monthly cash flow is $222 ($3k/yr) — positive.
- The deal already cash-flows at list — no discount required.
- To meet the 1% rule (rent ≥ 1% of price), the offer needs to be $323k (7.6% below list).
- Recommended offer: $323k (7.6% below list) — sets the bar for 1% rule.
- Cap rate 7.1% vs local median 4.3% in Woodlawn — top-decile yield for the area; either an underpriced asset or a hidden risk that comps aren't pricing in. Stress-test before assuming the spread holds.
Location & tenants
- Location reads 77/100 on livability (#78 in MD, #2,926 nationally) — a middle-class / working-renter tenant base. Strengths: commute A+, housing A+, employment A-; Watch: amenities D+, crime F.
- Baltimore County Public Schools (suburban): math 15% / reading 34% proficiency, ranked #11 of 24 in MD (top 46%) — low school quality limits family demand, transient renter base, plan for 1-2y turnover.
- Market conditions: Rents rising (+3.9%/yr); 74 active listings in the ZIP; 6 comparable units currently listed for rent nearby; rentals at typical pace (median 20d on market — plan ~3-4 weeks tenant-placement turnaround); solid renter incomes; 1,511 units permitted in Baltimore County in 2024 (643 in 5+ unit buildings).
- At $3,233/mo this rent would consume 46% of the median local household income ($85k/yr) (locally 1434% of renters already pay >50% of income on rent) — very limited rent-growth headroom before tenants either downsize or default.
Forward outlook
- Local home prices are declining (-3.0%/yr); year-one equity from $2k of loan paydown is wiped out by about $10k of value loss. Plan a longer hold.
- Baltimore County population projected at +12% by 2050 — modest demand growth; plan on rents tracking national, not racing it.
Negotiation context
- It's been on market 74 days — a 6% lower offer ($329k) is reasonable based on typical stale-listing flexibility.
- 9 sale attempts since 17y ago; this cycle's ask is 40% above the opening price — seller raised mid-cycle; expect resistance to lowballs.
- Current owner paid $246k; 42% above their basis — modest negotiation headroom, anchor on the comps not their cost.
Risks & watch-outs
- Climate carrying-cost: extreme-heat days projected 7→15/yr by 2055 (HVAC capex compounding) — expect insurance premiums to compound above CPI over the hold.
Questions for the listing agent
- It's been on market 74 days. Have you received any prior offers? Is the seller open to a 8% concession, seller financing, or rate buy-down credit?
- Built in 1962 — when were the roof, HVAC, electrical panel, plumbing, and water heater last replaced?
- Why hasn't it sold? Are there any deal-killer items the seller is aware of (foundation, flood, title, zoning, code violations)?
- Is there a deadline driving the sale (1031 exchange, divorce, estate, relocation)? That informs how much negotiation room exists.
- Schools are B-rated — typically a magnet for longer-tenancy family renters. What's the average tenant stay here, and is there a school-zone premium baked into asking?
- Crime grade is F in this area — have there been break-ins, vandalism, or insurance claims at this property in the last 3 years? What carrier currently insures it and at what premium?
- What's the average days-on-market for RENTAL listings here right now (not sales)? A rising rental-DOM trend means longer vacancies and softer asking-rent achievability than the comps imply.
- What's the recent tenant-quality profile in this submarket — average credit score on applications, eviction rate, late-payment / NSF rate, and stable-employment percentage? A property-management company in the area should have these aggregated.
- How much new for-sale + rental construction is in the pipeline within 1–3 miles? Heavy new supply typically softens prices + rents 12–24 months out; constrained supply supports both.
Investment metrics
- 1% rule
- 0.92% ✗
- Cap rate
- 7.05%
- Cash-on-cash
- 2.72%
- DSCR
- 1.12
- GRM
- 9.0
CMA / ARV
- ARV (median comp)
- $440,724
- List price
- $350,000
- Delta
- -20.59%
- Verdict
- UNDERPRICED
- Comps
- 19 within 1.0 mi
Show comp detail 7 sales within ~0.75 mi
| Address | Dist | Beds/Ba | Sqft | Sold | Price | $/sf | Match |
|---|---|---|---|---|---|---|---|
| 2025 Greengage Rd | 0.39mi | 4/2.0 (-1) | 2,336 (-6%) | 3mo | $415,000 | $178 | 62 |
| 7208 Inwood Ave | 0.43mi | 4/2.5 (-1) | 2,426 (-3%) | 16mo | $515,000 | $212 | 57 |
| 7209 Pinecrest Rd | 0.51mi | 4/3.0 (-1) | 2,408 (-3%) | 9mo | $400,000 | $166 | 56 |
| 7201 Fairbrook Rd | 0.22mi | 5/3.0 | 2,220 (-11%) | 18mo | $375,000 | $169 | 54 |
| 2012 N Rolling Rd | 0.38mi | 5/2.5 | 2,680 (+8%) | 22mo | $410,000 | $153 | 51 |
| 2106 Kalb Mnr | 0.63mi | 5/3.0 | 2,278 (-9%) | 22mo | $365,000 | $160 | 36 |
| 12 Forest Rock Ct | 0.59mi | 4/3.0 (-1) | 2,235 (-10%) | 21mo | $414,000 | $185 | 30 |
Match score weights: distance 35% · size 25% · config 20% · recency 20%. Top-matched comps best support the ARV.
Projected returns pro-forma
-3.0% appreciation · 3.86% rent growth · sell at horizon
- IRR
- -11.1%
- Equity multiple
- 0.59×
- Total profit
- $-39,743
- Equity at exit
- $52,186
- IRR
- -0.7%
- Equity multiple
- 0.95×
- Total profit
- $-4,616
- Equity at exit
- $30,262
Cash invested: $98,000 (down + closing). Projections, not guarantees.
Landlord ↔ Tenant lean methodology
- Overall (STATE)
- 27 Tenant-Leaning
- State Maryland
- 27 Tenant-Leaning · D+14
- County
- — inherits STATE
- City
- — inherits STATE
ZIP-level market 21244
- Home prices YoY
- -30.2%
- Rents YoY
- 3.9%
- Active inventory
- 74
- Price-to-rent
- 9.0×
Monthly cashflow live
- Estimated rent
- $3,233 high interval (Pro) →
- Mortgage (P&I)
- −$1,835
- Tax from tax record
- −$351 /mo · $4,211/yr
- Insurance
- −$146
- HOA
- −$0
- Vacancy / Maint / Mgmt
- −$679
- Net cashflow
- $222
Break-even live
UW: 25.0% down · 7.5% · 30yr · 1.5% tax · 5.0% vac · 8.0% maint · 8.0% mgmt
Financing live
Cash to close
- Down payment
- $87,500
- Closing costs
- $10,500
- Reserves months
- —
- Total cash needed
- —
Loan-product check · same deal, 3 products live
Conventional
25% down · 7.5% · 30yr
- Down + closing
- —
- Monthly P&I
- —
- Monthly cashflow
- —
- DSCR
- —
- Eligible?
- —
Personal DTI + credit; lowest rate.
DSCR
20% down · 8.5% · 30yr
- Down + closing
- —
- Monthly P&I
- —
- Monthly cashflow
- —
- DSCR
- —
- Eligible?
- —
No personal income docs; deal must DSCR.
Hard money
10% down · 12.0% · 12mo
- Down + closing
- —
- Monthly P&I
- —
- Monthly cashflow
- —
- DSCR
- —
- Eligible?
- —
Short-term bridge; refi at stabilization.
Rent comps 6 comps
| Address | Beds | Baths | Sqft | Rent | $/sqft | DOM | Units | Dist |
|---|---|---|---|---|---|---|---|---|
| 1827 Hidden Dale Rd Windsor Mill, MD | 3.0–4.0 | 2.5–3.5 | 2399 | $4,519 | $1.88 | 1d | 50 | 0.71mi |
| 7606 River Reach Rd Windsor Mill, MD | 4.0 | 3.5 | 2100 | $3,300 | $1.57 | 16d | 1 | 0.79mi |
| 1807 Smith Island Rd Windsor Mill, MD | 4.0 | 3.5 | 2100 | $3,125 | $1.49 | 14d | 1 | 0.81mi |
| 2117 Cross Trails Rd Windsor Mill, MD | 5.0 | 3.5 | 2688 | $3,900 | $1.45 | 20d | 1 | 0.95mi |
| 2006 Ivory Brook Rd Windsor Mill, MD | 4.0 | 3.5 | 2140 | $3,100 | $1.45 | 43d | 1 | 0.99mi |
| 7438 Catterick Ct Windsor Mill, MD | 4.0 | 2.5 | 2052 | $2,300 | $1.12 | 43d | 1 | 1.10mi |
Listing history 27 events
-
2026-03-17historical $350,000 57-char remark
Show marketing remark (57 chars)
Stay tuned, more details professional photos coming soon!
-
2017-05-02soldstatus $245,900
-
2017-04-21soldstatus $245,900 287-char remark
Show marketing remark (287 chars)
Large family room with fireplace, ample screen porch for summer meals. . Master bedroom with attached bathroom plus one additional bedroom on this level. Upper level features 2 large bedrooms with a Jack and Jill bath, The lower level features a recreation room great place to entertain
-
2017-04-21soldstatus $245,900 Sold
Show marketing remark (287 chars)
Large family room with fireplace, ample screen porch for summer meals. . Master bedroom with attached bathroom plus one additional bedroom on this level. Upper level features 2 large bedrooms with a Jack and Jill bath, The lower level features a recreation room great place to entertain
-
2017-02-23status Contingent (No Kick Out)
Show marketing remark (287 chars)
Large family room with fireplace, ample screen porch for summer meals. . Master bedroom with attached bathroom plus one additional bedroom on this level. Upper level features 2 large bedrooms with a Jack and Jill bath, The lower level features a recreation room great place to entertain
-
2017-02-23historical 287-char remark
Show marketing remark (287 chars)
Large family room with fireplace, ample screen porch for summer meals. . Master bedroom with attached bathroom plus one additional bedroom on this level. Upper level features 2 large bedrooms with a Jack and Jill bath, The lower level features a recreation room great place to entertain
-
2017-02-14status Active
-
2017-01-21status Contract
-
2016-12-30$249,900 Active
-
2016-12-29$249,900 287-char remark
Show marketing remark (287 chars)
Large family room with fireplace, ample screen porch for summer meals. . Master bedroom with attached bathroom plus one additional bedroom on this level. Upper level features 2 large bedrooms with a Jack and Jill bath, The lower level features a recreation room great place to entertain
-
2016-05-21historical Withdrawn
-
2016-05-21historical
-
2016-05-07status Active
-
2016-05-07historical Expired
-
2016-04-01price
-
2016-01-26status Active
-
2015-12-08status Contract
-
2015-10-26price
-
2015-10-15Active
-
2015-10-15$254,900
-
2010-01-12historical Withdrawn
-
2010-01-12historical
-
2009-09-19Active
-
2009-09-19$268,500
-
1992-06-10soldstatus $120,000
-
1992-06-09soldstatus $120,000
-
1979-01-08soldstatus $65,000
ⓘ Source: listings_history table (triggers on properties + properties_extension) + one-shot
backfill from property_details.listing_events for pre-trigger history.
Tax reassessment forecast MD · Partial reset (capped growth)
- Current annual tax
- $4,211 · $351/mo
- Projected year-2 tax
- $4,211 · $351/mo
- Expected delta
- $0/yr ($0/mo · 0.0%)
ⓘ Screening estimate from a state-policy table — verify with the county assessor before closing.
Climate risk First Street
- Flood 1/10 Low FEMA zone X (unshaded) · 0% chance over 30 yrs
- Wildfire 3/10 Moderate
- Heat 6/10 Major 7 d/yr ≥103°F today · 15 d/yr by 30 yrs out
- Wind 4/10 Moderate 17% chance of damaging wind over 30 yrs
- Air quality 3/10 Moderate 2 unhealthy d/yr today · 4 by 30 yrs out
Nearby sold comps map
Loading sold comps map…
Walkable amenities ~0.75 mi
Loading nearby amenities…
Taxation est. · year 1
- Rental income
- $38,801
- − Mortgage interest
- −$19,605
- − Property taxes
- −$4,211
- − Insurance
- −$1,750
- − Repairs & maintenance
- −$3,104
- − Management
- −$3,104
- − Depreciation
- −$10,182
- Taxable loss
- −$3,155
- Est. tax savings @ 24.0%
- +$757
- After-tax cash flow
- $3,424/yr
For passive investors: Depreciation is non-cash, so a rental often shows a tax loss while cash-flowing — sheltering income. Rental losses are passive: they offset passive income freely, and up to $25,000/yr can offset ordinary (W-2) income if you actively participate and your MAGI is under $100k (phasing out to $0 by $150k); unused losses carry forward. On sale, claimed depreciation is recaptured at up to 25%, and gains may owe capital-gains tax (a 1031 exchange can defer both). Figures are a year-1 estimate at your 24.0% rate — not tax advice; consult a CPA.
Schools (NCES district)
- District
- Baltimore County Public Schools
- NCES district ID
- 2400120
- Math proficiency
- 15% ▼ -16.00%
- Reading proficiency
- 34% ▼ -5.00%
- Median HH income
- $66,746
- Composite
- 23.17/100
- National rank
- #7948
- State rank
- #11 of 24 in MD
Livability — Woodlawn
- Score
- 77/100
- State rank
- #78
- US rank
- #2926
Category grades
Schools grade is shown separately in the Schools card above.
Census & demographics
- Census place
- Woodlawn, MD
- County
- Baltimore County · 769,527 people
- City population
- 49,599
- Metro
- Baltimore-Columbia-Towson, MD
- Population (ZIP)
- 38,208
- Household income
- $85,114
- Rent vs Own
- Severe rent burden
- 1434.0
Population outlook (Baltimore County) Hauer SSP2
- Today (2025)
- 885,518 people
- By 2030
- 909,272 · +2.7%
- By 2040
- 951,547 · +7.5%
- By 2050
- 990,955 · +11.9%
- By 2075
- 1,086,411 · +22.7%
- By 2100
- 1,135,078 · +28.2%
Race, ethnicity, and origin ACS 2023
- Neighborhood character
- Predominantly Black (70%)
- Race & ethnicity
- Black 70% Hispanic / Latino 12% White 9% Asian 7% Two or more races 3%
- Hispanic origin (detail)
- Mexican 3% Puerto Rican 2%
- Common ancestry
- Romanian 1%
- Foreign-born
- 17% · Canada
- Languages at home
- 78% English-only · Spanish 9% Other Indo-European 5% French/Haitian/Cajun 2%
Political lean MEDSL · Baltimore
- 2024 margin
- Strong D (+24.5) · D 61.0% · R 36.5% · Other 2.5%
- 2008→2024 swing
- +9.9pp toward D · 2008: 14.6pp · 2024: 24.5pp
- All cycles
- 2024: D+24.5 2020: D+27.0 2016: D+17.4 2012: D+16.4 2008: D+14.6
Not yet ingested
- Civics
- —
Market trends
- HPI YoY
- ▼ -111.97%
- Current HPI
- 258.8502
- Rent YoY
- ▲ 3.86%
- Metro
- Baltimore-Columbia-Towson, MD
- State GDP YoY
- ▲ 2.97%
- F500 in state
- 12
Industry mix (Fortune 500 HQ in MD)
| Industry | F500 HQs | Revenue |
|---|---|---|
| Aerospace / Defense | 1 | $71B |
|
||
| Utilities | 1 | $25B |
|
||
| Hotels | 1 | $24B |
|
||
| Consumer Goods | 1 | $7B |
|
||
| Real Estate | 1 | $6B |
|
||
| Chemicals | 1 | $2B |
|
||
Price history
+438.5% since first listed27 events — show timeline
- 2026-03-17 Coming Soon $350,000 BRIGHT MLS
- 2017-05-02 Sold (Public Records) $245,900 Public Records
- 2017-04-21 Sold (MLS) $245,900 MRIS
- 2017-04-21 Sold (MLS) $245,900 BRIGHT MLS
- 2017-02-23 Pending — MRIS
- 2017-02-23 Listing Removed — BRIGHT MLS
- 2017-02-14 Relisted — MRIS
- 2017-01-21 Pending — MRIS
- 2016-12-30 Listed $249,900 MRIS
- 2016-12-29 Listed $249,900 BRIGHT MLS
- 2016-05-21 Listing Removed — BRIGHT MLS
- 2016-05-21 Delisted — MRIS
- 2016-05-07 Relisted — MRIS
- 2016-05-07 Delisted — MRIS
- 2016-04-01 Price Changed — MRIS
- 2016-01-26 Relisted — MRIS
- 2015-12-08 Pending — MRIS
- 2015-10-26 Price Changed — MRIS
- 2015-10-15 Listed — MRIS
- 2015-10-15 Listed $254,900 BRIGHT MLS
- 2010-01-12 Delisted — MRIS
- 2010-01-12 Listing Removed — BRIGHT MLS
- 2009-09-19 Listed — MRIS
- 2009-09-19 Listed $268,500 BRIGHT MLS
- 1992-06-10 Sold (Public Records) $120,000 Public Records
- 1992-06-09 Sold (Public Records) $120,000 Public Records
- 1979-01-08 Sold (Public Records) $65,000 Public Records
Property tax history
+3.8%/yrLatest (2025): $4,211 · +6.9% YoY. Source: county tax records.
Cash-flow waterfall
monthlySold comps — $/sqft
last 12 mo · ≤1 miLoading sold comps…