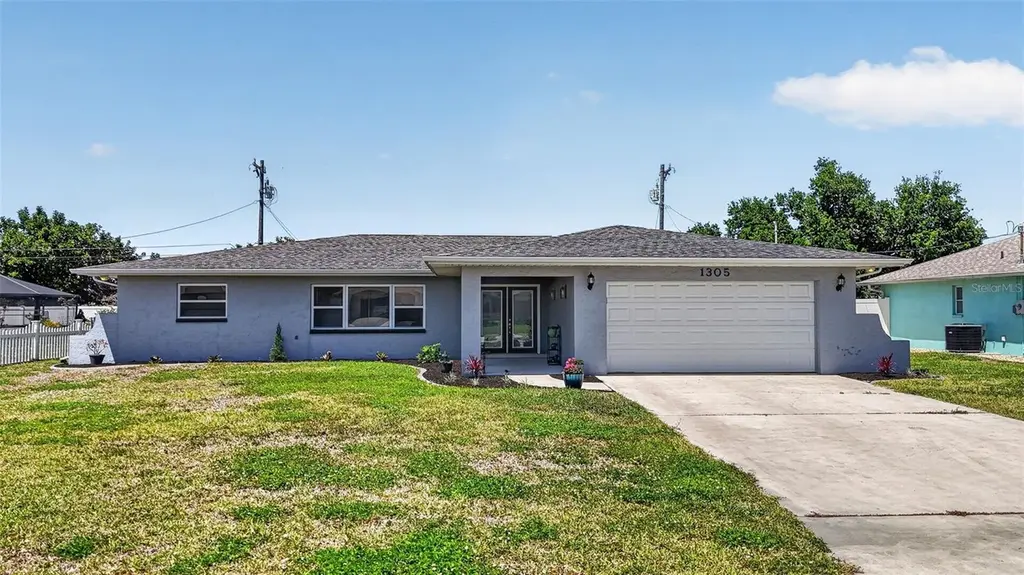
1305 SE 37th Ter · Cape Coral, FL
Flood risk 7/10 · Major
- FEMA flood zone
- X (shaded)
- Chance of flooding over 30 yrs
- 0.74%
- Est. flood insurance / yr
- $507 – $1,088
Fire risk 1/10 · Minimal
- Est. fire insurance / yr
- $947 – $1,759
Heat risk 10/10 · Severe
- Hot days now (above 107°F)
- 7 days/yr
- Hot days in 30 yrs
- 30 days/yr
Wind risk 10/10 · Severe
- Chance of severe wind over 30 yrs
- 99.0%
Air-quality risk 2/10 · Minimal
- Unhealthy air days now
- 1 days/yr
- Unhealthy air days in 30 yrs
- 1 days/yr
Risk factors via First Street. Map © Google.
Why this score? — see what drove the C- grade
The composite is a weighted blend of 9 inputs, each scored 0–100. Each bar is that input's sub-score; the figure is the points it added to the 100-point composite (weight × sub-score).
- Cash flow +16.5/30.0
- ARV discount +15.0/15.0
- DSCR +5.1/10.0
- Schools +4.1/10.0
- Livability +3.9/5.0
- 1% rule +3.8/10.0
- Condition / age +2.5/5.0
- Rent growth +1.1/5.0
- Appreciation +0.0/10.0
$325,000
🖨 Deal sheet (PDF) 📄 Offer letter ✓ Due diligence
Listing remarks MLS
Beautiful 3 Bedroom, 2 Bath Home in the Heart of Cape Coral! Located in desirable Zone X500 – No Flood Insurance Required, No HOA, this well-maintained home offers both peace of mind and everyday comfort. The spacious kitchen features granite countertops, a convenient breakfast bar, and plenty of room to inspire any home chef. Enjoy a thoughtfully designed layout featuring a formal dining room—perfect for bringing out the china and hosting memorable gatherings, a large laundry room, and ceiling fans throughout. The private primary suite offers a generous walk-in closet granite counters and dual sinks for added comfort and convenience. Step outside to your screened-in patio, ideal for relaxing evenings or entertaining guests. The backyard provides plenty of space to design your dream pool, adding exceptional value. Assessments Paid! Dual A/C units for peace of mind(2021) Ideally located near beaches, shopping, dining, hospitals, and local marinas, you’ll enjoy both convenience and the vibrant Southwest Florida lifestyle. Don’t miss your opportunity to own your own piece of paradise—schedule your private showing today!
Key facts
- Formal dining room
- Walk-in closet
- Ceiling fans
Tags
Property features AI
Finance
- Financial info: No lease restrictions indicated
- HOA & community: No HOA association indicated; Community street lights
Exterior
- Parking: Attached garage with 2 spaces
- Utilities: Public water; Public sewer; Electricity connected; Water connected; Sewer connected; Cable available
- Home design: Single family residence; Residential property; One story; South-facing; Homesteaded
- Construction: Block and stucco construction; Shingle roof; Slab foundation; Built on lot approximately 0.23 acres (80 x 125)
- Exterior features: Patio; Screened patio; Landscaped yard; Paved lot
Interior
- Kitchen: Built-in oven; Cooktop; Dishwasher; Microwave; Refrigerator; Freezer
- Bedrooms: 3 bedrooms
- Flooring: Carpet; Tile
- Bathrooms: 2 full bathrooms
- Heating & cooling: Central heating (electric); Central air conditioning
- Interior features: Ceiling fans; Kitchen/family room combo; Split bedroom plan; Tray ceilings; Walk-in closets; Formal separate dining room; Great room
- Laundry & utility: Inside laundry room; Washer hookup; Electric dryer hookup
Neighborhood map
What this means for you Summary
Snapshot
- This is a 3-bed/2.0-bath single-family listed at $325k.
Deal economics
- At list price, monthly cash flow is $121 ($1k/yr) — positive.
- The deal already cash-flows at list — no discount required.
- To meet the 1% rule (rent ≥ 1% of price), the offer needs to be $285k (12.5% below list).
- Recommended offer: $285k (12.5% below list) — sets the bar for 1% rule.
- Cap rate 7.0% vs local median 3.1% in Cape Coral — top-decile yield for the area; either an underpriced asset or a hidden risk that comps aren't pricing in. Stress-test before assuming the spread holds.
Location & tenants
- Location reads 77/100 on livability (#208 in FL, #3,098 nationally) — a middle-class / working-renter tenant base. Strengths: housing A+, health & safety A+, amenities B+; Watch: commute F.
- Lee (suburban): math 47% / reading 50% proficiency, ranked #42 of 73 in FL (top 58%) — families likely to look elsewhere, expect single-tenant / working-renter base with shorter leases.
- Zoned schools: Gulf Elementary School (math 70% / reading 65%, grade B+, #435 of 2,144 statewide, top 21%, 1,231 students, 38% FRL); Challenger Middle School (math 59% / reading 56%, grade B, #157 of 571 statewide, top 28%, 1,124 students, 50% FRL); Ida S. Baker High School (math 44% / reading 47%, grade D-, #223 of 667 statewide, top 34%, 1,933 students, 39% FRL) — zoned schools average 42% FRL vs 57% district-wide (15 pts lower); this property's tenant base skews higher-income than the district average.
- Market conditions: Rents falling (-5.5%/yr); 823 active listings in the ZIP; 40 comparable units currently listed for rent nearby; rentals at typical pace (median 26d on market — plan ~3-4 weeks tenant-placement turnaround); 15,411 units permitted in Lee County in 2024 (4,686 in 5+ unit buildings).
- At $2,845/mo this rent would consume 48% of the median local household income ($71k/yr) (locally 1182% of renters already pay >50% of income on rent) — very limited rent-growth headroom before tenants either downsize or default.
Forward outlook
- Local home prices are declining (-3.0%/yr); year-one equity from $2k of loan paydown is wiped out by about $10k of value loss. Plan a longer hold.
- Lee County population projected at +44% by 2050 — long-run rental-demand tailwind backs the buy-and-hold thesis.
Negotiation context
- It's been on market 55 days — a 3% lower offer ($315k) is reasonable based on typical stale-listing flexibility.
- 2 sale attempts with the ask held roughly flat each time — persistent listings suggest the price (not the market) is what's stuck; bring a comps-based counter.
- Current owner paid $130k; list at $325k implies a 150% gain — meaningful room to come down on a strong offer.
Risks & watch-outs
- Watch-outs: flood insurance adds $66/mo.
- Climate carrying-cost: major flood risk; severe wind risk, 99% chance of damaging wind over 30y; extreme-heat days projected 7→30/yr by 2055 (HVAC capex compounding) — expect insurance premiums to compound above CPI over the hold.
Questions for the listing agent
- It's been on market 55 days. Have you received any prior offers? Is the seller open to a 12% concession, seller financing, or rate buy-down credit?
- Built in 1979 — when were the roof, HVAC, electrical panel, plumbing, and water heater last replaced?
- What's the actual annual flood-insurance premium (NFIP or private), and is the property in a SFHA with mandatory coverage?
- Is there a deadline driving the sale (1031 exchange, divorce, estate, relocation)? That informs how much negotiation room exists.
- Schools are B-rated — typically a magnet for longer-tenancy family renters. What's the average tenant stay here, and is there a school-zone premium baked into asking?
- What's the average days-on-market for RENTAL listings here right now (not sales)? A rising rental-DOM trend means longer vacancies and softer asking-rent achievability than the comps imply.
- What's the recent tenant-quality profile in this submarket — average credit score on applications, eviction rate, late-payment / NSF rate, and stable-employment percentage? A property-management company in the area should have these aggregated.
- How much new for-sale + rental construction is in the pipeline within 1–3 miles? Heavy new supply typically softens prices + rents 12–24 months out; constrained supply supports both.
Investment metrics
- 1% rule
- 0.88% ✗
- Cap rate
- 6.99%
- Cash-on-cash
- 2.47%
- DSCR
- 1.11
- GRM
- 9.5
CMA / ARV
- ARV (on-the-fly)
- $463,050
- Comps found
- 12
Show comp detail 12 sales within ~0.75 mi
| Address | Dist | Beds/Ba | Sqft | Sold | Price | $/sf | Match |
|---|---|---|---|---|---|---|---|
| 3733 SE 12th Pl | 0.22mi | 3/2.0 | 2,119 (+3%) | 1mo | $660,000 | $311 | 84 |
| 1413 SE 38th St | 0.16mi | 3/2.0 | 1,841 (-10%) | 4mo | $515,000 | $280 | 72 |
| 3626 SE 16th Pl | 0.30mi | 3/2.0 | 1,858 (-10%) | 9mo | $637,000 | $343 | 62 |
| 1141 SE 35th Ter | 0.35mi | 4/2.0 (+1) | 2,233 (+8%) | 6mo | $295,000 | $132 | 60 |
| 3517 SE 19th Ave | 0.74mi | 3/2.0 | 1,911 (-7%) | 2mo | $495,000 | $259 | 52 |
| 928 SE 35th St | 0.60mi | 4/2.5 (+1) | 1,896 (-8%) | 0mo | $365,000 | $193 | 52 |
| 3945 SE 9th Ct | 0.68mi | 4/2.0 (+1) | 1,929 (-6%) | 2mo | $365,000 | $189 | 52 |
| 1415 SE 32nd Ter | 0.60mi | 3/2.0 | 1,952 (-5%) | 15mo | $320,000 | $164 | 51 |
| 4413 SE 13th Pl | 0.66mi | 3/2.0 | 1,835 (-11%) | 0mo | $780,000 | $425 | 51 |
| 3337 SE 10th Pl | 0.61mi | 3/2.0 | 1,798 (-13%) | 3mo | $337,000 | $187 | 48 |
| 3903 SE 18th Pl | 0.67mi | 4/3.0 (+1) | 2,182 (+6%) | 12mo | $490,000 | $225 | 40 |
| 3608 SE 8th Pl | 0.75mi | 4/2.0 (+1) | 2,191 (+6%) | 12mo | $405,000 | $185 | 40 |
Match score weights: distance 35% · size 25% · config 20% · recency 20%. Top-matched comps best support the ARV.
Projected returns pro-forma
-3.0% appreciation · 0.0% rent growth · sell at horizon
- IRR
- -17.0%
- Equity multiple
- 0.41×
- Total profit
- $-53,327
- Equity at exit
- $48,459
- IRR
- -15.4%
- Equity multiple
- 0.24×
- Total profit
- $-68,862
- Equity at exit
- $28,100
Cash invested: $91,000 (down + closing). Projections, not guarantees.
Landlord ↔ Tenant lean methodology
- Overall (STATE)
- 87 Strongly Landlord-Friendly
- State Florida
- 87 Strongly Landlord-Friendly · R+3
- County
- — inherits STATE
- City
- — inherits STATE
ZIP-level market 33904
- Rents YoY
- -5.5%
- Active inventory
- 823
- Price-to-rent
- 9.5×
Monthly cashflow live
- Estimated rent
- $2,845 high interval (Pro) →
- Mortgage (P&I)
- −$1,704
- Tax from tax record
- −$221 /mo · $2,647/yr
- Insurance
- −$135
- Flood insurance flood zone
- −$66 /mo · $798/yr
- HOA
- −$0
- Vacancy / Maint / Mgmt
- −$598
- Net cashflow
- $121
Break-even live
Sensitivity live
| Price | -10% $305 | -5% $213 | +0% $121 | +5% $29 | +10% $-63 |
|---|---|---|---|---|---|
| Rent | -10% $-104 | -5% $9 | +0% $121 | +5% $233 | +10% $346 |
| Rate | -1.0pp $285 | -0.5pp $204 | base $121 | +0.5pp $37 | +1.0pp $-49 |
UW: 25.0% down · 7.5% · 30yr · 1.5% tax · 5.0% vac · 8.0% maint · 8.0% mgmt
Financing live
Cash to close
- Down payment
- $81,250
- Closing costs
- $9,750
- Reserves months
- —
- Total cash needed
- —
Loan-product check · same deal, 3 products live
Conventional
25% down · 7.5% · 30yr
- Down + closing
- —
- Monthly P&I
- —
- Monthly cashflow
- —
- DSCR
- —
- Eligible?
- —
Personal DTI + credit; lowest rate.
DSCR
20% down · 8.5% · 30yr
- Down + closing
- —
- Monthly P&I
- —
- Monthly cashflow
- —
- DSCR
- —
- Eligible?
- —
No personal income docs; deal must DSCR.
Hard money
10% down · 12.0% · 12mo
- Down + closing
- —
- Monthly P&I
- —
- Monthly cashflow
- —
- DSCR
- —
- Eligible?
- —
Short-term bridge; refi at stabilization.
Rent comps 40 comps
| Address | Beds | Baths | Sqft | Rent | $/sqft | DOM | Units | Dist |
|---|---|---|---|---|---|---|---|---|
| 1322 SE 35th Ter Cape Coral, FL | 4.0 | 2.0 | 1803 | $2,850 | $1.58 | 25d | 1 | 0.25mi |
| 3830 SE 12th Ave Cape Coral, FL | 4.0 | 4.0 | 2136 | $5,500 | $2.57 | 25d | 1 | 0.31mi |
| 3923 SE 12th Ave Cape Coral, FL | 3.0 | 2.0 | 1684 | $2,000 | $1.19 | 25d | 1 | 0.35mi |
| 1426 SE 34th Ter Cape Coral, FL | 3.0 | 2.0 | 1740 | $7,103 | $4.08 | 25d | 1 | 0.37mi |
| 3722 SE 12th Ave Unit 1F Cape Coral, FL | 2.0 | 2.0 | 1410 | $2,150 | $1.52 | 25d | 1 | 0.39mi |
| 1402 SE 34th St Cape Coral, FL | 3.0 | 2.0 | 1613 | $1,899 | $1.18 | 13d | 1 | 0.42mi |
| 1704 Savona Pkwy Cape Coral, FL | 3.0 | 2.0 | 2257 | $5,720 | $2.53 | 25d | 1 | 0.43mi |
| 1125 SE 35th St Cape Coral, FL | 4.0 | 2.0 | 2023 | $2,400 | $1.19 | 17d | 1 | 0.44mi |
| 1502 SE 33rd St Cape Coral, FL | 3.0 | 2.0 | 1430 | $2,100 | $1.47 | 5d | 1 | 0.55mi |
| 3402 SE 11th Ave Cape Coral, FL | 3.0 | 2.0 | 1882 | $7,099 | $3.77 | 25d | 1 | 0.55mi |
| 3425 SE 10th Ave Cape Coral, FL | 3.0 | 2.0 | 1706 | $2,500 | $1.47 | 25d | 1 | 0.59mi |
| 1811 SE 37th Ter Cape Coral, FL | 3.0 | 3.0 | 2657 | $8,380 | $3.15 | 25d | 1 | 0.66mi |
| 1410 SE 31st Ter Cape Coral, FL | 3.0 | 2.0 | 1792 | $5,600 | $3.12 | 25d | 1 | 0.74mi |
| 3418 SE 19th Ave Cape Coral, FL | 3.0 | 2.0 | 1880 | $3,500 | $1.86 | 25d | 1 | 0.75mi |
| 3510 SE 19th Pl Cape Coral, FL | 3.0 | 3.0 | 2318 | $4,000 | $1.73 | 16d | 1 | 0.80mi |
| 1426 SE 43rd Ter Cape Coral, FL | 3.0 | 3.0 | 1872 | $2,950 | $1.58 | 25d | 1 | 0.81mi |
| 3116 SE 11th Ave Cape Coral, FL | 3.0 | 2.0 | 1878 | $2,500 | $1.33 | 3d | 1 | 0.85mi |
| 4001 SE 19th Pl Unit B-1 Cape Coral, FL | 3.0 | 2.0 | 1525 | $3,200 | $2.10 | 25d | 1 | 0.87mi |
| 711 SE 33rd Ter Cape Coral, FL | 3.0 | 2.0 | 2063 | $3,500 | $1.70 | 25d | 1 | 0.92mi |
| 1115 SE 30th Ter Cape Coral, FL | 4.0 | 3.0 | 3000 | $2,950 | $0.98 | 25d | 1 | 0.93mi |
| 3105 SE 18th Ave Cape Coral, FL | 3.0 | 2.0 | 1978 | $2,995 | $1.51 | 5d | 1 | 0.96mi |
| 712 SE 32nd Ter Cape Coral, FL | 4.0 | 2.0 | 1993 | $2,950 | $1.48 | 15d | 1 | 0.97mi |
| 3766 SE 6th Ave Cape Coral, FL | 3.0 | 2.0 | 2048 | $2,500 | $1.22 | 25d | 1 | 0.99mi |
| 1128 SE 29th Ter Cape Coral, FL | 3.0 | 2.0 | 1534 | $2,250 | $1.47 | 25d | 1 | 1.00mi |
| 1038 SE 30th St Cape Coral, FL | 3.0 | 2.0 | 1754 | $2,400 | $1.37 | 23d | 1 | 1.01mi |
| 534 SE 34th Ter Cape Coral, FL | 3.0 | 2.0 | 1905 | $2,500 | $1.31 | 25d | 1 | 1.06mi |
| 3010 SE 19th Ave Cape Coral, FL | 3.0 | 2.0 | 2435 | $2,800 | $1.15 | 25d | 1 | 1.09mi |
| 1124 SE 29th St Cape Coral, FL | 3.0 | 2.0 | 1578 | $1,500 | $0.95 | 25d | 1 | 1.09mi |
| 4535 SE 14th Pl Cape Coral, FL | 3.0 | 2.0 | 1613 | $3,800 | $2.36 | 25d | 1 | 1.10mi |
| 1608 SE 28th Ter Unit A28 Cape Coral, FL | 2.0 | 2.5 | 1444 | $1,400 | $0.97 | 25d | 1 | 1.16mi |
| 4235 SE 20th Pl Unit C404 Cape Coral, FL | 3.0 | 3.0 | 1725 | $3,800 | $2.20 | 25d | 1 | 1.20mi |
| 1235 Shelby Pkwy Cape Coral, FL | 3.0 | 2.0 | 1479 | $2,200 | $1.49 | 5d | 1 | 1.23mi |
| 3142 SE 22nd Pl Cape Coral, FL | 4.0 | 2.0 | 2170 | $3,500 | $1.61 | 25d | 1 | 1.26mi |
| 3425 SE 4th Ave Cape Coral, FL | 4.0 | 3.0 | 2096 | $9,000 | $4.29 | 25d | 1 | 1.29mi |
| 3527 SE 3rd Ave Cape Coral, FL | 3.0 | 2.0 | 1758 | $2,115 | $1.20 | 25d | 1 | 1.37mi |
| 620 SE 29th St Cape Coral, FL | 3.0 | 2.0 | 1925 | $2,006 | $1.04 | 5d | 1 | 1.37mi |
| 4202 Palm Tree Blvd Cape Coral, FL | 3.0 | 2.0 | 1786 | $2,000 | $1.12 | 25d | 1 | 1.43mi |
| 327 SE 31st Ter Cape Coral, FL | 3.0 | 2.0 | 1408 | $1,725 | $1.23 | 5d | 1 | 1.47mi |
| 618 W Archer Pkwy Cape Coral, FL | 3.0 | 2.0 | 1554 | $5,135 | $3.30 | 25d | 1 | 1.48mi |
| 1320 SE 25th Ln Cape Coral, FL | 3.0 | 2.0 | 1752 | $2,700 | $1.54 | 5d | 1 | 1.48mi |
Listing history 26 events
-
2026-06-22days on market $325,000 Active 55 DOM
-
2026-06-17days on market $325,000 Active 51 DOM
-
2026-06-16days on market $325,000 Active 50 DOM
-
2026-06-15days on market $325,000 Active 49 DOM
-
2026-06-13days on market $325,000 Active 47 DOM
-
2026-06-10days on market $325,000 Active 44 DOM
-
2026-06-09days on market $325,000 Active 43 DOM
-
2026-06-08days on market $325,000 Active 42 DOM
-
2026-06-07days on market $325,000 Active 41 DOM
-
2026-06-03days on market $325,000 Active 37 DOM
-
2026-06-02days on market $325,000 Active 36 DOM
-
2026-06-01days on market $325,000 Active 35 DOM
-
2026-05-31days on market $325,000 Active 34 DOM
-
2026-04-27$325,000 Active
-
2026-04-18$325,000 Active 1167-char remark
Show marketing remark (1167 chars)
Beautiful 3 Bedroom, 2 Bath Home in the Heart of Cape Coral! Located in desirable Zone X500 – No Flood Insurance Required, No HOA, this well-maintained home offers both peace of mind and everyday comfort. The spacious kitchen features granite countertops, a convenient breakfast bar, and plenty of room to inspire any home chef. Enjoy a thoughtfully designed layout featuring a formal dining room—perfect for bringing out the china and hosting memorable gatherings, a large laundry room, and ceiling fans throughout. The private primary suite offers a generous walk-in closet granite counters and dual sinks for added comfort and convenience. Step outside to your screened-in patio, ideal for relaxing evenings or entertaining guests. The backyard provides plenty of space to design your dream pool, adding exceptional value. Assessments Paid! Dual A/C units for peace of mind(2021) Ideally located near beaches, shopping, dining, hospitals, and local marinas, you’ll enjoy both convenience and the vibrant Southwest Florida lifestyle. Don’t miss your opportunity to own your own piece of paradise—schedule your private showing today!
-
2012-02-03soldstatus $130,000
-
2012-01-30soldstatus $130,000 350-char remark
Show marketing remark (350 chars)
Very large home in a great neighborhood! This home has tile throughout the main portions and carpet in the bedrooms. It has dual zone A/C and energy effecient dual pane windows. Kitchen and bathrooms have granite counter tops with modern tile in the tub and shower areas. And you should see the size of the laundry room! All assessments paid and in!
-
2012-01-10price $145,900 350-char remark
Show marketing remark (350 chars)
Very large home in a great neighborhood! This home has tile throughout the main portions and carpet in the bedrooms. It has dual zone A/C and energy effecient dual pane windows. Kitchen and bathrooms have granite counter tops with modern tile in the tub and shower areas. And you should see the size of the laundry room! All assessments paid and in!
-
2011-03-18soldstatus $85,500
-
2011-03-02price $89,900
-
2007-10-02soldstatus $183,000
-
2007-09-28soldstatus $183,000
-
2007-09-12price $184,900
-
2003-08-28soldstatus $140,000
-
2003-08-19soldstatus $140,000
-
2003-07-07price $144,900
ⓘ Source: listings_history table (triggers on properties + properties_extension) + one-shot
backfill from property_details.listing_events for pre-trigger history.
Tax reassessment forecast FL · Resets to sale price
- Current annual tax
- $2,647 · $221/mo
- Projected year-2 tax
- $2,698 · $225/mo
- Expected delta
- +$50/yr (+$4/mo · 1.9%)
ⓘ Screening estimate from a state-policy table — verify with the county assessor before closing.
Climate risk First Street
- Flood 7/10 Severe FEMA zone X (shaded) · 74% chance over 30 yrs
- Wildfire 1/10 Low
- Heat 10/10 Extreme 7 d/yr ≥107°F today · 30 d/yr by 30 yrs out
- Wind 10/10 Extreme 99% chance of damaging wind over 30 yrs
- Air quality 2/10 Low 1 unhealthy d/yr today · 1 by 30 yrs out
Nearby sold comps map
Loading sold comps map…
Walkable amenities ~0.75 mi
Loading nearby amenities…
Taxation est. · year 1
- Rental income
- $34,144
- − Mortgage interest
- −$18,205
- − Property taxes
- −$2,647
- − Insurance
- −$2,422
- − Repairs & maintenance
- −$2,731
- − Management
- −$2,731
- − Depreciation
- −$9,455
- Taxable loss
- −$4,049
- Est. tax savings @ 24.0%
- +$972
- After-tax cash flow
- $2,423/yr
For passive investors: Depreciation is non-cash, so a rental often shows a tax loss while cash-flowing — sheltering income. Rental losses are passive: they offset passive income freely, and up to $25,000/yr can offset ordinary (W-2) income if you actively participate and your MAGI is under $100k (phasing out to $0 by $150k); unused losses carry forward. On sale, claimed depreciation is recaptured at up to 25%, and gains may owe capital-gains tax (a 1031 exchange can defer both). Figures are a year-1 estimate at your 24.0% rate — not tax advice; consult a CPA.
Schools (NCES district)
- District
- Lee
- NCES district ID
- 1201080
- Math proficiency
- 47% ▼ -11.00%
- Reading proficiency
- 50% ▼ -4.00%
- Median HH income
- $49,518
- Composite
- 41.49/100
- National rank
- #3458
- State rank
- #42 of 73 in FL
Livability — Cape Coral
- Score
- 77/100
- State rank
- #208
- US rank
- #3098
Category grades
Schools grade is shown separately in the Schools card above.
Census & demographics
- Census place
- Cape Coral, FL
- County
- Lee County · 788,662 people
- City population
- 217,388
- Metro
- Cape Coral-Fort Myers, FL
- Population (ZIP)
- 33,599
- Household income
- $71,190
- Rent vs Own
- Severe rent burden
- 1182.0
Population outlook (Lee County) Hauer SSP2
- Today (2025)
- 871,946 people
- By 2030
- 955,468 · +9.6%
- By 2040
- 1,113,587 · +27.7%
- By 2050
- 1,256,891 · +44.1%
- By 2075
- 1,560,270 · +78.9%
- By 2100
- 1,726,848 · +98.0%
Race, ethnicity, and origin ACS 2023
- Neighborhood character
- Predominantly White (76%)
- Race & ethnicity
- White 76% Hispanic / Latino 16% Two or more races 11% Black 3% Asian 2%
- Hispanic origin (detail)
- Mexican 2% Puerto Rican 2% Cuban 9%
- Common ancestry
- Romanian 4% Lithuanian 2% Slovak 2%
- Foreign-born
- 14% · Canada, China, Jamaica
- Languages at home
- 82% English-only · Spanish 13% Other Indo-European 1% Chinese 1%
Political lean MEDSL · Lee
- 2024 margin
- Strong R (+28.4) · D 35.5% · R 63.9%
- 2008→2024 swing
- -18.0pp toward R · 2008: -10.4pp · 2024: -28.4pp
- All cycles
- 2024: R+28.4 2020: R+19.2 2016: R+20.4 2012: R+16.6 2008: R+10.4
Not yet ingested
- Civics
- —
Market trends
- HPI YoY
- ▼ -190.05%
- Current HPI
- 266.3458
- Rent YoY
- ▼ -5.48%
- Metro
- Cape Coral-Fort Myers, FL
- State GDP YoY
- ▲ 3.28%
- F500 in state
- 36
Industry mix (Fortune 500 HQ in FL)
| Industry | F500 HQs | Revenue |
|---|---|---|
| Industrial Technology | 2 | $29B |
|
||
| Insurance | 2 | $17B |
|
||
| Retail | 1 | $60B |
|
||
| Technology Distribution | 1 | $58B |
|
||
| Homebuilding | 1 | $35B |
|
||
| Technology Manufacturing | 1 | $35B |
|
||
Price history
+124.3% since first listed13 events — show timeline
- 2026-04-27 Listed $325,000 Stellar MLS as Distributed by MLS Grid
- 2026-04-18 Listed $325,000 FORTMLS
- 2012-02-03 Sold (Public Records) $130,000 Public Records
- 2012-01-30 Sold (MLS) $130,000 FORTMLS
- 2012-01-10 Price Changed $145,900 FORTMLS
- 2011-03-18 Sold (MLS) $85,500 FORTMLS
- 2011-03-02 Price Changed $89,900 FORTMLS
- 2007-10-02 Sold (Public Records) $183,000 Public Records
- 2007-09-28 Sold (MLS) $183,000 FORTMLS
- 2007-09-12 Price Changed $184,900 FORTMLS
- 2003-08-28 Sold (Public Records) $140,000 Public Records
- 2003-08-19 Sold (MLS) $140,000 FORTMLS
- 2003-07-07 Price Changed $144,900 FORTMLS
Property tax history
+0.0%/yrLatest (2025): $2,647 · +7.0% YoY. Source: county tax records.
Cash-flow waterfall
monthlySold comps — $/sqft
last 12 mo · ≤1 miLoading sold comps…