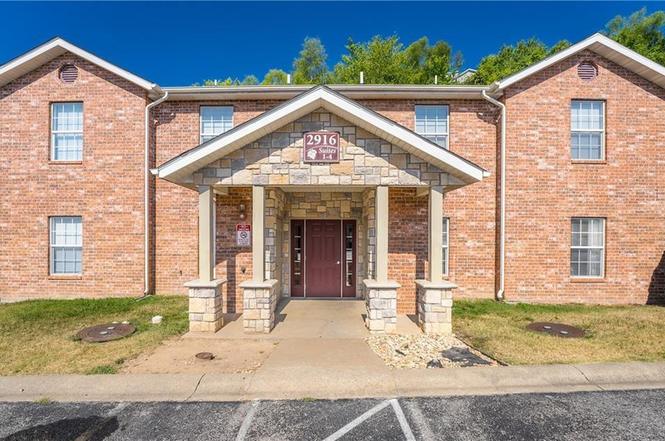
2916 Vinyards Pkwy #3 · Branson, MO
Flood risk 6/10 · Moderate
- FEMA flood zone
- X (unshaded)
- Chance of flooding over 30 yrs
- 0.27%
- Est. flood insurance / yr
- $473 – $860
Fire risk 3/10 · Minor
- Est. fire insurance / yr
- $1,054 – $1,958
Heat risk 4/10 · Minor
- Hot days now (above 106°F)
- 7 days/yr
- Hot days in 30 yrs
- 20 days/yr
Wind risk 2/10 · Minimal
- Chance of severe wind over 30 yrs
- 1.0%
Air-quality risk 2/10 · Minimal
- Unhealthy air days now
- 0 days/yr
- Unhealthy air days in 30 yrs
- 1 days/yr
Risk factors via First Street. Map © Google.
Why this score? — see what drove the D grade
The composite is a weighted blend of 9 inputs, each scored 0–100. Each bar is that input's sub-score; the figure is the points it added to the 100-point composite (weight × sub-score).
- Cash flow +12.5/30.0
- ARV discount +7.5/15.0
- 1% rule +4.6/10.0
- Schools +4.2/10.0
- Livability +3.9/5.0
- DSCR +3.7/10.0
- Rent growth +3.2/5.0
- Condition / age +2.5/5.0
- Appreciation +0.0/10.0
$190,000
🖨 Deal sheet (PDF) 📄 Offer letter ✓ Due diligence
Listing remarks
Here is your chance to own a stylish dream vacation home! Fully furnished and ready for new owners, this condo is located in a secluded area close to the strip and Silver Dollar City. Recently renovated in 2021, this property is perfect for a vacation getaway or primary residence. The pool and rocky terrain create a peaceful oasis for the new owners to enjoy! Come check it out today before it is too late! Listing agent is part owner.
Key facts
- Secluded area
- Peaceful oasis
- Recently renovated
Tags
Property features AI
Finance
- Other: Living area approximately 1,147 (above-grade, per builder)
- HOA & community: HOA (Vinyards Pkwy) with monthly fee of $265; HOA maintains building exterior, lawn, roof repair, snow removal, and street
Exterior
- Parking: Shared driveway
- Utilities: Public water; Public sewer
- Home design: Attached condominium; Residential property
- Construction: Frame construction; Composition roof; Built approximately 11–15 years ago
- Exterior features: Not in a flood plain; Shared driveway; Lawn maintenance provided by association; Snow removal and street maintenance provided by association
Interior
- Bedrooms: 3 bedrooms
- Bathrooms: 2 full bathrooms
- Heating & cooling: Electric heating; Electric cooling (has cooling)
- Interior features: Basement with other/unspecified features; Open floor plan noted as 'Other' by builder
Neighborhood map
What this means for you Summary
Snapshot
- This is a 3-bed/2.0-bath condo listed at $190k.
Deal economics
- At list price, monthly cash flow is $-27 ($-323/yr) — negative.
- To cash-flow at today's rent, offer at most $185k (2.5% below list).
- To meet the 1% rule (rent ≥ 1% of price), the offer needs to be $183k (3.6% below list).
- Recommended offer: $183k (3.6% below list) — sets the bar for 1% rule.
- Cap rate 6.1% vs local median 2.6% in Branson — top-decile yield for the area; either an underpriced asset or a hidden risk that comps aren't pricing in. Stress-test before assuming the spread holds.
Location & tenants
- Location reads 77/100 on livability (#32 in MO, #2,940 nationally) — a middle-class / working-renter tenant base. Strengths: commute A+, cost of living A+, health & safety A+; Watch: employment C-, crime F.
- Branson R-IV (rural): math 48% / reading 52% proficiency, ranked #44 of 324 in MO (top 14%) — acceptable for families but not a draw, mixed tenant base, ~2y average lease.
- Zoned schools: Cedar Ridge Elementary (math 52% / reading 47%, grade D, #284 of 1,115 statewide, top 30%, 503 students, 65% FRL); Branson Jr. High (math 48% / reading 49%, grade C-, #81 of 391 statewide, top 21%, 724 students, 51% FRL); Branson High (math 42% / reading 56%, grade D, #145 of 521 statewide, top 28%, 1,423 students, 46% FRL).
- Market conditions: Rents rising (+2.9%/yr); 1061 active listings in the ZIP; 5 comparable units currently listed for rent nearby; rentals lingering (median 46d on market — plan ~5-8 weeks vacancy on turnover, expect pricing pressure); 100% of comp listings sitting > 30 days — soft ceiling on asking rent; 331 units permitted in Taney County in 2024 (50 in 5+ unit buildings).
- This rent runs 36% of the median local income ($60k/yr) — at the standard rent-burdened threshold; future hikes will face affordability resistance.
Forward outlook
- Local home prices are declining (-3.0%/yr); year-one equity from $1k of loan paydown is wiped out by about $6k of value loss. Plan a longer hold.
- Taney County population projected at +17% by 2050 — long-run rental-demand tailwind backs the buy-and-hold thesis.
Negotiation context
- Only 8 days on market — expect competitive offers; lowballing is unlikely to land.
- 5 sale attempts since 7y ago with the ask held roughly flat each time — persistent listings suggest the price (not the market) is what's stuck; bring a comps-based counter.
Risks & watch-outs
- Climate carrying-cost: major flood risk — expect insurance premiums to compound above CPI over the hold.
Questions for the listing agent
- What do current leases actually rent for vs. the listed asking? Can we see a recent rent roll and the last 12 months of T-12 income?
- What does the HOA fee cover, when was the last increase, and are there any pending special assessments or reserve-fund shortfalls?
- Any open or pending special assessments — roof, HVAC, plumbing, elevator, façade? What's the per-unit balance and payoff schedule, and is the seller paying it off at close or rolling it to the buyer?
- Is there a deadline driving the sale (1031 exchange, divorce, estate, relocation)? That informs how much negotiation room exists.
- Crime grade is F in this area — have there been break-ins, vandalism, or insurance claims at this property in the last 3 years? What carrier currently insures it and at what premium?
- The area grade is low — what's the realistic commute time and amenity access for the typical tenant pool here? Any planned neighborhood developments (good or bad) we should know about?
- What's the average days-on-market for RENTAL listings here right now (not sales)? A rising rental-DOM trend means longer vacancies and softer asking-rent achievability than the comps imply.
- What's the recent tenant-quality profile in this submarket — average credit score on applications, eviction rate, late-payment / NSF rate, and stable-employment percentage? A property-management company in the area should have these aggregated.
- How much new apartment / multifamily construction is in the pipeline within 1–3 miles? Heavy new supply (>2% of stock underway) typically softens rents 12–24 months out; light construction supports rent growth.
Investment metrics
- 1% rule
- 0.96% ✗
- Cap rate
- 6.12%
- Cash-on-cash
- -0.61%
- DSCR
- 0.97
- GRM
- 8.6
CMA / ARV
No comps found within radius.
Projected returns pro-forma
-3.0% appreciation · 2.9% rent growth · sell at horizon
- IRR
- -17.3%
- Equity multiple
- 0.39×
- Total profit
- $-32,558
- Equity at exit
- $28,330
- IRR
- -9.4%
- Equity multiple
- 0.42×
- Total profit
- $-30,796
- Equity at exit
- $16,428
Cash invested: $53,200 (down + closing). Projections, not guarantees.
Landlord ↔ Tenant lean methodology
- Overall (STATE)
- 81 Strongly Landlord-Friendly
- State Missouri
- 81 Strongly Landlord-Friendly · R+10
- County
- — inherits STATE
- City
- — inherits STATE
ZIP-level market 65616
- Home prices YoY
- -24.3%
- Rents YoY
- 2.9%
- Active inventory
- 1061
- Price-to-rent
- 8.6×
Monthly cashflow live
- Estimated rent
- $1,831 high interval (Pro) →
- Mortgage (P&I)
- −$996
- Tax from tax record
- −$133 /mo · $1,595/yr
- Insurance
- −$79
- HOA
- −$265
- Vacancy / Maint / Mgmt
- −$385
- Net cashflow
- $-27
Break-even live
Sensitivity live
| Price | -10% $81 | -5% $27 | +0% $-27 | +5% $-81 | +10% $-134 |
|---|---|---|---|---|---|
| Rent | -10% $-172 | -5% $-99 | +0% $-27 | +5% $45 | +10% $118 |
| Rate | -1.0pp $69 | -0.5pp $21 | base $-27 | +0.5pp $-76 | +1.0pp $-126 |
UW: 25.0% down · 7.5% · 30yr · 1.5% tax · 5.0% vac · 8.0% maint · 8.0% mgmt
Financing live
Cash to close
- Down payment
- $47,500
- Closing costs
- $5,700
- Reserves months
- —
- Total cash needed
- —
Loan-product check · same deal, 3 products live
Conventional
25% down · 7.5% · 30yr
- Down + closing
- —
- Monthly P&I
- —
- Monthly cashflow
- —
- DSCR
- —
- Eligible?
- —
Personal DTI + credit; lowest rate.
DSCR
20% down · 8.5% · 30yr
- Down + closing
- —
- Monthly P&I
- —
- Monthly cashflow
- —
- DSCR
- —
- Eligible?
- —
No personal income docs; deal must DSCR.
Hard money
10% down · 12.0% · 12mo
- Down + closing
- —
- Monthly P&I
- —
- Monthly cashflow
- —
- DSCR
- —
- Eligible?
- —
Short-term bridge; refi at stabilization.
Rent comps 5 comps
| Address | Beds | Baths | Sqft | Rent | $/sqft | DOM | Units | Dist |
|---|---|---|---|---|---|---|---|---|
| 2907 Vineyards Pkwy #2 Branson, MO | 3.0 | 2.0 | 1147 | $1,850 | $1.61 | 45d | 1 | 0.12mi |
| 2905 Vineyards Pkwy #5 Branson, MO | 3.0 | 2.0 | 1147 | $1,850 | $1.61 | 45d | 1 | 0.12mi |
| 3515 Arlene St Branson, MO | 2.0 | 2.0 | 880 | $1,025 | $1.16 | 45d | 1 | 0.64mi |
| 513 Lakewood Rd Branson, MO | 3.0 | 3.0 | 1487 | $1,750 | $1.18 | 45d | 1 | 1.19mi |
| 325 Majestic Dr Branson, MO | 1.0–3.0 | 1.0–2.0 | 941 | $1,650 | $1.75 | 45d | 2 | 1.22mi |
HOA detail condo
- Monthly dues
- $265 · $3,180/yr
- Likely covers
- pool
- Assessments
- None detected in remarks — confirm with the listing agent.
Listing history 8 events
-
2026-06-22days on market $190,000 Active 8 DOM
-
2026-06-21days on market $190,000 Active 7 DOM
-
2026-06-19days on market $190,000 Active 5 DOM
-
2026-06-18days on market $190,000 Active 4 DOM
-
2026-06-17days on market $190,000 Active 3 DOM
-
2026-06-16days on market $190,000 Active 2 DOM
-
2026-06-15remarks 437-char remark
-
2026-06-15$190,000 Active 1 DOM
ⓘ Source: listings_history table (triggers on properties + properties_extension) + one-shot
backfill from property_details.listing_events for pre-trigger history.
Tax reassessment forecast MO · Resets to sale price
- Current annual tax
- $1,595 · $133/mo
- Projected year-2 tax
- $1,843 · $154/mo
- Expected delta
- +$248/yr (+$21/mo · 15.5%)
ⓘ Screening estimate from a state-policy table — verify with the county assessor before closing.
Climate risk First Street
- Flood 6/10 Major FEMA zone X (unshaded) · 27% chance over 30 yrs
- Wildfire 3/10 Moderate
- Heat 4/10 Moderate 7 d/yr ≥106°F today · 20 d/yr by 30 yrs out
- Wind 2/10 Low 100% chance of damaging wind over 30 yrs
- Air quality 2/10 Low 0 unhealthy d/yr today · 1 by 30 yrs out
Nearby sold comps map
Loading sold comps map…
Walkable amenities ~0.75 mi
Loading nearby amenities…
Taxation est. · year 1
- Rental income
- $21,974
- − Mortgage interest
- −$10,643
- − Property taxes
- −$1,595
- − Insurance
- −$950
- − Repairs & maintenance
- −$1,758
- − Management
- −$1,758
- − HOA
- −$3,180
- − Depreciation
- −$5,527
- Taxable loss
- −$3,437
- Est. tax savings @ 24.0%
- +$825
- After-tax cash flow
- $502/yr
For passive investors: Depreciation is non-cash, so a rental often shows a tax loss while cash-flowing — sheltering income. Rental losses are passive: they offset passive income freely, and up to $25,000/yr can offset ordinary (W-2) income if you actively participate and your MAGI is under $100k (phasing out to $0 by $150k); unused losses carry forward. On sale, claimed depreciation is recaptured at up to 25%, and gains may owe capital-gains tax (a 1031 exchange can defer both). Figures are a year-1 estimate at your 24.0% rate — not tax advice; consult a CPA.
Schools (NCES district)
- District
- Branson R-IV
- NCES district ID
- 2905760
- Math proficiency
- 48% ▼ -6.00%
- Reading proficiency
- 52% ▼ -3.00%
- Median HH income
- $41,473
- Composite
- 41.96/100
- National rank
- #3347
- State rank
- #44 of 324 in MO
Livability — Branson
- Score
- 77/100
- State rank
- #32
- US rank
- #2940
Category grades
Schools grade is shown separately in the Schools card above.
Census & demographics
- Census place
- Branson, MO
- County
- Taney County · 28,460 people
- City population
- 28,460
- Metro
- Branson, MO
- Population (ZIP)
- 28,460
- Household income
- $60,489
- Rent vs Own
- Severe rent burden
- 1065.0
Population outlook (Taney County) Hauer SSP2
- Today (2025)
- 59,017 people
- By 2030
- 61,235 · +3.8%
- By 2040
- 65,225 · +10.5%
- By 2050
- 68,842 · +16.6%
- By 2075
- 77,705 · +31.7%
- By 2100
- 82,002 · +38.9%
Race, ethnicity, and origin ACS 2023
- Neighborhood character
- Predominantly White (82%)
- Race & ethnicity
- White 82% Two or more races 10% Hispanic / Latino 10% Black 2% Asian 2%
- Hispanic origin (detail)
- Mexican 6% Puerto Rican 2%
- Common ancestry
- Italian 4% Lithuanian 3% Slovak 2%
- Foreign-born
- 5% · Canada
- Languages at home
- 89% English-only · Spanish 7% Other Indo-European 1% Russian/Polish/Slavic 1%
Political lean MEDSL · Taney
- 2024 margin
- Solid R (+59.3) · D 19.9% · R 79.2%
- 2008→2024 swing
- -22.2pp toward R · 2008: -37.2pp · 2024: -59.3pp
- All cycles
- 2024: R+59.3 2020: R+57.7 2016: R+59.3 2012: R+47.4 2008: R+37.2
Not yet ingested
- Civics
- —
Market trends
- HPI YoY
- ▼ -64.45%
- Current HPI
- 200.8392
- Rent YoY
- ▲ 2.90%
- Metro
- Branson, MO
- State GDP YoY
- ▲ 1.84%
- F500 in state
- 20
Industry mix (Fortune 500 HQ in MO)
| Industry | F500 HQs | Revenue |
|---|---|---|
| Healthcare | 1 | $163B |
|
||
| Insurance | 1 | $21B |
|
||
| Industrial Technology | 1 | $17B |
|
||
| Retail | 1 | $16B |
|
||
| Industrial Distribution | 1 | $10B |
|
||
| Utilities | 1 | $9B |
|
||
Price history
+121.2% since first listed16 events — show timeline
- 2026-06-14 Listed $190,000 Heartland MLS as Distributed by MLS Grid
- 2024-10-21 Price Changed $195,000 SOMO
- 2024-06-05 Price Changed $210,000 SOMO
- 2024-04-03 Price Changed $220,000 SOMO
- 2024-02-27 Price Changed $230,000 SOMO
- 2024-02-16 Price Changed $240,000 SOMO
- 2024-02-09 Listed $250,000 SOMO
- 2024-01-13 Listing Removed — Heartland MLS as Distributed by MLS Grid
- 2023-08-08 Price Changed $229,900 Heartland MLS as Distributed by MLS Grid
- 2023-07-18 Price Changed $239,900 Heartland MLS as Distributed by MLS Grid
- 2023-07-13 Listed $244,900 Heartland MLS as Distributed by MLS Grid
- 2021-03-12 Sold (Public Records) — Public Records
- 2021-03-12 Sold (MLS) — SOMO
- 2021-01-29 Listed $139,900 SOMO
- 2019-08-09 Sold (MLS) — SOMO
- 2019-07-11 Listed $85,900 SOMO
Property tax history
+12.2%/yrLatest (2025): $1,595 · +96.1% YoY. Source: county tax records.
Cash-flow waterfall
monthlySold comps — $/sqft
last 12 mo · ≤1 miLoading sold comps…