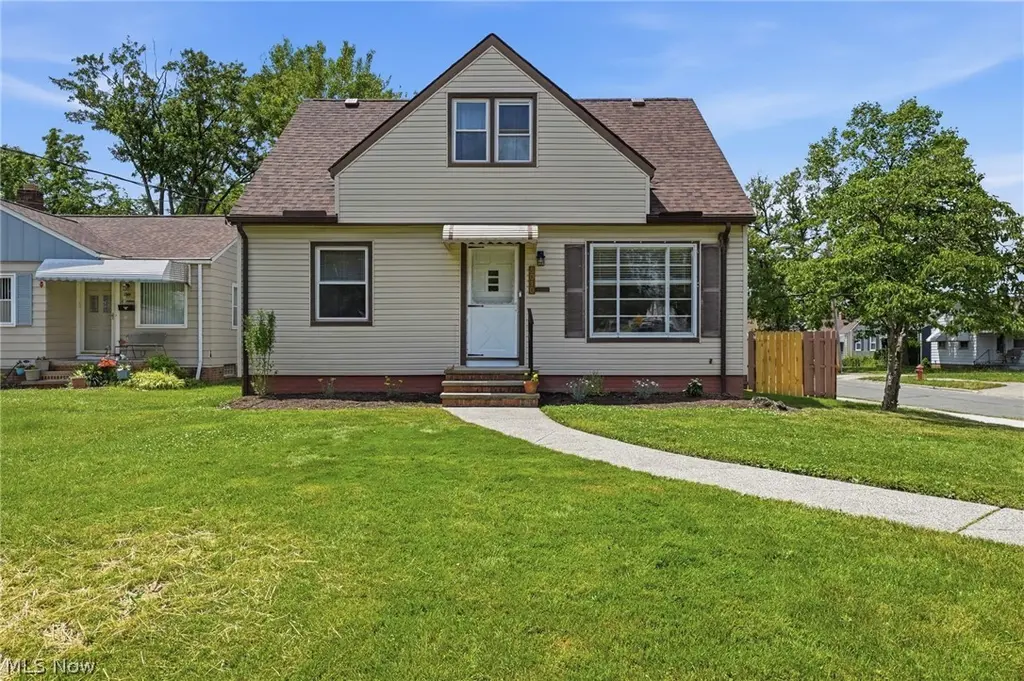
5010 Claremont Blvd · Garfield Heights, OH
Flood risk 1/10 · Minimal
- FEMA flood zone
- X (unshaded)
- Chance of flooding over 30 yrs
- 0.0%
- Est. flood insurance / yr
- $473 – $860
Fire risk 1/10 · Minimal
- Est. fire insurance / yr
- $713 – $1,323
Heat risk 3/10 · Minor
- Hot days now (above 95°F)
- 7 days/yr
- Hot days in 30 yrs
- 17 days/yr
Wind risk 1/10 · Minimal
- Chance of severe wind over 30 yrs
- —
Air-quality risk 3/10 · Minor
- Unhealthy air days now
- 2 days/yr
- Unhealthy air days in 30 yrs
- 3 days/yr
Risk factors via First Street. Map © Google.
Why this score? — see what drove the D- grade
The composite is a weighted blend of 9 inputs, each scored 0–100. Each bar is that input's sub-score; the figure is the points it added to the 100-point composite (weight × sub-score).
- Cash flow +14.7/30.0
- 1% rule +4.8/10.0
- DSCR +4.5/10.0
- Rent growth +3.7/5.0
- Livability +3.4/5.0
- Condition / age +2.5/5.0
- ARV discount +1.4/15.0
- Schools +1.3/10.0
- Appreciation +0.0/10.0
$169,900
🖨 Deal sheet (PDF) 📄 Offer letter ✓ Due diligence
Listing remarks MLS
Welcome to "Wow!", this 4 Bedroom home with a fenced-in yard and 2 car garage is on an oversized lot. Updated, clean and ready to move in. .. this house has 2 bedrooms on the 1st floor, 2 upstairs and a Owner's Suite Walk-n closet area to accommodate your large clothing and shoe collection! Between the finished basement and the upstairs area. .. there are multiple spaces to relax and chill~~. Updates include a brand new roof
Key facts
- French drains
- Fenced backyard
- Corner lot
Tags
Property features AI
Exterior
- Parking: Detached 2-car garage; Driveway (paved)
- Utilities: Public water; Public sewer
- Home design: 2 stories; Aluminum siding; Asphalt/fiberglass roof
- Construction: Aluminum siding construction; Asphalt/fiberglass roof
- Exterior features: Private yard; Back yard; Corner lot; Few trees; Flat, level lot
Interior
- Kitchen: Dishwasher; Microwave; Range; Refrigerator
- Bedrooms: 2 main-level bedrooms
- Bathrooms: 1 full bathroom (main level)
- Heating & cooling: Forced air heating (gas); Central air conditioning
- Interior features: Ceiling fan(s); Primary bedroom downstairs; Full, partially finished basement
- Laundry & utility: Washer; Dryer; Laundry located in the basement
Neighborhood map
What this means for you Summary
Snapshot
- This is a 4-bed/1.0-bath single-family listed at $170k.
Deal economics
- At list price, monthly cash flow is $43 ($521/yr) — positive.
- The deal already cash-flows at list — no discount required.
- To meet the 1% rule (rent ≥ 1% of price), the offer needs to be $166k (2.3% below list).
- Recommended offer: $166k (2.3% below list) — sets the bar for 1% rule.
Location & tenants
- Location reads 67/100 on livability (#593 in OH) — a middle-class / working-renter tenant base. Strengths: cost of living A+, housing A+, health & safety A; Watch: crime D-, amenities F, commute F.
- Garfield Heights City Schools (suburban): math 8% / reading 22% proficiency, ranked #643 of 656 in OH (top 98%) — low school quality limits family demand, transient renter base, plan for 1-2y turnover; 64% free/reduced lunch — lower-income household profile, screen leases tightly.
- Zoned schools: Elmwood Elementary School (math 8% / reading 22%, grade F, #1,382 of 1,584 statewide, top 88%, 323 students, 0% FRL); Garfield Heights Middle School (math 10% / reading 21%, grade F, #626 of 654 statewide, top 96%, 746 students, 0% FRL); Garfield Heights High School (math 4% / reading 23%, grade F, #718 of 781 statewide, top 92%, 1,109 students, 0% FRL) — zoned schools average 0% FRL vs 64% district-wide (64 pts lower); this property's tenant base skews higher-income than the district average.
- Market conditions: Rents rising fast (+4.8%/yr); 126 active listings in the ZIP; 30 comparable units currently listed for rent nearby; rentals at typical pace (median 18d on market — plan ~3-4 weeks tenant-placement turnaround); 1,441 units permitted in Cuyahoga County in 2024 (700 in 5+ unit buildings).
- This rent runs 35% of the median local income ($57k/yr) — at the standard rent-burdened threshold; future hikes will face affordability resistance.
Forward outlook
- Local home prices are declining (-3.0%/yr); year-one equity from $1k of loan paydown is wiped out by about $5k of value loss. Plan a longer hold.
- Cuyahoga County population projected to shrink 8% by 2050 — rents likely to lag national; underwrite the cash flow, not the appreciation.
Negotiation context
- Only 6 days on market — expect competitive offers; lowballing is unlikely to land.
- 6 sale attempts since 14y ago with the ask held roughly flat each time — persistent listings suggest the price (not the market) is what's stuck; bring a comps-based counter.
Risks & watch-outs
- Watch-outs: built in 1953 — expect roof / HVAC / electrical / plumbing capex.
Questions for the listing agent
- Built in 1953 — when were the roof, HVAC, electrical panel, plumbing, and water heater last replaced?
- Is there a deadline driving the sale (1031 exchange, divorce, estate, relocation)? That informs how much negotiation room exists.
- Crime grade is D in this area — have there been break-ins, vandalism, or insurance claims at this property in the last 3 years? What carrier currently insures it and at what premium?
- The area grade is low — what's the realistic commute time and amenity access for the typical tenant pool here? Any planned neighborhood developments (good or bad) we should know about?
- What's the average days-on-market for RENTAL listings here right now (not sales)? A rising rental-DOM trend means longer vacancies and softer asking-rent achievability than the comps imply.
- What's the recent tenant-quality profile in this submarket — average credit score on applications, eviction rate, late-payment / NSF rate, and stable-employment percentage? A property-management company in the area should have these aggregated.
- How much new for-sale + rental construction is in the pipeline within 1–3 miles? Heavy new supply typically softens prices + rents 12–24 months out; constrained supply supports both.
Investment metrics
- 1% rule
- 0.98% ✗
- Cap rate
- 6.60%
- Cash-on-cash
- 1.09%
- DSCR
- 1.05
- GRM
- 8.5
CMA / ARV
- ARV (on-the-fly)
- $149,760
- Comps found
- 12
Show comp detail 12 sales within ~0.75 mi
| Address | Dist | Beds/Ba | Sqft | Sold | Price | $/sf | Match |
|---|---|---|---|---|---|---|---|
| 12328 Park Knoll Dr | 0.12mi | 3/1.0 (-1) | 1,218 (+4%) | 1mo | $114,100 | $94 | 82 |
| 5213 E 119th St | 0.37mi | 3/1.0 (-1) | 1,152 (-2%) | 1mo | $135,000 | $117 | 74 |
| 5069 Henry St | 0.11mi | 3/2.0 (-1) | 1,275 (+9%) | 2mo | $139,900 | $110 | 69 |
| 12403 Park Knoll Dr | 0.14mi | 4/2.0 | 1,326 (+13%) | 2mo | $200,000 | $151 | 66 |
| 11303 Mccracken Rd | 0.50mi | 3/1.0 (-1) | 1,260 (+8%) | 0mo | $127,000 | $101 | 58 |
| 10721 Plymouth Ave | 0.72mi | 3/1.0 (-1) | 1,100 (-6%) | 0mo | $140,000 | $127 | 51 |
| 5365 E 131st St | 0.57mi | 3/1.0 (-1) | 1,056 (-10%) | 1mo | $135,000 | $128 | 51 |
| 4754 Lawrence Ave | 0.65mi | 3/1.5 (-1) | 1,248 (+7%) | 1mo | $167,000 | $134 | 51 |
| 13009 Willard Ave | 0.74mi | 3/2.0 (-1) | 1,134 (-3%) | 2mo | $156,500 | $138 | 49 |
| 11011 Wallingford Ave | 0.64mi | 3/1.0 (-1) | 1,308 (+12%) | 1mo | $156,000 | $119 | 45 |
| 4915 E 111th St | 0.62mi | 3/1.0 (-1) | 1,012 (-14%) | 2mo | $143,000 | $141 | 42 |
| 13600 Royal Blvd | 0.68mi | 3/2.0 (-1) | 1,036 (-12%) | 2mo | $205,000 | $198 | 39 |
Match score weights: distance 35% · size 25% · config 20% · recency 20%. Top-matched comps best support the ARV.
Projected returns pro-forma
-3.0% appreciation · 4.8% rent growth · sell at horizon
- IRR
- -12.3%
- Equity multiple
- 0.55×
- Total profit
- $-21,625
- Equity at exit
- $25,333
- IRR
- -0.5%
- Equity multiple
- 0.96×
- Total profit
- $-1,909
- Equity at exit
- $14,690
Cash invested: $47,572 (down + closing). Projections, not guarantees.
Landlord ↔ Tenant lean methodology
- Overall (STATE)
- 73 Landlord-Friendly
- State Ohio
- 73 Landlord-Friendly · R+6
- County
- — inherits STATE
- City
- — inherits STATE
ZIP-level market 44125
- Rents YoY
- 4.8%
- Active inventory
- 126
- Price-to-rent
- 8.5×
Monthly cashflow live
- Estimated rent
- $1,660 high interval (Pro) →
- Mortgage (P&I)
- −$891
- Tax from tax record
- −$306 /mo · $3,675/yr
- Insurance
- −$71
- HOA
- −$0
- Vacancy / Maint / Mgmt
- −$349
- Net cashflow
- $43
Break-even live
Sensitivity live
| Price | -10% $140 | -5% $91 | +0% $43 | +5% $-5 | +10% $-53 |
|---|---|---|---|---|---|
| Rent | -10% $-88 | -5% $-22 | +0% $43 | +5% $109 | +10% $175 |
| Rate | -1.0pp $129 | -0.5pp $87 | base $43 | +0.5pp $-1 | +1.0pp $-45 |
UW: 25.0% down · 7.5% · 30yr · 1.5% tax · 5.0% vac · 8.0% maint · 8.0% mgmt
Financing live
Cash to close
- Down payment
- $42,475
- Closing costs
- $5,097
- Reserves months
- —
- Total cash needed
- —
Loan-product check · same deal, 3 products live
Conventional
25% down · 7.5% · 30yr
- Down + closing
- —
- Monthly P&I
- —
- Monthly cashflow
- —
- DSCR
- —
- Eligible?
- —
Personal DTI + credit; lowest rate.
DSCR
20% down · 8.5% · 30yr
- Down + closing
- —
- Monthly P&I
- —
- Monthly cashflow
- —
- DSCR
- —
- Eligible?
- —
No personal income docs; deal must DSCR.
Hard money
10% down · 12.0% · 12mo
- Down + closing
- —
- Monthly P&I
- —
- Monthly cashflow
- —
- DSCR
- —
- Eligible?
- —
Short-term bridge; refi at stabilization.
Rent comps 30 comps
| Address | Beds | Baths | Sqft | Rent | $/sqft | DOM | Units | Dist |
|---|---|---|---|---|---|---|---|---|
| 5164 E 128th St Cleveland, OH | 4.0 | 1.0 | 1222 | $1,495 | $1.22 | 22d | 1 | 0.23mi |
| 5145 E 114th St Cleveland, OH | 3.0 | 1.5 | 1174 | $1,620 | $1.38 | 9d | 1 | 0.48mi |
| 11303 McCracken Rd Cleveland, OH | 3.0 | 1.0 | 1300 | $1,650 | $1.27 | 6d | 1 | 0.49mi |
| 5283 E 133rd St Cleveland, OH | 3.0 | 2.0 | 1176 | $1,495 | $1.27 | 18d | 1 | 0.50mi |
| 11213 McCracken Rd Cleveland, OH | 3.0 | 1.0 | 1200 | $1,375 | $1.15 | 9d | 1 | 0.54mi |
| 11110 Vernon Ave Cleveland, OH | 3.0 | 1.0 | 1224 | $1,395 | $1.14 | 25d | 1 | 0.54mi |
| 10721 Plymouth Ave Cleveland, OH | 3.0 | 1.0 | 1300 | $2,000 | $1.54 | 3d | 1 | 0.71mi |
| 10720 Edgepark Dr Cleveland, OH | 3.0 | 1.0 | 1296 | $1,449 | $1.12 | 19d | 1 | 0.78mi |
| 10722 Edgepark Dr Garfield Heights, OH | 3.0 | 1.0 | 1296 | $1,449 | $1.12 | 19d | 1 | 0.78mi |
| 5270 Beech Ave Maple Heights, OH | 3.0 | 1.0 | 1401 | $1,350 | $0.96 | 18d | 1 | 0.85mi |
| 12214 Shady Oak Blvd Cleveland, OH | 3.0 | 1.0 | 900 | $1,350 | $1.50 | 25d | 1 | 0.95mi |
| 12211 Woodward Blvd Cleveland, OH | 4.0 | 2.0 | 1236 | $1,500 | $1.21 | 12d | 1 | 0.98mi |
| 13776 Shady Oak Blvd Cleveland, OH | 4.0 | 1.0 | 1170 | $1,600 | $1.37 | 16d | 1 | 1.05mi |
| 12918 Eastwood Blvd Cleveland, OH | 4.0 | 1.0 | 1170 | $1,295 | $1.11 | 18d | 1 | 1.07mi |
| 5581 Saxon Dr Cleveland, OH | 3.0 | 2.0 | 1080 | $1,595 | $1.48 | 9d | 1 | 1.10mi |
| 10010 Parkview Ave Garfield Heights, OH | 3.0 | 1.0 | 877 | $1,500 | $1.71 | 19d | 1 | 1.11mi |
| 9516 Alexander Rd Cleveland, OH | 3.0 | 1.0 | 1500 | $2,000 | $1.33 | 21d | 1 | 1.16mi |
| 5200 Miller Ave Maple Heights, OH | 3.0 | 1.0 | 800 | $1,495 | $1.87 | 5d | 1 | 1.17mi |
| 14205 Corridon Ave Maple Heights, OH | 4.0 | 1.5 | 1236 | $1,650 | $1.33 | 25d | 1 | 1.22mi |
| 5074 Miller Ave Maple Heights, OH | 3.0 | 1.0 | 962 | $1,400 | $1.46 | 45d | 1 | 1.23mi |
| 4874 E 95th St Cleveland, OH | 3.0 | 1.5 | 1352 | $1,774 | $1.31 | 25d | 1 | 1.26mi |
| 4874 E 95th St Cleveland, OH | 3.0 | 1.5 | 1352 | $1,774 | $1.31 | 22d | 1 | 1.26mi |
| 9334 McCracken Blvd Cleveland, OH | 4.0 | 1.0 | 1150 | $1,595 | $1.39 | 18d | 1 | 1.27mi |
| 15913 Grant Ave Maple Heights, OH | 3.0 | 1.5 | 1400 | $1,390 | $0.99 | 18d | 1 | 1.39mi |
| 4309 E 142nd St Cleveland, OH | 4.0 | 2.0 | 1311 | $1,943 | $1.48 | 3d | 1 | 1.44mi |
| 5052 E 88th St Cleveland, OH | 3.0 | 1.0 | 1221 | $1,400 | $1.15 | 9d | 1 | 1.45mi |
| 5223 Paine Ave Maple Heights, OH | 4.0 | 1.0 | 1344 | $1,650 | $1.23 | 3d | 1 | 1.48mi |
| 12808 Havana Rd Cleveland, OH | 3.0 | 1.0 | 1056 | $1,350 | $1.28 | 18d | 1 | 1.49mi |
| 4935 E 86th St Cleveland, OH | 3.0 | 1.0 | 1242 | $1,300 | $1.05 | 18d | 1 | 1.49mi |
| 14519 Tokay Ave Maple Heights, OH | 3.0 | 1.0 | 1230 | $1,325 | $1.08 | 45d | 1 | 1.49mi |
Listing history 7 events
-
2026-06-18status $169,900 Pending 6 DOM
-
2026-06-18days on market $169,900 Active 6 DOM
-
2026-06-17days on market $169,900 Active 5 DOM
-
2026-06-16days on market $169,900 Active 4 DOM
-
2026-06-15days on market $169,900 Active 3 DOM
-
2026-06-13remarks 693-char remark
-
2026-06-13$169,900 Active 1 DOM
ⓘ Source: listings_history table (triggers on properties + properties_extension) + one-shot
backfill from property_details.listing_events for pre-trigger history.
Tax reassessment forecast OH · Partial reset (capped growth)
- Current annual tax
- $3,675 · $306/mo
- Projected year-2 tax
- $3,675 · $306/mo
- Expected delta
- $0/yr ($0/mo · 0.0%)
ⓘ Screening estimate from a state-policy table — verify with the county assessor before closing.
Climate risk First Street
- Flood 1/10 Low FEMA zone X (unshaded) · 0% chance over 30 yrs
- Wildfire 1/10 Low
- Heat 3/10 Moderate 7 d/yr ≥95°F today · 17 d/yr by 30 yrs out
- Wind 1/10 Low
- Air quality 3/10 Moderate 2 unhealthy d/yr today · 3 by 30 yrs out
Nearby sold comps map
Loading sold comps map…
Walkable amenities ~0.75 mi
Loading nearby amenities…
Taxation est. · year 1
- Rental income
- $19,920
- − Mortgage interest
- −$9,517
- − Property taxes
- −$3,675
- − Insurance
- −$850
- − Repairs & maintenance
- −$1,594
- − Management
- −$1,594
- − Depreciation
- −$4,943
- Taxable loss
- −$2,251
- Est. tax savings @ 24.0%
- +$540
- After-tax cash flow
- $1,061/yr
For passive investors: Depreciation is non-cash, so a rental often shows a tax loss while cash-flowing — sheltering income. Rental losses are passive: they offset passive income freely, and up to $25,000/yr can offset ordinary (W-2) income if you actively participate and your MAGI is under $100k (phasing out to $0 by $150k); unused losses carry forward. On sale, claimed depreciation is recaptured at up to 25%, and gains may owe capital-gains tax (a 1031 exchange can defer both). Figures are a year-1 estimate at your 24.0% rate — not tax advice; consult a CPA.
Schools (NCES district)
- District
- Garfield Heights City Schools
- NCES district ID
- 3904404
- Math proficiency
- 8% ▼ -19.00%
- Reading proficiency
- 22% ▼ -18.00%
- Median HH income
- $41,334
- Composite
- 12.88/100
- National rank
- #9590
- State rank
- #643 of 656 in OH
Livability — Garfield Heights
- Score
- 67/100
- State rank
- #593
- US rank
- #10152
Category grades
Schools grade is shown separately in the Schools card above.
Census & demographics
- Census place
- Garfield Heights, OH
- County
- Cuyahoga County · 1,090,369 people
- City population
- 29,461
- Metro
- Cleveland-Elyria, OH
- Population (ZIP)
- 29,461
- Household income
- $57,363
- Rent vs Own
- Severe rent burden
- 1738.0
Population outlook (Cuyahoga County) Hauer SSP2
- Today (2025)
- 1,244,621 people
- By 2030
- 1,230,093 · -1.2%
- By 2040
- 1,189,108 · -4.5%
- By 2050
- 1,145,706 · -7.9%
- By 2075
- 1,076,557 · -13.5%
- By 2100
- 978,987 · -21.3%
Race, ethnicity, and origin ACS 2023
- Neighborhood character
- Diverse neighborhood (Simpson 0.61)
- Race & ethnicity
- Black 47% White 41% Two or more races 7% Hispanic / Latino 6%
- Hispanic origin (detail)
- Mexican 2% Puerto Rican 3%
- Common ancestry
- Romanian 11% Slovak 1% Lithuanian 1%
- Foreign-born
- 3% · Canada
- Languages at home
- 94% English-only · Spanish 4% Russian/Polish/Slavic 1%
Political lean MEDSL · Cuyahoga
- 2024 margin
- Solid D (+31.5) · D 65.4% · R 33.9%
- 2008→2024 swing
- -7.4pp toward R · 2008: 38.9pp · 2024: 31.5pp
- All cycles
- 2024: D+31.5 2020: D+34.1 2016: D+35.0 2012: D+38.7 2008: D+38.9
Not yet ingested
- Civics
- —
Market trends
- HPI YoY
- ▼ -116.98%
- Current HPI
- 155.1507
- Rent YoY
- ▲ 4.80%
- Metro
- Cleveland-Elyria, OH
- State GDP YoY
- ▲ 1.98%
- F500 in state
- 48
Industry mix (Fortune 500 HQ in OH)
| Industry | F500 HQs | Revenue |
|---|---|---|
| Insurance | 3 | $145B |
|
||
| Industrial Machinery | 3 | $49B |
|
||
| Financial Services | 3 | $24B |
|
||
| Consumer Goods | 2 | $93B |
|
||
| Aerospace / Defense | 2 | $47B |
|
||
| Utilities | 2 | $33B |
|
||
Price history
+233.1% since first listed23 events — show timeline
- 2026-06-12 Listed $169,900 MLSNOW
- 2024-07-31 Sold (MLS) $150,000 MLSNOW
- 2024-06-24 Contingent — MLSNOW
- 2024-06-06 Listed $154,900 MLSNOW
- 2020-09-08 Sold (Public Records) $108,000 Public Records
- 2020-09-03 Sold (MLS) $108,000 MLSNOW
- 2020-06-28 Pending — MLSNOW
- 2020-06-22 Listed $119,000 MLSNOW
- 2020-06-19 Coming Soon $119,000 MLSNOW
- 2020-03-26 Sold (Public Records) $45,000 Public Records
- 2020-03-26 Sold (MLS) $45,000 MLSNOW
- 2020-03-06 Pending — MLSNOW
- 2020-03-02 Relisted — MLSNOW
- 2020-02-28 Listing Removed — MLSNOW
- 2020-01-29 Price Changed $49,900 MLSNOW
- 2019-12-23 Price Changed $55,900 MLSNOW
- 2019-12-08 Price Changed $59,900 MLSNOW
- 2019-08-30 Listed $62,900 MLSNOW
- 2013-03-28 Sold (Public Records) $45,000 Public Records
- 2013-03-28 Sold (MLS) $45,000 MLSNOW
- 2012-09-18 Listed $49,500 MLSNOW
- 1981-04-22 Sold (Public Records) $51,000 Public Records
- 1981-04-22 Sold (Public Records) $51,000 Public Records
Property tax history
+2.1%/yrLatest (2025): $3,675 · -17.9% YoY. Source: county tax records.
Cash-flow waterfall
monthlySold comps — $/sqft
last 12 mo · ≤1 miLoading sold comps…