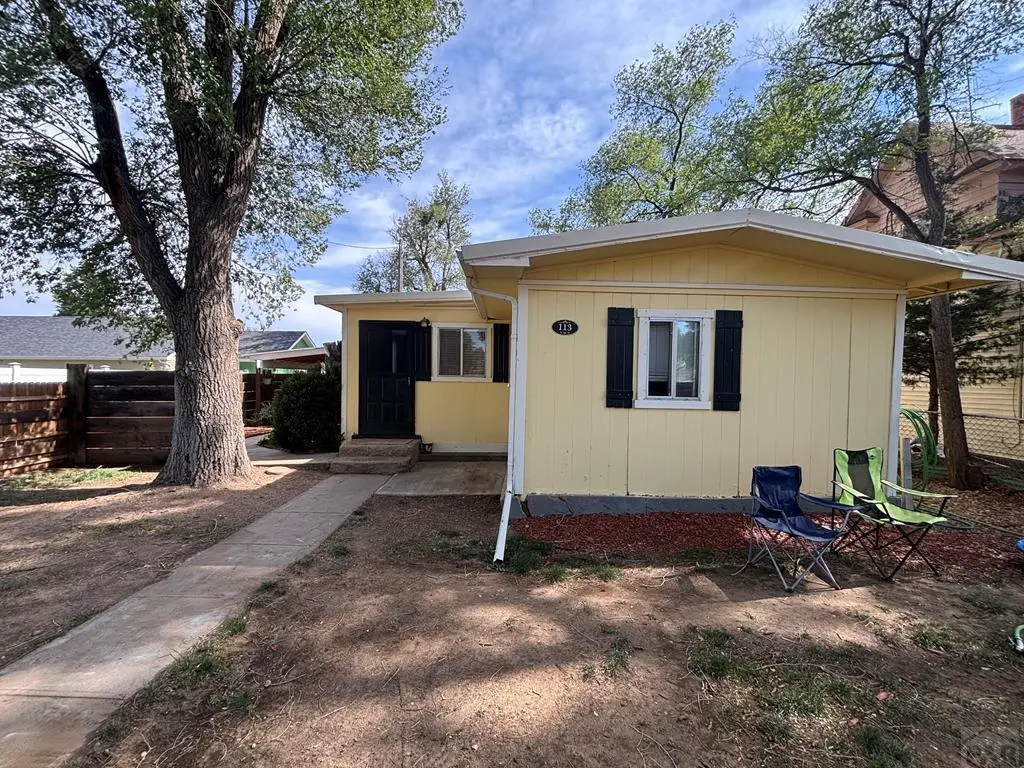
113 W 5th St · Ordway, CO
Flood risk No data
- FEMA flood zone
- —
- Chance of flooding over 30 yrs
- —
- Est. flood insurance / yr
- —
Fire risk No data
- Est. fire insurance / yr
- —
Heat risk No data
- Hot days now (above threshold)
- —
- Hot days in 30 yrs
- —
Wind risk No data
- Chance of severe wind over 30 yrs
- —
Air-quality risk No data
- Unhealthy air days now
- —
- Unhealthy air days in 30 yrs
- —
Risk factors via First Street. Map © Google.
Why this score? — see what drove the B- grade
The composite is a weighted blend of 9 inputs, each scored 0–100. Each bar is that input's sub-score; the figure is the points it added to the 100-point composite (weight × sub-score).
- Cash flow +25.6/30.0
- ARV discount +15.0/15.0
- DSCR +8.5/10.0
- 1% rule +5.7/10.0
- Appreciation +3.8/10.0
- Livability +3.1/5.0
- Rent growth +2.5/5.0
- Condition / age +2.5/5.0
- Schools +2.1/10.0
$120,000
🖨 Deal sheet 📄 Offer letter ✓ Due diligence
Listing remarks
This well-maintained 3-bedroom, 2-bath home offers comfort, convenience, and plenty of updates in a fantastic location! Situated just steps from Conestoga Park and only a block from the school, it's an ideal spot for easy walks to school, playgrounds, and neighborhood activities. The home has been thoughtfully expanded and refreshed with a beautifully updated kitchen, fresh paint, a newer furnace, numerous upgrades throughout, and a solid foundation that adds lasting peace of mind. The adjoining rear bedrooms create a flexible layout that works especially well as a private primary suite with a connected nursery or young child's room. The opposite end of the home has a bedroom with a private
Key facts
- Rear parking
- Sun room
- Covered patio
Tags
Property features AI
Finance
- HOA & community: No association amenities
Exterior
- Parking: No garage
- Security: Smoke detectors
- Utilities: Public water; Public sewer
- Home design: Residential mobile home (single-family)
- Construction: Wood siding construction; Above-grade finished living area
- Exterior features: Wood fencing; Metal roof; Shed(s); Irregular lot shape; Lot approximately 100 x 50
Interior
- Kitchen: Range; Oven; Dishwasher; Refrigerator
- Bedrooms: 3 main-level bedrooms
- Flooring: Carpet; Vinyl; Laminate
- Bathrooms: 2 full bathrooms (1 on the main level)
- Heating & cooling: Natural gas forced-air heating; Ceiling fan cooling
- Interior features: Ceiling fans; Master bedroom on main level; Double-pane windows; Free-standing fireplace (1)
- Laundry & utility: Washer and dryer (main level)
Neighborhood map
What this means for you Summary
Snapshot
- This is a 3-bed/2.0-bath single-family listed at $120k.
Deal economics
- At list price, monthly cash flow is $283 ($3k/yr) — positive.
- The deal already cash-flows at list — no discount required.
- Meets the 1% rule at list price ($1k rent vs $120k).
- Recommended offer: $116k (3.0% below list) — sets the bar for market timing.
Location & tenants
- Location reads 61/100 on livability (#233 in CO) — a middle-class / working-renter tenant base. Strengths: cost of living A+, housing A+; Watch: health & safety C-, schools F, amenities F.
- Crowley County School District No. Re-1-J (rural): math 16% / reading 28% proficiency, ranked #150 of 176 in CO (top 85%) — low school quality limits family demand, transient renter base, plan for 1-2y turnover; 62% free/reduced lunch — lower-income household profile, screen leases tightly.
- Market conditions: 29 active listings in the ZIP; 4 units permitted in Crowley County in 2024 (0 in 5+ unit buildings).
Forward outlook
- Local home prices are declining (-2.4%/yr); year-one equity from $830 of loan paydown is wiped out by about $3k of value loss. Plan a longer hold.
- Crowley County population projected at +14% by 2050 — modest demand growth; plan on rents tracking national, not racing it.
- At projected returns (-2.4% appreciation + 3.0% rent growth), your $34k cash investment doubles in ~10 years — after that, you're playing with house money.
Negotiation context
- It's been on market 34 days — a 3% lower offer ($116k) is reasonable based on typical stale-listing flexibility.
- 10 sale attempts since 5y ago with the ask held roughly flat each time — persistent listings suggest the price (not the market) is what's stuck; bring a comps-based counter.
- Current owner paid $95k; 26% above their basis — modest negotiation headroom, anchor on the comps not their cost.
Questions for the listing agent
- It's been on market 34 days. Have you received any prior offers? Is the seller open to a 3% concession, seller financing, or rate buy-down credit?
- Built in 1970 — when were the roof, HVAC, electrical panel, plumbing, and water heater last replaced?
- Is there a deadline driving the sale (1031 exchange, divorce, estate, relocation)? That informs how much negotiation room exists.
- Schools are F-rated, which usually means shorter tenancies and higher turnover. Who's the typical renter profile here, and what's been the actual vacancy rate?
- What's the average days-on-market for RENTAL listings here right now (not sales)? A rising rental-DOM trend means longer vacancies and softer asking-rent achievability than the comps imply.
- What's the recent tenant-quality profile in this submarket — average credit score on applications, eviction rate, late-payment / NSF rate, and stable-employment percentage? A property-management company in the area should have these aggregated.
- How much new for-sale + rental construction is in the pipeline within 1–3 miles? Heavy new supply typically softens prices + rents 12–24 months out; constrained supply supports both.
Investment metrics
- 1% rule
- 1.07% ✓
- Cap rate
- 9.12%
- Cash-on-cash
- 10.10%
- DSCR
- 1.45
- GRM
- 7.8
CMA / ARV
- ARV (on-the-fly)
- $169,260
- Comps found
- 5
Show comp detail 5 sales within ~0.75 mi
| Address | Dist | Beds/Ba | Sqft | Sold | Price | $/sf | Match |
|---|---|---|---|---|---|---|---|
| 119 W 5th St | 0.02mi | 4/1.0 (+1) | 1,311 (-4%) | 13mo | $152,000 | $116 | 72 |
| 229 Sherman Ave | 0.26mi | 2/1.0 (-1) | 1,260 (-8%) | 1mo | $167,000 | $133 | 66 |
| 527 Mountain Vw | 0.38mi | 3/2.0 | 1,242 (-9%) | 10mo | $240,000 | $193 | 60 |
| 122 Otero | 0.35mi | 3/1.0 | 1,246 (-9%) | 9mo | $155,000 | $124 | 57 |
| 220 Lake Ave | 0.33mi | 3/2.0 | 1,224 (-10%) | 23mo | $102,000 | $83 | 48 |
Match score weights: distance 35% · size 25% · config 20% · recency 20%. Top-matched comps best support the ARV.
Projected returns pro-forma
-2.42% appreciation · 3.0% rent growth · sell at horizon
- IRR
- 1.1%
- Equity multiple
- 1.04×
- Total profit
- $1,436
- Equity at exit
- $20,995
- IRR
- 9.7%
- Equity multiple
- 1.80×
- Total profit
- $26,814
- Equity at exit
- $15,784
Cash invested: $33,600 (down + closing). Projections, not guarantees.
Landlord ↔ Tenant lean methodology
- Overall (STATE)
- 38 Tenant-Leaning
- State Colorado
- 38 Tenant-Leaning · D+4
- County
- — inherits STATE
- City
- — inherits STATE
ZIP-level market 81063
- Home prices YoY
- -1.1%
- Active inventory
- 29
- Price-to-rent
- 7.8×
Monthly cashflow live
- Estimated rent
- $1,283 medium interval (Pro) →
- Mortgage (P&I)
- −$629
- Tax from tax record
- −$52 /mo · $618/yr
- Insurance
- −$50
- HOA
- −$0
- Vacancy / Maint / Mgmt
- −$269
- Net cashflow
- $283
Break-even live
UW: 25.0% down · 7.5% · 30yr · 1.5% tax · 5.0% vac · 8.0% maint · 8.0% mgmt
Financing live
Cash to close
- Down payment
- $30,000
- Closing costs
- $3,600
- Reserves months
- —
- Total cash needed
- —
Loan-product check · same deal, 3 products live
Conventional
25% down · 7.5% · 30yr
- Down + closing
- —
- Monthly P&I
- —
- Monthly cashflow
- —
- DSCR
- —
- Eligible?
- —
Personal DTI + credit; lowest rate.
DSCR
20% down · 8.5% · 30yr
- Down + closing
- —
- Monthly P&I
- —
- Monthly cashflow
- —
- DSCR
- —
- Eligible?
- —
No personal income docs; deal must DSCR.
Hard money
10% down · 12.0% · 12mo
- Down + closing
- —
- Monthly P&I
- —
- Monthly cashflow
- —
- DSCR
- —
- Eligible?
- —
Short-term bridge; refi at stabilization.
Listing history 49 events
-
2026-06-19days on market $120,000 Active 34 DOM
-
2026-06-18days on market $120,000 Active 33 DOM
-
2026-06-17days on market $120,000 Active 32 DOM
-
2026-06-16days on market $120,000 Active 31 DOM
-
2026-06-15days on market $120,000 Active 30 DOM
-
2026-06-13days on market $120,000 Active 28 DOM
-
2026-06-12days on market $120,000 Active 27 DOM
-
2026-06-09days on market $120,000 Active 24 DOM
-
2026-06-08days on market $120,000 Active 23 DOM
-
2026-06-07days on market $120,000 Active 22 DOM
-
2026-06-04days on market $120,000 Active 18 DOM
-
2026-06-02days on market $120,000 Active 17 DOM
-
2026-06-01days on market $120,000 Active 16 DOM
-
2026-05-31days on market $120,000 Active 15 DOM
-
2026-05-31days on market $120,000 Active 14 DOM
-
2026-05-16$120,000 Active
-
2026-04-14price $120,000
-
2025-09-10status Active
-
2025-07-30$125,000 Active
-
2024-07-12$140,000 Active
-
2023-11-19historical
-
2023-06-17price $135,000
-
2023-06-16price $135,000
-
2023-06-10price $140,000
-
2023-06-09price $140,000
-
2023-06-01price $145,000
-
2023-06-01price $145,000
-
2023-05-21price $150,000
-
2023-05-20price $150,000
-
2023-05-09price $160,000
-
2023-04-13$165,000 Active
-
2023-04-06$165,000 Active
-
2023-04-02historical
-
2023-03-21historical
-
2023-03-05historical Active - Backup
-
2023-03-05price $145,000
-
2023-02-15$135,000 Active
-
2023-02-09historical
-
2023-02-02price $143,000
-
2023-01-14price $145,000
-
2022-12-10$155,000 Active
-
2022-12-04historical
-
2022-01-20soldstatus $95,000
-
2022-01-20soldstatus $95,000
-
2021-11-15$99,000
-
2021-06-24soldstatus $84,750
-
2021-06-24soldstatus $84,800
-
2021-04-14$84,750
-
2006-11-20soldstatus $19,500
ⓘ Source: listings_history table (triggers on properties + properties_extension) + one-shot
backfill from property_details.listing_events for pre-trigger history.
Tax reassessment forecast CO · Resets to sale price
- Current annual tax
- $618 · $52/mo
- Projected year-2 tax
- $660 · $55/mo
- Expected delta
- +$42/yr (+$3/mo · 6.8%)
ⓘ Screening estimate from a state-policy table — verify with the county assessor before closing.
Nearby sold comps map
Loading sold comps map…
Walkable amenities ~0.75 mi
Loading nearby amenities…
Taxation est. · year 1
- Rental income
- $15,395
- − Mortgage interest
- −$6,722
- − Property taxes
- −$618
- − Insurance
- −$600
- − Repairs & maintenance
- −$1,232
- − Management
- −$1,232
- − Depreciation
- −$3,491
- Taxable income
- $1,501
- Est. tax owed @ 24.0%
- −$360
- After-tax cash flow
- $3,032/yr
For passive investors: Depreciation is non-cash, so a rental often shows a tax loss while cash-flowing — sheltering income. Rental losses are passive: they offset passive income freely, and up to $25,000/yr can offset ordinary (W-2) income if you actively participate and your MAGI is under $100k (phasing out to $0 by $150k); unused losses carry forward. On sale, claimed depreciation is recaptured at up to 25%, and gains may owe capital-gains tax (a 1031 exchange can defer both). Figures are a year-1 estimate at your 24.0% rate — not tax advice; consult a CPA.
Schools (NCES district)
- District
- Crowley County School District No. Re-1-J
- NCES district ID
- 0803210
- Math proficiency
- 16% ▼ -10.00%
- Reading proficiency
- 28% ▼ -12.00%
- Median HH income
- $35,031
- Composite
- 21.28/100
- National rank
- #13663
- State rank
- #150 of 176 in CO
Livability — Ordway
- Score
- 61/100
- State rank
- #233
- US rank
- #18425
Category grades
Schools grade is shown separately in the Schools card above.
Census & demographics
- Census place
- Ordway, CO
- Population (ZIP)
- 3,060
Population outlook (Crowley County) Hauer SSP2
- Today (2025)
- 5,612 people
- By 2030
- 5,725 · +2.0%
- By 2040
- 6,092 · +8.6%
- By 2050
- 6,391 · +13.9%
- By 2075
- 6,250 · +11.4%
- By 2100
- 5,349 · -4.7%
Race, ethnicity, and origin ACS 2023
- Neighborhood character
- Diverse neighborhood (Simpson 0.64)
- Race & ethnicity
- White 52% Hispanic / Latino 28% Two or more races 18% Black 7% Native American 6%
- Hispanic origin (detail)
- Mexican 11%
- Common ancestry
- Serbian 3% Portuguese 2% Iranian 1%
- Foreign-born
- 2% · Vietnam, Canada
- Languages at home
- 91% English-only · Spanish 8% Vietnamese 1%
Political lean MEDSL · Crowley
- 2024 margin
- Solid R (+47.4) · D 24.7% · R 72.2% · Other 3.1%
- 2008→2024 swing
- -20.2pp toward R · 2008: -27.2pp · 2024: -47.4pp
- All cycles
- 2024: R+47.4 2020: R+47.7 2016: R+48.5 2012: R+25.9 2008: R+27.2
Not yet ingested
- Civics
- —
Market trends
- HPI YoY
- ▼ -2.42%
- Current HPI
- 211.1097
- Rent YoY
- —
- Metro
- —
- State GDP YoY
- ▲ 1.95%
- F500 in state
- 14
Industry mix (Fortune 500 HQ in CO)
| Industry | F500 HQs | Revenue |
|---|---|---|
| Technology Distribution | 1 | $31B |
|
||
| Food / Agriculture | 1 | $18B |
|
||
| Packaging | 1 | $14B |
|
||
| Healthcare | 1 | $13B |
|
||
| Energy | 1 | $10B |
|
||
| Technology | 1 | $4B |
|
||
Price history
+515.4% since first listed34 events — show timeline
- 2026-05-16 Listed $120,000 PARMLS
- 2026-04-14 Price Changed $120,000 PARMLS
- 2025-09-10 Relisted — PARMLS
- 2025-07-30 Listed $125,000 PARMLS
- 2024-07-12 Listed $140,000 PARMLS
- 2023-11-19 Listing Removed — IRES
- 2023-06-17 Price Changed $135,000 PARMLS
- 2023-06-16 Price Changed $135,000 IRES
- 2023-06-10 Price Changed $140,000 PARMLS
- 2023-06-09 Price Changed $140,000 IRES
- 2023-06-01 Price Changed $145,000 IRES
- 2023-06-01 Price Changed $145,000 PARMLS
- 2023-05-21 Price Changed $150,000 PARMLS
- 2023-05-20 Price Changed $150,000 IRES
- 2023-05-09 Price Changed $160,000 IRES
- 2023-04-13 Listed $165,000 PARMLS
- 2023-04-06 Listed $165,000 IRES
- 2023-04-02 Coming Soon — IRES
- 2023-03-21 Listing Removed — IRES
- 2023-03-05 Contingent — IRES
- 2023-03-05 Price Changed $145,000 IRES
- 2023-02-15 Listed $135,000 IRES
- 2023-02-09 Listing Removed — IRES
- 2023-02-02 Price Changed $143,000 IRES
- 2023-01-14 Price Changed $145,000 IRES
- 2022-12-10 Listed $155,000 IRES
- 2022-12-04 Coming Soon — IRES
- 2022-01-20 Sold (Public Records) $95,000 Public Records
- 2022-01-20 Sold (MLS) $95,000 PARMLS
- 2021-11-15 Listed $99,000 PARMLS
- 2021-06-24 Sold (Public Records) $84,800 Public Records
- 2021-06-24 Sold (MLS) $84,750 PARMLS
- 2021-04-14 Listed $84,750 PARMLS
- 2006-11-20 Sold (Public Records) $19,500 Public Records
Property tax history
+9.1%/yrLatest (2025): $618 · +125.9% YoY. Source: county tax records.
Cash-flow waterfall
monthlySold comps — $/sqft
last 12 mo · ≤1 miLoading sold comps…