 🏷️ Likely Rental
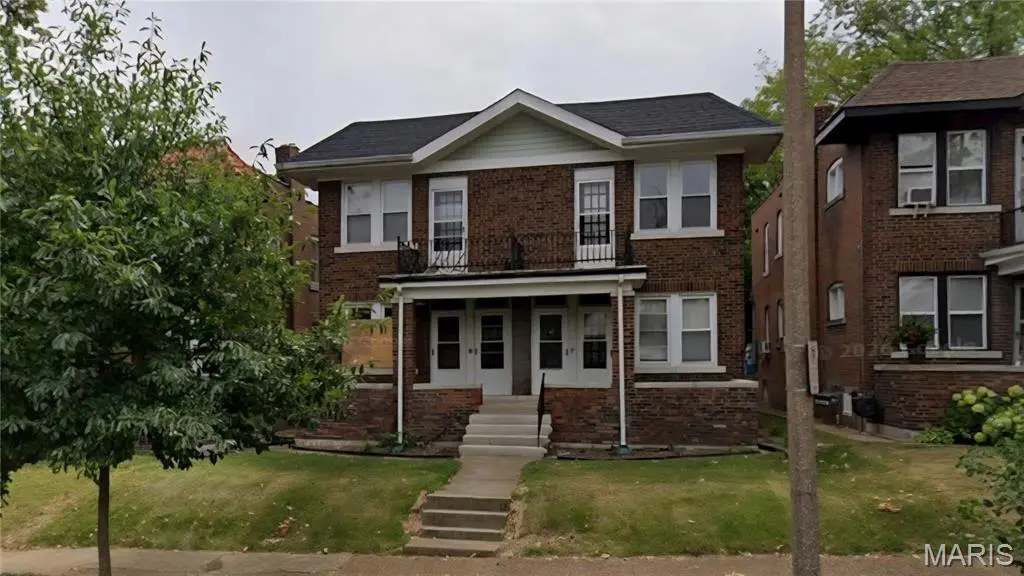
5042 Pernod Ave Unit 2F · St. Louis, MO
Flood risk 1/10 · Minimal
- FEMA flood zone
- X (unshaded)
- Chance of flooding over 30 yrs
- 0.0%
- Est. flood insurance / yr
- $473 – $860
Fire risk 1/10 · Minimal
- Est. fire insurance / yr
- $1,054 – $1,958
Heat risk 5/10 · Moderate
- Hot days now (above 108°F)
- 7 days/yr
- Hot days in 30 yrs
- 21 days/yr
Wind risk 2/10 · Minimal
- Chance of severe wind over 30 yrs
- 1.0%
Air-quality risk 3/10 · Minor
- Unhealthy air days now
- 3 days/yr
- Unhealthy air days in 30 yrs
- 4 days/yr
Risk factors via First Street. Map © Google.
Why this score? — see what drove the D grade
The composite is a weighted blend of 9 inputs, each scored 0–100. Each bar is that input's sub-score; the figure is the points it added to the 100-point composite (weight × sub-score).
- Cash flow +15.0/30.0
- ARV discount +7.5/15.0
- 1% rule +5.0/10.0
- DSCR +5.0/10.0
- Rent growth +3.8/5.0
- Livability +2.5/5.0
- Condition / age +2.5/5.0
- Schools +1.2/10.0
- Appreciation +0.0/10.0
$800
🖨 Deal sheet 📄 Offer letter ✓ Due diligence
Multi-family units
County records classify this as Multi-Family (2-4 Unit). Listing-text estimate: 1 unit. estimate disagrees with records
Listing remarks
Now leasing beautifully updated units in this charming South St. Louis quadplex! These apartments feature recent renovations, new appliances, and refreshed interiors, offering the perfect mix of classic city character and modern comfort. Enjoy bright living spaces, updated kitchens, and a clean, well-maintained building located on a quaint residential street. The property is conveniently situated near parks, local restaurants, shopping, and major roadways, making it easy to get anywhere in St. Louis. These units won't stay available long due to the recent updates and desirable South City location, so schedule a showing soon!
Key facts
- Recent renovations
- New appliances
- Local restaurants
Tags
Property features AI
Finance
- Other: Unit count not specified
- Financial info: Annual property tax listed for 2025
Exterior
- Home design: Residential income property; 2–4 unit building
- Construction: Brick construction
- Exterior features: Lot about 0.11 acres
Interior
- Bedrooms: No main or upper level bedrooms listed
- Bathrooms: No main or upper level bathrooms listed
- Heating & cooling: Radiant heating; Window air conditioning unit(s)
- Interior features: Radiant heating; Window air conditioning unit(s)
Neighborhood map
What this means for you Summary
Snapshot
- This is a multifamily listed at $800.
Deal economics
- At list price, monthly cash flow is $3k ($37k/yr) — positive.
- The deal already cash-flows at list — no discount required.
- Meets the 1% rule at list price ($4k rent vs $800).
- Cap rate 4638.5% vs local median 5.0% in St. Louis — top-decile yield for the area; either an underpriced asset or a hidden risk that comps aren't pricing in. Stress-test before assuming the spread holds.
Location & tenants
- Location reads: area grade D — affects rentability + tenant quality, not the cash-flow math above.
- St. Louis City (urban): math 10% / reading 18% proficiency, ranked #312 of 324 in MO (top 96%) — low school quality limits family demand, transient renter base, plan for 1-2y turnover; 80% free/reduced lunch — lower-income household profile, screen leases tightly.
- Zoned schools: Buder Elem. (math 12% / reading 22%, grade F, #967 of 1,115 statewide, top 88%, 403 students, 99% FRL); Roosevelt High (math 2% / reading 8%, grade F, #517 of 521 statewide, top 100%, 460 students, 99% FRL) — zoned schools average 99% FRL vs 80% district-wide (19 pts higher); higher-poverty schools than district average — tighter screening recommended.
- Market conditions: Rents rising fast (+5.4%/yr); 137 active listings in the ZIP; 40 comparable units currently listed for rent nearby; rentals at typical pace (median 20d on market — plan ~3-4 weeks tenant-placement turnaround); solid renter incomes; 294 units permitted in St. Louis city in 2024 (227 in 5+ unit buildings).
- At $3,916/mo this rent would consume 62% of the median local household income ($76k/yr) (locally 653% of renters already pay >50% of income on rent) — very limited rent-growth headroom before tenants either downsize or default.
Forward outlook
- Local home prices are declining (-3.0%/yr); year-one equity from $6 of loan paydown is wiped out by about $24 of value loss. Plan a longer hold.
- St. Louis County population projected to shrink 6% by 2050 — rents likely to lag national; underwrite the cash flow, not the appreciation.
- At projected returns (-3.0% appreciation + 5.4% rent growth), your $224 cash investment doubles in ~1 year — after that, you're playing with house money.
Negotiation context
- Only 8 days on market — expect competitive offers; lowballing is unlikely to land.
Risks & watch-outs
- Watch-outs: built in 1929 — expect roof / HVAC / electrical / plumbing capex.
- Climate carrying-cost: extreme-heat days projected 7→21/yr by 2055 (HVAC capex compounding) — expect insurance premiums to compound above CPI over the hold.
Questions for the listing agent
- Built in 1929 — when were the roof, HVAC, electrical panel, plumbing, and water heater last replaced?
- Is there a deadline driving the sale (1031 exchange, divorce, estate, relocation)? That informs how much negotiation room exists.
- The area grade is low — what's the realistic commute time and amenity access for the typical tenant pool here? Any planned neighborhood developments (good or bad) we should know about?
- What's the average days-on-market for RENTAL listings here right now (not sales)? A rising rental-DOM trend means longer vacancies and softer asking-rent achievability than the comps imply.
- What's the recent tenant-quality profile in this submarket — average credit score on applications, eviction rate, late-payment / NSF rate, and stable-employment percentage? A property-management company in the area should have these aggregated.
- How much new apartment / multifamily construction is in the pipeline within 1–3 miles? Heavy new supply (>2% of stock underway) typically softens rents 12–24 months out; light construction supports rent growth.
Investment metrics
- 1% rule
- 489.50% ✓
- Cap rate
- 4638.46%
- Cash-on-cash
- 16543.45%
- DSCR
- 737.09
- GRM
- 0.0
CMA / ARV
No comps found within radius.
Projected returns pro-forma
-3.0% appreciation · 5.39% rent growth · sell at horizon
- IRR
- —
- Equity multiple
- 921.78×
- Total profit
- $206,254
- Equity at exit
- $119
- IRR
- —
- Equity multiple
- 2119.99×
- Total profit
- $474,653
- Equity at exit
- $69
Cash invested: $224 (down + closing). Projections, not guarantees.
Landlord ↔ Tenant lean methodology
- Overall (STATE)
- 81 Strongly Landlord-Friendly
- State Missouri
- 81 Strongly Landlord-Friendly · R+10
- County
- — inherits STATE
- City
- — inherits STATE
ZIP-level market 63139
- Rents YoY
- 5.4%
- Active inventory
- 137
- Price-to-rent
- 0.1×
Monthly cashflow live
- Estimated rent
- $3,916 high interval (Pro) →
- Mortgage (P&I)
- −$4
- Tax est. 1.5%
- −$1 /mo · $12/yr
- Insurance
- −$0
- HOA
- −$0
- Vacancy / Maint / Mgmt
- −$822
- Net cashflow
- $3,088
Break-even live
4-unit breakdown (identical units grouped — click to expand)
| Units | Beds | Baths | Est. rent |
|---|---|---|---|
| 4× units | 2 | 1 | $3,916 |
| #1 | 2 | 1 | $979 |
| #2 | 2 | 1 | $979 |
| #3 | 2 | 1 | $979 |
| #4 | 2 | 1 | $979 |
| Total (4 units) | $3,916 | ||
UW: 25.0% down · 7.5% · 30yr · 1.5% tax · 5.0% vac · 8.0% maint · 8.0% mgmt
Financing live
Cash to close
- Down payment
- $200
- Closing costs
- $24
- Reserves months
- —
- Total cash needed
- —
Loan-product check · same deal, 3 products live
Conventional
25% down · 7.5% · 30yr
- Down + closing
- —
- Monthly P&I
- —
- Monthly cashflow
- —
- DSCR
- —
- Eligible?
- —
Personal DTI + credit; lowest rate.
DSCR
20% down · 8.5% · 30yr
- Down + closing
- —
- Monthly P&I
- —
- Monthly cashflow
- —
- DSCR
- —
- Eligible?
- —
No personal income docs; deal must DSCR.
Hard money
10% down · 12.0% · 12mo
- Down + closing
- —
- Monthly P&I
- —
- Monthly cashflow
- —
- DSCR
- —
- Eligible?
- —
Short-term bridge; refi at stabilization.
Rent comps 40 comps
| Address | Beds | Baths | Sqft | Rent | $/sqft | DOM | Units | Dist |
|---|---|---|---|---|---|---|---|---|
| 5042 Pernod Ave Unit 1F St. Louis, MO | 1.0 | 1.0 | 717 | $900 | $1.26 | 17d | 1 | 0.03mi |
| 5042 Pernod Ave Saint Louis, MO | 1.0 | 1.0 | 717 | $800 | $1.12 | 4d | 1 | 0.03mi |
| 5001 Tholozan Ave Unit 2E St. Louis, MO | 1.0 | 1.0 | 700 | $950 | $1.36 | 7d | 1 | 0.11mi |
| 3706 Hereford St Unit 1s St. Louis, MO | 1.0 | 1.0 | 750 | $795 | $1.06 | 4d | 1 | 0.13mi |
| 5046 Lindenwood Ave Unit 5046 St. Louis, MO | 1.0 | 1.0 | 728 | $950 | $1.30 | 43d | 1 | 0.17mi |
| 5044 Lindenwood Ave Unit 5044 St. Louis, MO | 1.0 | 1.0 | 728 | $950 | $1.30 | 43d | 1 | 0.18mi |
| 5000 Lindenwood Ave Unit 5000 Lindenwood 1FL St. Louis, MO | 1.0 | 1.0 | 750 | $850 | $1.13 | 23d | 1 | 0.21mi |
| 5000 Lindenwood Ave Unit 5002 Lindenwood 1FL St. Louis, MO | 1.0 | 1.0 | 750 | $850 | $1.13 | 7d | 1 | 0.21mi |
| 5028 Chippewa St Unit A St. Louis, MO | 1.0 | 1.0 | 714 | $825 | $1.16 | 23d | 1 | 0.25mi |
| 4909 Lindenwood Ave Apt 102 St. Louis, MO | 1.0 | 1.0 | 574 | $1,095 | $1.91 | 43d | 1 | 0.32mi |
| 4915 Potomac St St. Louis, MO | 1.0 | 1.0 | 431 | $725 | $1.68 | 43d | 1 | 0.36mi |
| 4909 Winona Ave Unit 2w St. Louis, MO | 1.0 | 1.0 | 700 | $800 | $1.14 | 43d | 1 | 0.38mi |
| 5335 Bancroft Ave Apt 2E St. Louis, MO | 1.0 | 1.0 | 697 | $950 | $1.36 | 23d | 1 | 0.41mi |
| 5335 Bancroft Ave Apt 2W St. Louis, MO | 1.0 | 1.0 | 697 | $850 | $1.22 | 7d | 1 | 0.41mi |
| 5515 Chippewa St Unit A St. Louis, MO | 1.0 | 1.0 | 700 | $900 | $1.29 | 43d | 1 | 0.48mi |
| 4448 Oleatha Ave St. Louis, MO | 1.0 | 1.0 | 720 | $950 | $1.32 | 20d | 1 | 0.59mi |
| 4407 Chippewa St Unit C St. Louis, MO | 1.0 | 1.0 | 400 | $795 | $1.99 | 23d | 1 | 0.65mi |
| 4381 Chippewa St Unit B St. Louis, MO | 1.0 | 1.0 | 400 | $600 | $1.50 | 43d | 1 | 0.67mi |
| 4377 Chippewa St Unit G St. Louis, MO | 1.0 | 1.0 | 400 | $600 | $1.50 | 43d | 1 | 0.67mi |
| 4948 Kemper Ave Unit 4948 2nd Floor St. Louis, MO | 1.0 | 1.0 | 675 | $925 | $1.37 | 17d | 1 | 0.69mi |
| 5816 Lindenwood Ave Saint Louis, MO | 1.0 | 1.0 | 650 | $895 | $1.38 | 43d | 1 | 0.77mi |
| 5347 Arsenal St Unit 5 St. Louis, MO | 1.0 | 1.0 | 690 | $825 | $1.20 | 11d | 1 | 0.77mi |
| 5347 Arsenal St Unit 8 St. Louis, MO | 1.0 | 1.0 | 700 | $825 | $1.18 | 1d | 1 | 0.77mi |
| 5349 Arsenal St St. Louis, MO | 1.0 | 1.0 | 700 | $825 | $1.18 | 14d | 1 | 0.77mi |
| 5349 Arsenal St St. Louis, MO | 1.0 | 1.0 | 700 | $825 | $1.18 | 2d | 1 | 0.77mi |
| 5371 Arsenal St Apt 202 St. Louis, MO | 1.0 | 1.0 | 650 | $1,075 | $1.65 | 7d | 1 | 0.78mi |
| 3625 Morgan Ford Rd Unit 6 St. Louis, MO | 1.0 | 1.0 | 650 | $799 | $1.23 | 43d | 1 | 0.81mi |
| 4341 Morgan Ford Rd Unit F St. Louis, MO | 1.0 | 1.0 | 750 | $749 | $1.00 | 4d | 1 | 0.83mi |
| 4341 Morganford Rd Saint Louis, MO | 1.0 | 1.0 | 750 | $799 | $1.07 | 43d | 1 | 0.83mi |
| 3534 Morgan Ford Rd Unit 3534-C St. Louis, MO | 2.0 | 1.0 | 650 | $1,150 | $1.77 | 43d | 1 | 0.85mi |
| 5927 Suson Pl St. Louis, MO | 1.0–2.0 | 1.0 | 670 | $1,235 | $1.84 | 1d | 12 | 0.89mi |
| 5353 Walsh St Unit 2B St. Louis, MO | 1.0 | 1.0 | 570 | $795 | $1.39 | 43d | 1 | 0.92mi |
| 3201 Morganford Rd Saint Louis, MO | 1.0 | 1.0 | 746 | $1,725 | $2.31 | 1d | 4 | 0.95mi |
| 4316 Connecticut St Unit 2F St. Louis, MO | 1.0 | 1.0 | 700 | $799 | $1.14 | 17d | 1 | 0.96mi |
| 4192 Meramec St Unit 104 St. Louis, MO | 1.0 | 1.0 | 675 | $850 | $1.26 | 43d | 1 | 0.98mi |
| 4192 Meramec St Unit 105 St. Louis, MO | 1.0 | 1.0 | 700 | $815 | $1.16 | 43d | 1 | 0.98mi |
| 4192 Meramec St Unit 101 St. Louis, MO | 1.0 | 1.0 | 700 | $850 | $1.21 | 20d | 1 | 0.98mi |
| 5825 Southwest Ave Unit 1 St. Louis, MO | 1.0 | 1.0 | 750 | $1,125 | $1.50 | 7d | 1 | 0.99mi |
| 4231-4233 Ellenwood Ave St. Louis, MO | 1.0 | 1.0 | 650 | $825 | $1.27 | 14d | 1 | 1.01mi |
| 4227 Ellenwood Ave Saint Louis, MO | 1.0 | 1.0 | 650 | $825 | $1.27 | 16d | 1 | 1.02mi |
Listing history 7 events
-
2026-06-09days on market $800 Active 8 DOM
-
2026-06-08days on market $800 Active 7 DOM
-
2026-06-07days on market $800 Active 6 DOM
-
2026-06-05days on market $800 Active 3 DOM
-
2026-06-03days on market $800 Active 2 DOM
-
2026-06-02remarks 632-char remark
-
2026-06-02$800 Active 1 DOM
ⓘ Source: listings_history table (triggers on properties + properties_extension) + one-shot
backfill from property_details.listing_events for pre-trigger history.
Climate risk First Street
- Flood 1/10 Low FEMA zone X (unshaded) · 0% chance over 30 yrs
- Wildfire 1/10 Low
- Heat 5/10 Major 7 d/yr ≥108°F today · 21 d/yr by 30 yrs out
- Wind 2/10 Low 100% chance of damaging wind over 30 yrs
- Air quality 3/10 Moderate 3 unhealthy d/yr today · 4 by 30 yrs out
Nearby sold comps map
Loading sold comps map…
Walkable amenities ~0.75 mi
Loading nearby amenities…
Taxation est. · year 1
- Rental income
- $46,992
- − Mortgage interest
- −$45
- − Property taxes
- −$12
- − Insurance
- −$4
- − Repairs & maintenance
- −$3,759
- − Management
- −$3,759
- − Depreciation
- −$23
- Taxable income
- $39,389
- Est. tax owed @ 24.0%
- −$9,453
- After-tax cash flow
- $27,604/yr
For passive investors: Depreciation is non-cash, so a rental often shows a tax loss while cash-flowing — sheltering income. Rental losses are passive: they offset passive income freely, and up to $25,000/yr can offset ordinary (W-2) income if you actively participate and your MAGI is under $100k (phasing out to $0 by $150k); unused losses carry forward. On sale, claimed depreciation is recaptured at up to 25%, and gains may owe capital-gains tax (a 1031 exchange can defer both). Figures are a year-1 estimate at your 24.0% rate — not tax advice; consult a CPA.
Schools (NCES district)
- District
- St. Louis City
- NCES district ID
- 2929280
- Math proficiency
- 10% ▼ -6.00%
- Reading proficiency
- 18% ▼ -3.00%
- Median HH income
- $35,685
- Composite
- 11.54/100
- National rank
- #9699
- State rank
- #312 of 324 in MO
Livability — St. Louis
No livability data for this city. (Only ~50 U.S. cities are tracked.)
Census & demographics
- Census place
- St. Louis, MO
- County
- Saint Louis City · 254,015 people
- City population
- 283,259
- Metro
- St. Louis, MO-IL
- Population (ZIP)
- 21,631
- Household income
- $75,757
- Rent vs Own
- Severe rent burden
- 653.0
Population outlook (St. Louis County) Hauer SSP2
- Today (2025)
- 315,737 people
- By 2030
- 313,865 · -0.6%
- By 2040
- 305,439 · -3.3%
- By 2050
- 296,529 · -6.1%
- By 2075
- 271,028 · -14.2%
- By 2100
- 255,359 · -19.1%
Race, ethnicity, and origin ACS 2023
- Neighborhood character
- Predominantly White (70%)
- Race & ethnicity
- White 70% Black 16% Two or more races 7% Hispanic / Latino 5% Asian 3%
- Hispanic origin (detail)
- Mexican 3%
- Common ancestry
- Lithuanian 4% Slovak 2% Romanian 2%
- Foreign-born
- 5% · Canada, China
- Languages at home
- 93% English-only · Spanish 2% Other Indo-European 1% German/W. Germanic 1%
Political lean MEDSL · St. Louis
- 2024 margin
- Solid D (+64.7) · D 81.4% · R 16.7% · Other 2.0%
- 2008→2024 swing
- -3.5pp toward R · 2008: 68.2pp · 2024: 64.7pp
- All cycles
- 2024: D+64.7 2020: D+66.2 2016: D+63.7 2012: D+66.6 2008: D+68.2
Not yet ingested
- Civics
- —
Market trends
- HPI YoY
- ▼ -277.54%
- Current HPI
- 256.7513
- Rent YoY
- ▲ 5.39%
- Metro
- St. Louis, MO-IL
- State GDP YoY
- ▲ 1.84%
- F500 in state
- 20
Industry mix (Fortune 500 HQ in MO)
| Industry | F500 HQs | Revenue |
|---|---|---|
| Healthcare | 1 | $163B |
|
||
| Insurance | 1 | $21B |
|
||
| Industrial Technology | 1 | $17B |
|
||
| Retail | 1 | $16B |
|
||
| Industrial Distribution | 1 | $10B |
|
||
| Utilities | 1 | $9B |
|
||
Cash-flow waterfall
monthlySold comps — $/sqft
last 12 mo · ≤1 miLoading sold comps…