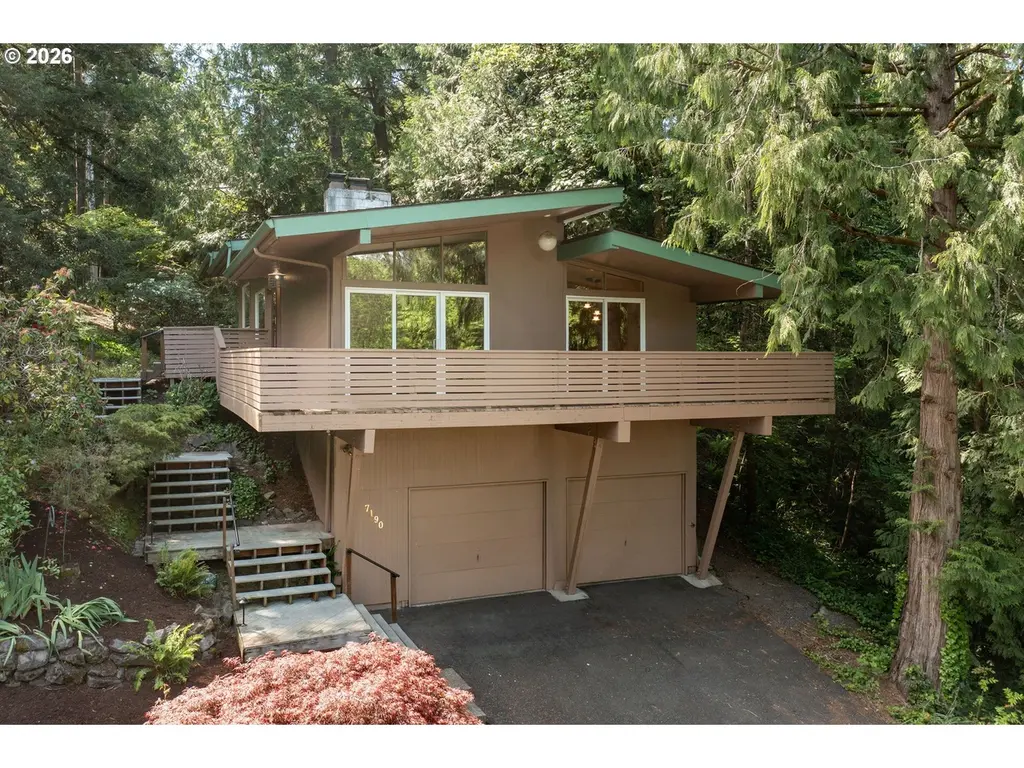
7190 SW Raleighwood Ln · Raleigh Hills, OR
Flood risk 5/10 · Moderate
- FEMA flood zone
- X (unshaded)
- Chance of flooding over 30 yrs
- 0.24%
- Est. flood insurance / yr
- $507 – $1,088
Fire risk 1/10 · Minimal
- Est. fire insurance / yr
- $498 – $926
Heat risk 3/10 · Minor
- Hot days now (above 91°F)
- 7 days/yr
- Hot days in 30 yrs
- 13 days/yr
Wind risk 1/10 · Minimal
- Chance of severe wind over 30 yrs
- —
Air-quality risk 9/10 · Severe
- Unhealthy air days now
- 12 days/yr
- Unhealthy air days in 30 yrs
- 12 days/yr
Risk factors via First Street. Map © Google.
Why this score? — see what drove the D grade
The composite is a weighted blend of 9 inputs, each scored 0–100. Each bar is that input's sub-score; the figure is the points it added to the 100-point composite (weight × sub-score).
- ARV discount +15.0/15.0
- Cash flow +7.4/30.0
- Schools +6.3/10.0
- Livability +4.5/5.0
- Rent growth +2.7/5.0
- Condition / age +2.5/5.0
- 1% rule +2.0/10.0
- DSCR +1.5/10.0
- Appreciation +0.0/10.0
$550,000
🖨 Deal sheet 📄 Offer letter ✓ Due diligence
Listing remarks
Mid-century modern home located in highly sought after Raleighwood. Set in nature, this home is located on quiet cul-de-sac and sits next to a tranquil creek. Dramatic vaulted ceilings in the living room with tall windows-plus an additional row of clear story windows. All bedrooms have vaulted ceilings. Bedrooms 2 & 3 have built-in floor to ceiling cabinetry/book shelves. The basement has it's own kitchenette and large bonus room, great for a pool table or create another bedroom. Large wraparound deck. Newer windows, furnace and AC. Unbeatable location — only minutes to Raleigh Park Elementary, Portland Golf Club and Parks & Tails. Don’t miss your chance to own a home
Key facts
- Kitchenette
- Built-in cabinetry
- Quiet cul-de-sac
Tags
Property features AI
Finance
- HOA & community: Not a senior community
Exterior
- Parking: Driveway; Attached 2-car garage
- Utilities: Public water; Public sewer; Electric service; Gas service
- Home design: Single-family residence (resale); Residential property; Property offers upper and lower level living areas; Built in 1966
- Construction: Concrete perimeter foundation and slab; Composition roof; Wood siding
- Exterior features: Composition roof; Wood siding; Deck; Tool shed; Creek on the property; Views of creek and trees; Lot on a cul-de-sac with trees and sloped areas; Paved road access
Interior
- Kitchen: Dishwasher; Free-standing gas range; Free-standing refrigerator; Pantry
- Bedrooms: Primary bedroom (upper level); 2nd bedroom (upper level); 3rd bedroom (upper level)
- Flooring: Hardwood; Vinyl; Wall-to-wall carpet
- Bathrooms: Three full bathrooms (one on main level, one on upper level, one on lower level)
- Heating & cooling: Forced air heating; Central air conditioning; Electric and gas utilities
- Interior features: Garage door opener; Hardwood floors; High ceilings; Vaulted ceilings; Laundry area; Washer and dryer included; Vinyl flooring; Wall-to-wall carpet; Two wood-burning fireplaces; Vinyl window frames; Finished full basement; Bonus room (lower level); Dining room (main level); Family room; Kitchen (main level); Living room (main level); Great room
- Laundry & utility: Washer and dryer included; Gas hot water
Neighborhood map
What this means for you Summary
Snapshot
- This is a 3-bed/3.0-bath single-family listed at $550k.
Deal economics
- At list price, monthly cash flow is $-721 ($-9k/yr) — negative.
- To cash-flow at today's rent, offer at most $423k (23.1% below list).
- To meet the 1% rule (rent ≥ 1% of price), the offer needs to be $383k (30.4% below list).
- Recommended offer: $383k (30.4% below list) — sets the bar for 1% rule.
Location & tenants
- Location reads 89/100 on livability (#6 in OR, #126 nationally) — a professional / high-income tenant draw. Strengths: crime A+, amenities A+, commute A+; Watch: cost of living F.
- Beaverton SD 48J (urban): math 68% / reading 76% proficiency, ranked #3 of 58 in OR (top 5%) — strong family-tenant draw, lease renewals of 3-5y typical.
- Zoned schools: Raleigh Park Elementary School (math 64% / reading 84%, grade A, #23 of 412 statewide, top 7%, 308 students, 45% FRL); Whitford Middle School (math 72% / reading 77%, grade A, #7 of 128 statewide, top 5%, 809 students, 56% FRL); Beaverton High School (1,483 students, 55% FRL) — zoned schools average 52% FRL vs 31% district-wide (20 pts higher); higher-poverty schools than district average — tighter screening recommended.
- Market conditions: Rents flat; 131 active listings in the ZIP; 5 comparable units currently listed for rent nearby; rentals leasing fast (median 2d on market — plan ~1-2 weeks tenant-placement turnaround); high-income renter base; 2,224 units permitted in Washington County in 2024 (242 in 5+ unit buildings).
- This rent runs 40% of the median local income ($115k/yr) — at the standard rent-burdened threshold; future hikes will face affordability resistance.
Forward outlook
- Local home prices are declining (-3.0%/yr); year-one equity from $4k of loan paydown is wiped out by about $16k of value loss. Plan a longer hold.
- Washington County population projected at +33% by 2050 — long-run rental-demand tailwind backs the buy-and-hold thesis.
Negotiation context
- It's been on market 16 days — a 2% lower offer ($542k) is reasonable based on typical stale-listing flexibility.
Risks & watch-outs
- Climate carrying-cost: moderate flood risk — expect insurance premiums to compound above CPI over the hold.
Questions for the listing agent
- What do current leases actually rent for vs. the listed asking? Can we see a recent rent roll and the last 12 months of T-12 income?
- Built in 1966 — when were the roof, HVAC, electrical panel, plumbing, and water heater last replaced?
- Is there a deadline driving the sale (1031 exchange, divorce, estate, relocation)? That informs how much negotiation room exists.
- Schools are A-rated — typically a magnet for longer-tenancy family renters. What's the average tenant stay here, and is there a school-zone premium baked into asking?
- The area grade is low — what's the realistic commute time and amenity access for the typical tenant pool here? Any planned neighborhood developments (good or bad) we should know about?
- What's the average days-on-market for RENTAL listings here right now (not sales)? A rising rental-DOM trend means longer vacancies and softer asking-rent achievability than the comps imply.
- What's the recent tenant-quality profile in this submarket — average credit score on applications, eviction rate, late-payment / NSF rate, and stable-employment percentage? A property-management company in the area should have these aggregated.
- How much new for-sale + rental construction is in the pipeline within 1–3 miles? Heavy new supply typically softens prices + rents 12–24 months out; constrained supply supports both.
Investment metrics
- 1% rule
- 0.70% ✗
- Cap rate
- 4.72%
- Cash-on-cash
- -5.62%
- DSCR
- 0.75
- GRM
- 12.0
CMA / ARV
- ARV (median comp)
- $857,583
- List price
- $550,000
- Delta
- -35.87%
- Verdict
- UNDERPRICED
- Comps
- 20 within 1.0 mi
Show comp detail 12 sales within ~0.75 mi
| Address | Dist | Beds/Ba | Sqft | Sold | Price | $/sf | Match |
|---|---|---|---|---|---|---|---|
| 7190 SW Raleighwood Ln | 0.00mi | 3/3.0 | 2,350 (0%) | 0mo | $575,000 | $245 | 100 |
| 7695 SW Brentwood St | 0.32mi | 3/2.0 | 2,432 (+4%) | 6mo | $1,054,796 | $434 | 70 |
| 8175 SW Fairway Dr | 0.49mi | 3/2.0 | 2,404 (+2%) | 2mo | $1,000,000 | $416 | 68 |
| 3185 SW 72nd Ave | 0.23mi | 4/3.0 (+1) | 2,628 (+12%) | 0mo | $1,130,000 | $430 | 64 |
| 6100 SW Thomas St | 0.55mi | 3/3.0 | 2,195 (-7%) | 1mo | $1,225,000 | $558 | 62 |
| 2600 SW Crestdale Dr | 0.52mi | 3/2.0 | 2,489 (+6%) | 1mo | $965,000 | $388 | 61 |
| 4420 SW Crestwood Dr | 0.69mi | 3/2.0 | 2,400 (+2%) | 5mo | $673,000 | $280 | 56 |
| 6741 SW Raleighwood Way | 0.24mi | 4/3.0 (+1) | 2,672 (+14%) | 7mo | $765,000 | $286 | 55 |
| 6810 SW Canyon Crest Dr | 0.71mi | 2/1.0 (-1) | 2,368 (+1%) | 0mo | $555,000 | $234 | 52 |
| 8401 SW Canyon Ln | 0.75mi | 4/3.0 (+1) | 2,496 (+6%) | 1mo | $725,000 | $290 | 49 |
| 8065 SW Laurel St | 0.52mi | 4/3.0 (+1) | 2,578 (+10%) | 8mo | $1,275,000 | $495 | 48 |
| 5745 SW Gaines Ct | 0.72mi | 4/3.0 (+1) | 2,676 (+14%) | 1mo | $1,050,000 | $392 | 38 |
Match score weights: distance 35% · size 25% · config 20% · recency 20%. Top-matched comps best support the ARV.
Projected returns pro-forma
-3.0% appreciation · 0.68% rent growth · sell at horizon
- IRR
- -28.5%
- Equity multiple
- 0.07×
- Total profit
- $-143,740
- Equity at exit
- $82,007
- IRR
- -39.6%
- Equity multiple
- -0.42×
- Total profit
- $-218,402
- Equity at exit
- $47,554
Cash invested: $154,000 (down + closing). Projections, not guarantees.
Landlord ↔ Tenant lean methodology
- Overall (STATE)
- 28 Tenant-Leaning
- State Oregon
- 28 Tenant-Leaning · D+6
- County
- — inherits STATE
- City
- — inherits STATE
ZIP-level market 97225
- Rents YoY
- 0.7%
- Active inventory
- 131
- Price-to-rent
- 12.0×
Monthly cashflow live
- Estimated rent
- $3,830 high interval (Pro) →
- Mortgage (P&I)
- −$2,884
- Tax from tax record
- −$633 /mo · $7,595/yr
- Insurance
- −$229
- HOA
- −$0
- Vacancy / Maint / Mgmt
- −$804
- Net cashflow
- $-721
Break-even live
UW: 25.0% down · 7.5% · 30yr · 1.5% tax · 5.0% vac · 8.0% maint · 8.0% mgmt
Financing live
Cash to close
- Down payment
- $137,500
- Closing costs
- $16,500
- Reserves months
- —
- Total cash needed
- —
Loan-product check · same deal, 3 products live
Conventional
25% down · 7.5% · 30yr
- Down + closing
- —
- Monthly P&I
- —
- Monthly cashflow
- —
- DSCR
- —
- Eligible?
- —
Personal DTI + credit; lowest rate.
DSCR
20% down · 8.5% · 30yr
- Down + closing
- —
- Monthly P&I
- —
- Monthly cashflow
- —
- DSCR
- —
- Eligible?
- —
No personal income docs; deal must DSCR.
Hard money
10% down · 12.0% · 12mo
- Down + closing
- —
- Monthly P&I
- —
- Monthly cashflow
- —
- DSCR
- —
- Eligible?
- —
Short-term bridge; refi at stabilization.
Rent comps 5 comps
| Address | Beds | Baths | Sqft | Rent | $/sqft | DOM | Units | Dist |
|---|---|---|---|---|---|---|---|---|
| 7780 SW Brentwood St Portland, OR | 4.0 | 3.5 | 2216 | $5,999 | $2.71 | 1d | 1 | 0.34mi |
| 8150 SW Birchwood Rd Portland, OR | 3.0 | 2.0 | 2797 | $4,895 | $1.75 | 1d | 1 | 0.45mi |
| 8205 SW Laurel St Portland, OR | 3.0 | 2.0 | 2080 | $3,295 | $1.58 | 10d | 1 | 0.55mi |
| 8205 SW Laurel St Portland, OR | 3.0 | 2.0 | 2080 | $3,295 | $1.58 | 1d | 1 | 0.55mi |
| 6550 SW Bucharest Ct Portland, OR | 4.0 | 3.0 | 3232 | $3,900 | $1.21 | 43d | 1 | 0.81mi |
Listing history 2 events
-
2026-05-11$600,000 Active 857-char remark
-
1990-09-07soldstatus $125,000
ⓘ Source: listings_history table (triggers on properties + properties_extension) + one-shot
backfill from property_details.listing_events for pre-trigger history.
Tax reassessment forecast OR · Resets to sale price
- Current annual tax
- $7,595 · $633/mo
- Projected year-2 tax
- $7,595 · $633/mo
- Expected delta
- $0/yr ($0/mo · 0.0%)
ⓘ Screening estimate from a state-policy table — verify with the county assessor before closing.
Climate risk First Street
- Flood 5/10 Major FEMA zone X (unshaded) · 24% chance over 30 yrs
- Wildfire 1/10 Low
- Heat 3/10 Moderate 7 d/yr ≥91°F today · 13 d/yr by 30 yrs out
- Wind 1/10 Low
- Air quality 9/10 Extreme 12 unhealthy d/yr today · 12 by 30 yrs out
Nearby sold comps map
Loading sold comps map…
Walkable amenities ~0.75 mi
Loading nearby amenities…
Taxation est. · year 1
- Rental income
- $45,959
- − Mortgage interest
- −$30,809
- − Property taxes
- −$7,595
- − Insurance
- −$2,750
- − Repairs & maintenance
- −$3,677
- − Management
- −$3,677
- − Depreciation
- −$16,000
- Taxable loss
- −$18,548
- Est. tax savings @ 24.0%
- +$4,452
- After-tax cash flow
- $-4,197/yr
For passive investors: Depreciation is non-cash, so a rental often shows a tax loss while cash-flowing — sheltering income. Rental losses are passive: they offset passive income freely, and up to $25,000/yr can offset ordinary (W-2) income if you actively participate and your MAGI is under $100k (phasing out to $0 by $150k); unused losses carry forward. On sale, claimed depreciation is recaptured at up to 25%, and gains may owe capital-gains tax (a 1031 exchange can defer both). Figures are a year-1 estimate at your 24.0% rate — not tax advice; consult a CPA.
Schools (NCES district)
- District
- Beaverton SD 48J
- NCES district ID
- 4101920
- Math proficiency
- 68% ▲ 14.00%
- Reading proficiency
- 76% ▲ 11.00%
- Median HH income
- $67,966
- Composite
- 62.72/100
- National rank
- #672
- State rank
- #3 of 58 in OR
Livability — Raleigh Hills
- Score
- 89/100
- State rank
- #6
- US rank
- #126
Category grades
Schools grade is shown separately in the Schools card above.
Census & demographics
- Census place
- Raleigh Hills, OR
- County
- Washington County · 583,254 people
- Metro
- Portland-Vancouver-Hillsboro, OR-WA
- Population (ZIP)
- 25,869
- Household income
- $114,598
- Rent vs Own
- Severe rent burden
- 1717.0
Population outlook (Washington County) Hauer SSP2
- Today (2025)
- 674,042 people
- By 2030
- 721,804 · +7.1%
- By 2040
- 812,732 · +20.6%
- By 2050
- 895,143 · +32.8%
- By 2075
- 1,058,806 · +57.1%
- By 2100
- 1,131,692 · +67.9%
Race, ethnicity, and origin ACS 2023
- Neighborhood character
- Predominantly White (77%)
- Race & ethnicity
- White 77% Hispanic / Latino 9% Two or more races 8% Asian 7% Black 2%
- Hispanic origin (detail)
- Mexican 7%
- Common ancestry
- Italian 6% Portuguese 4% Romanian 3%
- Foreign-born
- 9% · Canada, Vietnam, China
- Languages at home
- 89% English-only · Spanish 5% Other Indo-European 1% Vietnamese 1%
Political lean MEDSL · Washington
- 2024 margin
- Solid D (+34.0) · D 65.3% · R 31.3% · Other 3.4%
- 2008→2024 swing
- +11.8pp toward D · 2008: 22.1pp · 2024: 34.0pp
- All cycles
- 2024: D+34.0 2020: D+34.6 2016: D+26.7 2012: D+17.5 2008: D+22.1
Not yet ingested
- Civics
- —
Market trends
- HPI YoY
- ▼ -519.95%
- Current HPI
- 301.2247
- Rent YoY
- ▲ 0.68%
- Metro
- Portland-Vancouver-Hillsboro, OR-WA
- State GDP YoY
- ▲ 2.05%
- F500 in state
- 2
Industry mix (Fortune 500 HQ in OR)
| Industry | F500 HQs | Revenue |
|---|---|---|
| Consumer Goods | 1 | $51B |
|
||
Price history
+360.0% since first listed5 events — show timeline
- 2026-06-15 Sold (MLS) $575,000 RMLS
- 2026-05-27 Pending — RMLS
- 2026-05-20 Price Changed $550,000 RMLS
- 2026-05-11 Listed $600,000 RMLS
- 1990-09-07 Sold (Public Records) $125,000 Public Records
Property tax history
+4.1%/yrLatest (2025): $7,595 · +4.4% YoY. Source: county tax records.
Cash-flow waterfall
monthlySold comps — $/sqft
last 12 mo · ≤1 miLoading sold comps…