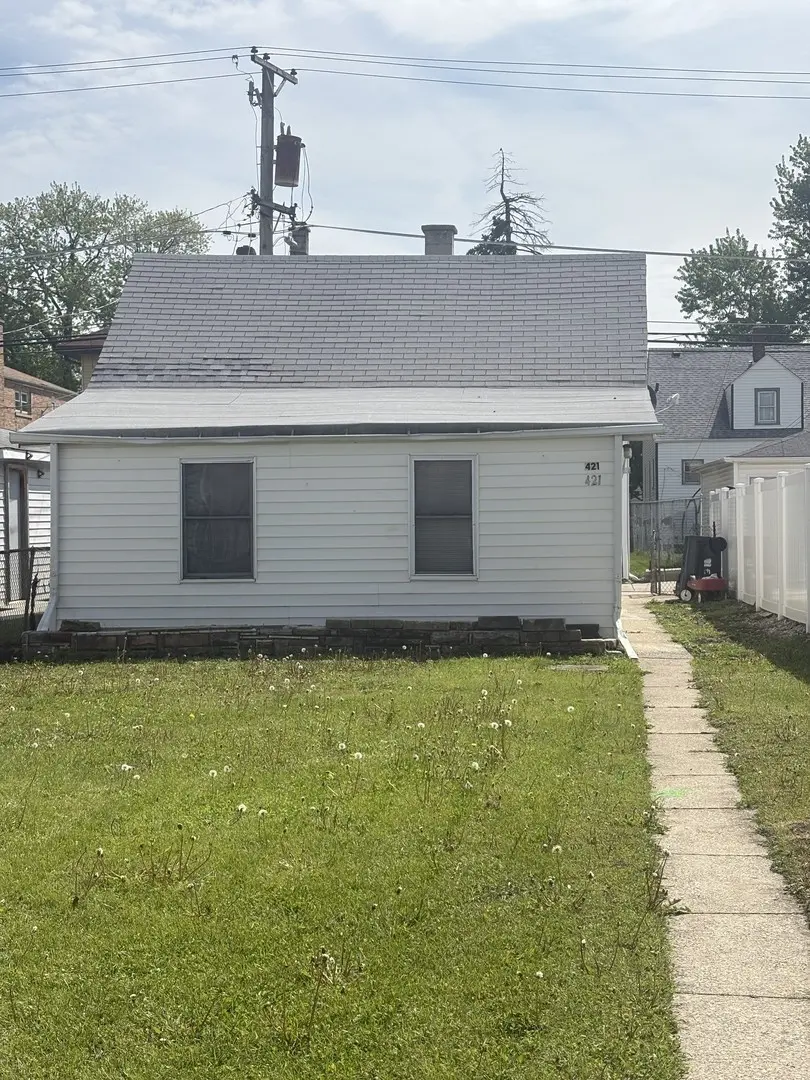
421 25th Ave · Bellwood, IL
Flood risk 4/10 · Minor
- FEMA flood zone
- X (unshaded)
- Chance of flooding over 30 yrs
- 0.22%
- Est. flood insurance / yr
- $473 – $860
Fire risk 1/10 · Minimal
- Est. fire insurance / yr
- $804 – $1,492
Heat risk 3/10 · Minor
- Hot days now (above 101°F)
- 7 days/yr
- Hot days in 30 yrs
- 14 days/yr
Wind risk 2/10 · Minimal
- Chance of severe wind over 30 yrs
- 1.0%
Air-quality risk 4/10 · Minor
- Unhealthy air days now
- 6 days/yr
- Unhealthy air days in 30 yrs
- 7 days/yr
Risk factors via First Street. Map © Google.
Why this score? — see what drove the C+ grade
The composite is a weighted blend of 9 inputs, each scored 0–100. Each bar is that input's sub-score; the figure is the points it added to the 100-point composite (weight × sub-score).
- Cash flow +30.0/30.0
- DSCR +10.0/10.0
- 1% rule +9.9/10.0
- Livability +3.9/5.0
- Rent growth +2.5/5.0
- Condition / age +2.5/5.0
- Schools +1.4/10.0
- ARV discount +0.0/15.0
- Appreciation +0.0/10.0
$99,900
🖨 Deal sheet 📄 Offer letter ✓ Due diligence
Listing remarks
Great investment opportunity! This home sits on a 30' x 125' fenced lot and features 1 bedroom plus additional rooms that offer flexible space for storage, office use, or expansion potential. Bring your ideas and transform this property into a solid rental investment or an affordable first home. Home does need work, but it's a fantastic value with plenty of upside. See Additional Information for the list of village requirements.
Key facts
- 3,750 sq ft lot
- Built 1925
- Listed 41 days
Property features AI
Finance
- HOA & community: No master association fee required
Exterior
- Parking: Off-alley parking and additional unspecified parking
- Utilities: Water source: Lake Michigan; Public sewer; Electric service with circuit breakers and 100 Amp service
- Home design: Detached single-family home; One-story layout; Property is over 100 years old; Built before 1978
- Construction: Vinyl siding; Asphalt roof
- Exterior features: Fenced lot; Lot dimensions about 30 x 125
Interior
- Kitchen: Kitchen with eating area/table space
- Bedrooms: One bedroom (main level); Additional attic space that could serve as extra bedroom or storage (second level)
- Flooring: Vinyl flooring in living areas, dining room, kitchen and master bedroom; Carpet in the attic
- Bathrooms: One full bathroom
- Heating & cooling: Natural gas forced-air heating; Window air conditioning units
- Interior features: Six total rooms
- Laundry & utility: Laundry room
Neighborhood map
What this means for you Summary
Snapshot
- This is a 2-bed/1.0-bath single-family listed at $100k.
Deal economics
- At list price, monthly cash flow is $487 ($6k/yr) — positive.
- The deal already cash-flows at list — no discount required.
- Meets the 1% rule at list price ($1k rent vs $100k).
- Recommended offer: $97k (3.0% below list) — sets the bar for market timing.
- Cap rate 12.1% vs local median 5.3% in Bellwood — top-decile yield for the area; either an underpriced asset or a hidden risk that comps aren't pricing in. Stress-test before assuming the spread holds.
Location & tenants
- Location reads 77/100 on livability (#155 in IL, #2,847 nationally) — a middle-class / working-renter tenant base. Strengths: commute A+, cost of living A+, housing A+; Watch: health & safety D+, amenities F.
- Proviso Twp Hsd 209 (suburban): math 12% / reading 17% proficiency, ranked #507 of 620 in IL (top 82%) — low school quality limits family demand, transient renter base, plan for 1-2y turnover.
- Zoned schools: Proviso East High School (math 4% / reading 6%, grade F, #614 of 693 statewide, top 95%, 1,658 students, 0% FRL).
- Market conditions: 41 active listings in the ZIP; 10 comparable units currently listed for rent nearby; rentals at typical pace (median 17d on market — plan ~3-4 weeks tenant-placement turnaround); 6,272 units permitted in Cook County in 2024 (4,658 in 5+ unit buildings).
Forward outlook
- Local home prices are declining (-3.0%/yr); year-one equity from $691 of loan paydown is wiped out by about $3k of value loss. Plan a longer hold.
- At projected returns (-3.0% appreciation + 3.0% rent growth), your $28k cash investment doubles in ~6 years — after that, you're playing with house money.
Negotiation context
- It's been on market 41 days — a 3% lower offer ($97k) is reasonable based on typical stale-listing flexibility.
- Current owner paid $25k; list at $100k implies a 300% gain — meaningful room to come down on a strong offer.
Risks & watch-outs
- Watch-outs: built in 1925 — expect roof / HVAC / electrical / plumbing capex.
Questions for the listing agent
- It's been on market 41 days. Have you received any prior offers? Is the seller open to a 3% concession, seller financing, or rate buy-down credit?
- Built in 1925 — when were the roof, HVAC, electrical panel, plumbing, and water heater last replaced?
- Is there a deadline driving the sale (1031 exchange, divorce, estate, relocation)? That informs how much negotiation room exists.
- Schools are F-rated, which usually means shorter tenancies and higher turnover. Who's the typical renter profile here, and what's been the actual vacancy rate?
- What's the average days-on-market for RENTAL listings here right now (not sales)? A rising rental-DOM trend means longer vacancies and softer asking-rent achievability than the comps imply.
- What's the recent tenant-quality profile in this submarket — average credit score on applications, eviction rate, late-payment / NSF rate, and stable-employment percentage? A property-management company in the area should have these aggregated.
- How much new for-sale + rental construction is in the pipeline within 1–3 miles? Heavy new supply typically softens prices + rents 12–24 months out; constrained supply supports both.
Investment metrics
- 1% rule
- 1.49% ✓
- Cap rate
- 12.15%
- Cash-on-cash
- 20.91%
- DSCR
- 1.93
- GRM
- 5.6
CMA / ARV
- ARV (on-the-fly)
- $70,680
- Comps found
- 1
Show comp detail 1 sale within ~0.75 mi
| Address | Dist | Beds/Ba | Sqft | Sold | Price | $/sf | Match |
|---|---|---|---|---|---|---|---|
| 147 N 21st Ave | 0.60mi | 2/1.0 | 613 (-1%) | 15mo | $70,000 | $114 | 58 |
Match score weights: distance 35% · size 25% · config 20% · recency 20%. Top-matched comps best support the ARV.
Projected returns pro-forma
-3.0% appreciation · 3.0% rent growth · sell at horizon
- IRR
- 13.3%
- Equity multiple
- 1.53×
- Total profit
- $14,880
- Equity at exit
- $14,895
- IRR
- 22.2%
- Equity multiple
- 2.90×
- Total profit
- $53,024
- Equity at exit
- $8,638
Cash invested: $27,972 (down + closing). Projections, not guarantees.
Landlord ↔ Tenant lean methodology
- Overall (STATE)
- 43 Moderately Tenant-Leaning
- State Illinois
- 43 Moderately Tenant-Leaning · D+7
- County
- — inherits STATE
- City
- — inherits STATE
ZIP-level market 60104
- Active inventory
- 41
- Price-to-rent
- 5.6×
Monthly cashflow live
- Estimated rent
- $1,491 high interval (Pro) →
- Mortgage (P&I)
- −$524
- Tax est. 1.5%
- −$125 /mo · $1,498/yr
- Insurance
- −$42
- HOA
- −$0
- Vacancy / Maint / Mgmt
- −$313
- Net cashflow
- $487
Break-even live
UW: 25.0% down · 7.5% · 30yr · 1.5% tax · 5.0% vac · 8.0% maint · 8.0% mgmt
Financing live
Cash to close
- Down payment
- $24,975
- Closing costs
- $2,997
- Reserves months
- —
- Total cash needed
- —
Loan-product check · same deal, 3 products live
Conventional
25% down · 7.5% · 30yr
- Down + closing
- —
- Monthly P&I
- —
- Monthly cashflow
- —
- DSCR
- —
- Eligible?
- —
Personal DTI + credit; lowest rate.
DSCR
20% down · 8.5% · 30yr
- Down + closing
- —
- Monthly P&I
- —
- Monthly cashflow
- —
- DSCR
- —
- Eligible?
- —
No personal income docs; deal must DSCR.
Hard money
10% down · 12.0% · 12mo
- Down + closing
- —
- Monthly P&I
- —
- Monthly cashflow
- —
- DSCR
- —
- Eligible?
- —
Short-term bridge; refi at stabilization.
Rent comps 10 comps
| Address | Beds | Baths | Sqft | Rent | $/sqft | DOM | Units | Dist |
|---|---|---|---|---|---|---|---|---|
| 323 22nd Ave Unit G Bellwood, IL | 2.0 | 1.0 | 750 | $1,750 | $2.33 | 24d | 1 | 0.20mi |
| 3108 Saint Charles Rd Unit 2B Bellwood, IL | 2.0 | 1.0 | 750 | $1,550 | $2.07 | 24d | 1 | 0.45mi |
| 3108 Saint Charles Rd Unit 1B Bellwood, IL | 1.0 | 1.0 | 650 | $1,250 | $1.92 | 2d | 1 | 0.45mi |
| 1500 N 22nd Ave Apt B2 Melrose Park, IL | 1.0 | 1.0 | 575 | $1,350 | $2.35 | 1d | 1 | 1.08mi |
| 1618 Division St Unit 3 Melrose Park, IL | 1.0 | 1.0 | 750 | $1,545 | $2.06 | 17d | 1 | 1.16mi |
| 1937 S 17th Ave Unit 1S Broadview, IL | 1.0 | 1.0 | 660 | $1,345 | $2.04 | 1d | 1 | 1.28mi |
| 903 S 5th Ave Apt 2C Maywood, IL | 1.0 | 1.0 | 585 | $1,100 | $1.88 | 22d | 1 | 1.31mi |
| 404 School St Maywood, IL | 2.0 | 1.0 | 737 | $1,565 | $2.12 | 1d | 1 | 1.34mi |
| 2112 S 17th Ave Apt L Broadview, IL | 1.0 | 1.0 | 535 | $1,215 | $2.27 | 1d | 1 | 1.45mi |
| 2320 W Roosevelt Rd Apt Gn Broadview, IL | 1.0 | 1.0 | 695 | $1,345 | $1.94 | 24d | 1 | 1.48mi |
Listing history 16 events
-
2026-06-18days on market $99,900 Active 41 DOM
-
2026-06-17days on market $99,900 Active 40 DOM
-
2026-06-16days on market $99,900 Active 39 DOM
-
2026-06-15days on market $99,900 Active 38 DOM
-
2026-06-13days on market $99,900 Active 36 DOM
-
2026-06-13days on market $99,900 Active 35 DOM
-
2026-06-09days on market $99,900 Active 32 DOM
-
2026-06-08days on market $99,900 Active 31 DOM
-
2026-06-07days on market $99,900 Active 30 DOM
-
2026-06-04days on market $99,900 Active 27 DOM
-
2026-06-03days on market $99,900 Active 26 DOM
-
2026-06-02days on market $99,900 Active 25 DOM
-
2026-06-01days on market $99,900 Active 24 DOM
-
2026-05-31days on market $99,900 Active 23 DOM
-
2026-05-08$124,900 Active
-
1998-10-09soldstatus $25,000
ⓘ Source: listings_history table (triggers on properties + properties_extension) + one-shot
backfill from property_details.listing_events for pre-trigger history.
Climate risk First Street
- Flood 4/10 Moderate FEMA zone X (unshaded) · 22% chance over 30 yrs
- Wildfire 1/10 Low
- Heat 3/10 Moderate 7 d/yr ≥101°F today · 14 d/yr by 30 yrs out
- Wind 2/10 Low 100% chance of damaging wind over 30 yrs
- Air quality 4/10 Moderate 6 unhealthy d/yr today · 7 by 30 yrs out
Nearby sold comps map
Loading sold comps map…
Walkable amenities ~0.75 mi
Loading nearby amenities…
Taxation est. · year 1
- Rental income
- $17,891
- − Mortgage interest
- −$5,596
- − Property taxes
- −$1,498
- − Insurance
- −$500
- − Repairs & maintenance
- −$1,431
- − Management
- −$1,431
- − Depreciation
- −$2,906
- Taxable income
- $4,528
- Est. tax owed @ 24.0%
- −$1,087
- After-tax cash flow
- $4,762/yr
For passive investors: Depreciation is non-cash, so a rental often shows a tax loss while cash-flowing — sheltering income. Rental losses are passive: they offset passive income freely, and up to $25,000/yr can offset ordinary (W-2) income if you actively participate and your MAGI is under $100k (phasing out to $0 by $150k); unused losses carry forward. On sale, claimed depreciation is recaptured at up to 25%, and gains may owe capital-gains tax (a 1031 exchange can defer both). Figures are a year-1 estimate at your 24.0% rate — not tax advice; consult a CPA.
Schools (NCES district)
- District
- Proviso Twp Hsd 209
- NCES district ID
- 1732910
- Math proficiency
- 12% ▼ -4.00%
- Reading proficiency
- 17% ▼ -3.00%
- Median HH income
- $51,744
- Composite
- 13.5/100
- National rank
- #9518
- State rank
- #507 of 620 in IL
Livability — Bellwood
- Score
- 77/100
- State rank
- #155
- US rank
- #2847
Category grades
Schools grade is shown separately in the Schools card above.
Census & demographics
- Census place
- Bellwood, IL
- City population
- 18,390
- Population (ZIP)
- 18,390
Population outlook (Cook County) Hauer SSP2
- Today (2025)
- 5,347,519 people
- By 2030
- 5,357,703 · +0.2%
- By 2040
- 5,324,924 · -0.4%
- By 2050
- 5,230,762 · -2.2%
- By 2075
- 4,785,735 · -10.5%
- By 2100
- 4,188,836 · -21.7%
Race, ethnicity, and origin ACS 2023
- Neighborhood character
- Predominantly Black (70%)
- Race & ethnicity
- Black 70% Hispanic / Latino 23% Two or more races 7% White 4% Asian 1%
- Hispanic origin (detail)
- Mexican 18% Puerto Rican 4%
- Common ancestry
- Romanian 1%
- Foreign-born
- 10% · Canada
- Languages at home
- 78% English-only · Spanish 20% Other Indo-European 1%
Political lean MEDSL · Cook
- 2024 margin
- Solid D (+42.0) · D 70.4% · R 28.4% · Other 1.2%
- 2008→2024 swing
- -11.4pp toward R · 2008: 53.4pp · 2024: 42.0pp
- All cycles
- 2024: D+42.0 2020: D+50.3 2016: D+53.0 2012: D+49.4 2008: D+53.4
Not yet ingested
- Civics
- —
Market trends
- HPI YoY
- ▼ -212.49%
- Current HPI
- 290.8215
- Rent YoY
- —
- Metro
- —
- State GDP YoY
- ▲ 1.59%
- F500 in state
- 60
Industry mix (Fortune 500 HQ in IL)
| Industry | F500 HQs | Revenue |
|---|---|---|
| Insurance | 4 | $201B |
|
||
| Consumer Goods | 4 | $87B |
|
||
| Industrial Machinery | 3 | $64B |
|
||
| Healthcare | 2 | $55B |
|
||
| Retail / Pharmacy | 1 | $148B |
|
||
| Agriculture / Food | 1 | $86B |
|
||
Price history
+399.6% since first listed2 events — show timeline
- 2026-05-08 Listed $124,900 MRED as Distributed by MLS Grid
- 1998-10-09 Sold (Public Records) $25,000 Public Records
Property tax history
+3.1%/yrLatest (2023): $5,869 · -4.3% YoY. Source: county tax records.
Cash-flow waterfall
monthlySold comps — $/sqft
last 12 mo · ≤1 miLoading sold comps…