 10-Plex
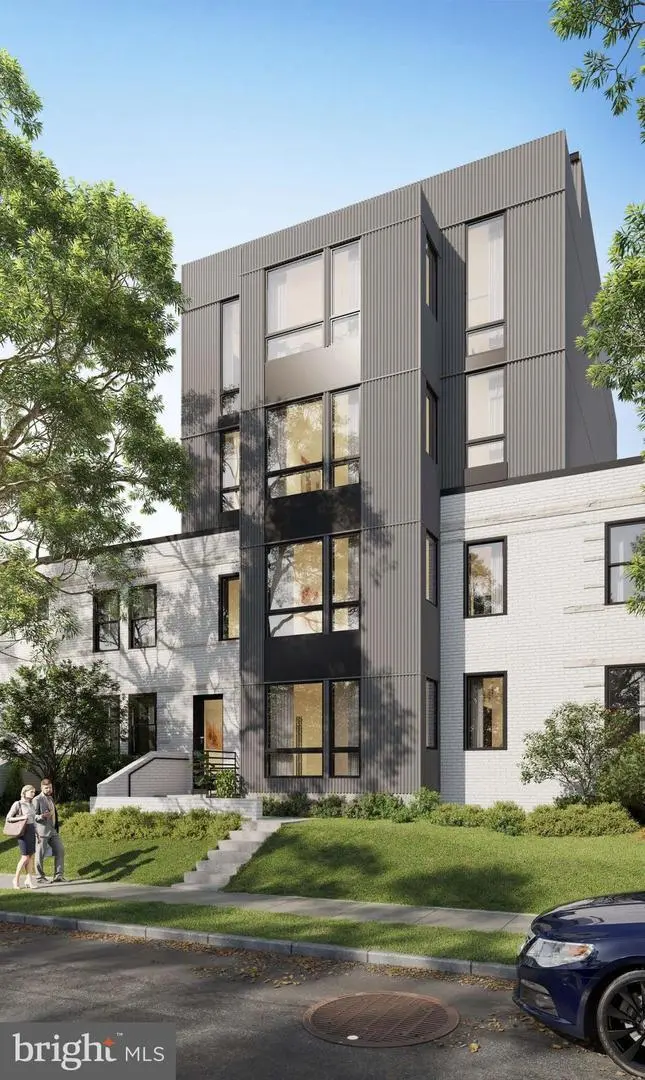
1938 I St NE · Washington, DC
Flood risk 1/10 · Minimal
- FEMA flood zone
- X (unshaded)
- Chance of flooding over 30 yrs
- 0.0%
- Est. flood insurance / yr
- $507 – $1,088
Fire risk 1/10 · Minimal
- Est. fire insurance / yr
- $631 – $1,173
Heat risk 7/10 · Major
- Hot days now (above 105°F)
- 7 days/yr
- Hot days in 30 yrs
- 15 days/yr
Wind risk 4/10 · Minor
- Chance of severe wind over 30 yrs
- 18.0%
Air-quality risk 4/10 · Minor
- Unhealthy air days now
- 4 days/yr
- Unhealthy air days in 30 yrs
- 5 days/yr
Risk factors via First Street. Map © Google.
Why this score? — see what drove the C+ grade
The composite is a weighted blend of 9 inputs, each scored 0–100. Each bar is that input's sub-score; the figure is the points it added to the 100-point composite (weight × sub-score).
- Cash flow +30.0/30.0
- 1% rule +10.0/10.0
- DSCR +10.0/10.0
- Livability +3.7/5.0
- Schools +3.6/10.0
- Condition / age +2.5/5.0
- Rent growth +1.7/5.0
- ARV discount +0.0/15.0
- Appreciation +0.0/10.0
$898,000
🖨 Deal sheet 📄 Offer letter ✓ Due diligence
Multi-family units
County records classify this as Multi-Family (2-4 Unit). Listing-text estimate: 10 units. estimate disagrees with records
Listing remarks
Some opportunities require vision. Others require timing. The rarest opportunities offer both, with nothing left standing between acquisition and execution. Introducing The Eastlight, a 10-unit boutique condominium development opportunity positioned just off the H Street Corridor, one of Washington’s most active growth corridors where residential demand, retail expansion, and long-term neighborhood investment continue to converge. This is not a concept or a pursuit. This is a fully realized development opportunity where the hard work has already been completed. Zoning is secured. Architectural plans are complete. Construction permits are approved. The path forward is clear for a devel
Key facts
- Nearby amenities
- H street corridor
- Zoning is secured
Tags
Property features AI
Exterior
- Parking: On-street parking
- Utilities: Public water; Public sewer
- Home design: Interior townhouse/rowhouse; Fee simple ownership
- Construction: Brick construction; Concrete perimeter foundation; Other foundation types noted; Above-grade and below-grade structures present; Finished above-grade area reported (assessor)
- Exterior features: Property is inside city limits; No tidal water on the lot; Soil type: Chillum-Urban Land Complex
Interior
- Bedrooms: Two 1-bedroom units; Six 2-bedroom units; Two 3-bedroom units; Additional identified units: Unit 1, Unit 2
- Heating & cooling: Hot water heating; Electric heating; Electric cooling
- Interior features: Multiple access exits (2+)
Neighborhood map
What this means for you Summary
Snapshot
- This is a 10 × 2-bed/?-bath units multifamily listed at $898k.
Deal economics
- At list price, monthly cash flow is $11k ($129k/yr) — positive. Per door: $1k/mo.
- The deal already cash-flows at list — no discount required.
- Meets the 1% rule at list price ($21k rent vs $898k).
- Recommended offer: $885k (1.5% below list) — sets the bar for market timing.
- Cap rate 20.7% vs local median 2.5% in Washington — top-decile yield for the area; either an underpriced asset or a hidden risk that comps aren't pricing in. Stress-test before assuming the spread holds.
Location & tenants
- Location reads 73/100 on livability (#1 in DC) — a middle-class / working-renter tenant base. Strengths: amenities A+, commute A+, employment A+; Watch: crime F, cost of living F.
- District Of Columbia Public Schools (urban): math 33% / reading 40% proficiency, ranked #8 of 32 in DC (top 25%) — families likely to look elsewhere, expect single-tenant / working-renter base with shorter leases; 65% free/reduced lunch — lower-income household profile, screen leases tightly.
- Market conditions: Rents falling (-3.0%/yr); 548 active listings in the ZIP; 40 comparable units currently listed for rent nearby; rentals at typical pace (median 24d on market — plan ~3-4 weeks tenant-placement turnaround); high-income renter base; 1,737 units permitted in District of Columbia in 2024 (1,506 in 5+ unit buildings).
- At $20,808/mo this rent would consume 207% of the median local household income ($120k/yr) (locally 3854% of renters already pay >50% of income on rent) — very limited rent-growth headroom before tenants either downsize or default.
Forward outlook
- Local home prices are declining (-3.0%/yr); year-one equity from $6k of loan paydown is wiped out by about $27k of value loss. Plan a longer hold.
- District of Columbia County population projected at +50% by 2050 — long-run rental-demand tailwind backs the buy-and-hold thesis.
- At projected returns (-3.0% appreciation + 0.0% rent growth), your $251k cash investment doubles in ~3 years — after that, you're playing with house money.
Negotiation context
- It's been on market 17 days — a 2% lower offer ($885k) is reasonable based on typical stale-listing flexibility.
- 17 sale attempts since 13y ago with the ask held roughly flat each time — persistent listings suggest the price (not the market) is what's stuck; bring a comps-based counter.
- Current owner paid $340k; list at $898k implies a 164% gain — meaningful room to come down on a strong offer.
Risks & watch-outs
- Watch-outs: built in 1942 — expect roof / HVAC / electrical / plumbing capex.
- Climate carrying-cost: extreme-heat days projected 7→15/yr by 2055 (HVAC capex compounding) — expect insurance premiums to compound above CPI over the hold.
Questions for the listing agent
- Can we see the unit-by-unit rent roll, current vacancy, and any below-market leases? What's the average tenancy length?
- What capital expenditures (roof, boiler, parking lot, exteriors) have been made in the last 5 years, and what's planned in the next 2?
- Built in 1942 — when were the roof, HVAC, electrical panel, plumbing, and water heater last replaced?
- Is there a deadline driving the sale (1031 exchange, divorce, estate, relocation)? That informs how much negotiation room exists.
- Crime grade is F in this area — have there been break-ins, vandalism, or insurance claims at this property in the last 3 years? What carrier currently insures it and at what premium?
- What's the average days-on-market for RENTAL listings here right now (not sales)? A rising rental-DOM trend means longer vacancies and softer asking-rent achievability than the comps imply.
- What's the recent tenant-quality profile in this submarket — average credit score on applications, eviction rate, late-payment / NSF rate, and stable-employment percentage? A property-management company in the area should have these aggregated.
- How much new apartment / multifamily construction is in the pipeline within 1–3 miles? Heavy new supply (>2% of stock underway) typically softens rents 12–24 months out; light construction supports rent growth.
Investment metrics
- 1% rule
- 2.32% ✓
- Cap rate
- 20.70%
- Cash-on-cash
- 51.44%
- DSCR
- 3.29
- GRM
- 3.6
CMA / ARV
- ARV (on-the-fly)
- $625,152
- Comps found
- 4
Show comp detail 4 sales within ~0.75 mi
| Address | Dist | Beds/Ba | Sqft | Sold | Price | $/sf | Match |
|---|---|---|---|---|---|---|---|
| 1711 H St NE | 0.26mi | 4/— | 2,442 (+3%) | 3mo | $645,000 | $264 | 80 |
| 1520-1524 Queen St NE | 0.38mi | 4/— | 2,442 (+3%) | 11mo | $814,000 | $333 | 67 |
| 1601 Holbrook St NE | 0.41mi | 4/4.0 | 2,720 (+15%) | 8mo | $685,000 | $252 | 49 |
| 212 21st St NE | 0.71mi | 5/— (+1) | 2,720 (+15%) | 15mo | $625,000 | $230 | 25 |
Match score weights: distance 35% · size 25% · config 20% · recency 20%. Top-matched comps best support the ARV.
Projected returns pro-forma
-3.0% appreciation · 0.0% rent growth · sell at horizon
- IRR
- 46.0%
- Equity multiple
- 2.91×
- Total profit
- $479,998
- Equity at exit
- $133,895
- IRR
- 50.5%
- Equity multiple
- 5.24×
- Total profit
- $1,066,217
- Equity at exit
- $77,643
Cash invested: $251,440 (down + closing). Projections, not guarantees.
Landlord ↔ Tenant lean methodology
- Overall (CITY)
- 0 Strongly Tenant-Friendly
- State District of Columbia
- 12 Strongly Tenant-Friendly · D+43
- County
- — inherits STATE
- City Washington
- 0 Strongly Tenant-Friendly · D+43
ZIP-level market 20002
- Rents YoY
- -3.0%
- Active inventory
- 548
- Price-to-rent
- 36.0×
Monthly cashflow live
- Estimated rent
- $20,808 high interval (Pro) →
- Mortgage (P&I)
- −$4,709
- Tax from tax record
- −$576 /mo · $6,912/yr
- Insurance
- −$374
- HOA
- −$0
- Vacancy / Maint / Mgmt
- −$4,370
- Net cashflow
- $10,779
Break-even live
10-unit breakdown (identical units grouped — click to expand)
| Units | Beds | Baths | Est. rent |
|---|---|---|---|
| 10× units | 2 | — | $20,810 |
| #1 | 2 | — | $2,081 |
| #2 | 2 | — | $2,081 |
| #3 | 2 | — | $2,081 |
| #4 | 2 | — | $2,081 |
| #5 | 2 | — | $2,081 |
| #6 | 2 | — | $2,081 |
| #7 | 2 | — | $2,081 |
| #8 | 2 | — | $2,081 |
| #9 | 2 | — | $2,081 |
| #10 | 2 | — | $2,081 |
| Total (10 units) | $20,808 | ||
UW: 25.0% down · 7.5% · 30yr · 1.5% tax · 5.0% vac · 8.0% maint · 8.0% mgmt
Financing live
Cash to close
- Down payment
- $224,500
- Closing costs
- $26,940
- Reserves months
- —
- Total cash needed
- —
Loan-product check · same deal, 3 products live
Conventional
25% down · 7.5% · 30yr
- Down + closing
- —
- Monthly P&I
- —
- Monthly cashflow
- —
- DSCR
- —
- Eligible?
- —
Personal DTI + credit; lowest rate.
DSCR
20% down · 8.5% · 30yr
- Down + closing
- —
- Monthly P&I
- —
- Monthly cashflow
- —
- DSCR
- —
- Eligible?
- —
No personal income docs; deal must DSCR.
Hard money
10% down · 12.0% · 12mo
- Down + closing
- —
- Monthly P&I
- —
- Monthly cashflow
- —
- DSCR
- —
- Eligible?
- —
Short-term bridge; refi at stabilization.
Rent comps 40 comps
| Address | Beds | Baths | Sqft | Rent | $/sqft | DOM | Units | Dist |
|---|---|---|---|---|---|---|---|---|
| 847 20th St NE Washington, DC | 4.0 | 2.5 | 1802 | $4,100 | $2.28 | 12d | 1 | 0.11mi |
| 847 20th St NE Washington, DC | 3.0 | 2.5 | 1802 | $4,100 | $2.28 | 15d | 1 | 0.11mi |
| 1006 18th St NE Washington, DC | 3.0 | 2.5 | 1684 | $3,095 | $1.84 | 24d | 1 | 0.18mi |
| 787 19th St NE Washington, DC | 3.0 | 1.5 | 1700 | $2,650 | $1.56 | 24d | 1 | 0.22mi |
| 1640 L St NE Washington, DC | 3.0 | 2.0 | 2300 | $3,700 | $1.61 | 18d | 1 | 0.29mi |
| 1609 Levis St NE Washington, DC | 4.0 | 4.5 | 2295 | $3,900 | $1.70 | 24d | 1 | 0.36mi |
| 525 21st St NE Washington, DC | 4.0 | 3.5 | 1890 | $3,545 | $1.88 | 17d | 1 | 0.43mi |
| 525 21st St NE Washington, DC | 4.0 | 3.5 | 1860 | $3,545 | $1.91 | 24d | 1 | 0.43mi |
| 1331 Queen St NE Washington, DC | 3.0 | 2.0 | 1708 | $4,600 | $2.69 | 14d | 1 | 0.48mi |
| 1331 Queen St NE Washington, DC | 3.0 | 2.0 | 1708 | $4,600 | $2.69 | 16d | 1 | 0.48mi |
| 2025 E St NE Unit 4 Washington, DC | 5.0 | 3.0 | 1936 | $6,593 | $3.41 | 24d | 1 | 0.49mi |
| 1213 Holbrook St NE #1 Washington, DC | 3.0 | 2.5 | 1618 | $3,850 | $2.38 | 18d | 1 | 0.51mi |
| 1638 Trinidad Ave NE #1 Washington, DC | 3.0 | 2.5 | 1780 | $5,950 | $3.34 | 18d | 1 | 0.56mi |
| 1620 E St NE #3 Washington, DC | 3.0 | 3.0 | 1620 | $3,999 | $2.47 | 7d | 1 | 0.57mi |
| 1255 Raum St NE Unit 1388282P Washington, DC | 2.0–8.0 | 1.0–5.0 | 3245 | $6,967 | $2.15 | 1d | 2 | 0.61mi |
| 1417 G St NE Washington, DC | 3.0 | 2.0 | 1982 | $3,700 | $1.87 | 18d | 1 | 0.61mi |
| 333 17th Pl NE Washington, DC | 3.0 | 1.5 | 2300 | $3,400 | $1.48 | 24d | 1 | 0.65mi |
| 1222 Owen Pl NE Washington, DC | 4.0 | 2.5 | 2164 | $3,800 | $1.76 | 24d | 1 | 0.67mi |
| 1324 H St NE Unit 2 Washington, DC | 4.0 | 1.5 | 2100 | $4,000 | $1.90 | 24d | 1 | 0.69mi |
| 1321 I St NE Washington, DC | 4.0 | 3.5 | 1809 | $4,600 | $2.54 | 24d | 1 | 0.69mi |
| 1724 C St NE Washington, DC | 3.0 | 2.5 | 2040 | $4,950 | $2.43 | 7d | 1 | 0.69mi |
| 221 20th St NE Unit 4 Washington, DC | 3.0 | 1.0 | 3360 | $2,999 | $0.89 | 24d | 1 | 0.71mi |
| 1714 Montello Ave NE Washington, DC | 4.0 | 3.0 | 2100 | $4,350 | $2.07 | 24d | 1 | 0.73mi |
| 1117 Montello Ave NE Washington, DC | 4.0 | 3.5 | 2260 | $4,500 | $1.99 | 24d | 1 | 0.79mi |
| 1916 W Virginia Ave NE Unit 2 Washington, DC | 3.0 | 2.0 | 1800 | $2,900 | $1.61 | 20d | 1 | 0.80mi |
| 1169 Morse St NE Washington, DC | 3.0 | 3.0 | 2274 | $4,250 | $1.87 | 3d | 1 | 0.83mi |
| 1414 C St NE Washington, DC | 4.0 | 2.5 | 1824 | $5,100 | $2.80 | 24d | 1 | 0.83mi |
| 1113 I St NE Washington, DC | 3.0 | 1.0 | 1800 | $3,325 | $1.85 | 24d | 1 | 0.87mi |
| 1495 Gallaudet St NE Unit 1495B Washington, DC | 3.0 | 2.5 | 1586 | $4,141 | $2.61 | 24d | 1 | 0.93mi |
| 1011 8th St NE Washington, DC | 3.0 | 2.5 | 1672 | $4,495 | $2.69 | 24d | 1 | 1.06mi |
| 721 K St NE Washington, DC | 3.0 | 1.0 | 1832 | $4,500 | $2.46 | 24d | 1 | 1.10mi |
| 223 17th St SE #2 Washington, DC | 3.0 | 2.5 | 1900 | $5,200 | $2.74 | 24d | 1 | 1.15mi |
| 1319 Massachusetts Ave SE Unit 1 Washington, DC | 3.0 | 3.0 | 1880 | $6,400 | $3.40 | 15d | 1 | 1.22mi |
| 1319 Massachusetts Ave SE Washington, DC | 3.0 | 3.0 | 2578 | $6,000 | $2.33 | 24d | 1 | 1.22mi |
| 2300 18th St NE #2300 Washington, DC | 4.0 | 3.0 | 1826 | $4,500 | $2.46 | 21d | 1 | 1.23mi |
| 237 15th St SE Unit 1 Washington, DC | 3.0 | 3.0 | 1938 | $4,500 | $2.32 | 24d | 1 | 1.26mi |
| 1209 6th St NE Unit A Washington, DC | 4.0 | 1.5 | 1648 | $3,400 | $2.06 | 24d | 1 | 1.27mi |
| 1825 Massachusetts Ave SE Washington, DC | 3.0 | 2.5 | 1957 | $4,000 | $2.04 | 24d | 1 | 1.28mi |
| 723 5th St NE Unit 630P Washington, DC | 3.0 | 3.0 | 3003 | $7,500 | $2.50 | 12d | 1 | 1.33mi |
| 329 16th St SE Washington, DC | 3.0 | 3.0 | 2000 | $4,800 | $2.40 | 24d | 1 | 1.33mi |
Listing history 50 events
-
2026-06-18days on market $898,000 Active 17 DOM
-
2026-06-17days on market $898,000 Active 16 DOM
-
2026-06-16days on market $898,000 Active 15 DOM
-
2026-06-15days on market $898,000 Active 14 DOM
-
2026-06-13days on market $898,000 Active 12 DOM
-
2026-06-09days on market $898,000 Active 8 DOM
-
2026-06-08days on market $898,000 Active 7 DOM
-
2026-06-07days on market $898,000 Active 6 DOM
-
2026-06-04days on market $898,000 Active 3 DOM
-
2026-06-03days on market $898,000 Active 2 DOM
-
2026-06-02days on market $898,000 Active 1 DOM
-
2026-05-31days on market $898,000 Active 81 DOM
-
2026-03-11$898,000 Active
-
2026-01-31historical
-
2026-01-15price $923,000
-
2025-11-04$924,000 Active
-
2025-10-31historical
-
2025-09-17price $924,000
-
2025-09-17status Active
-
2025-09-17historical
-
2025-07-24$950,000 Active
-
2025-04-23historical
-
2025-04-04historical
-
2025-04-04$999,000 Active
-
2025-03-19price $1,199,999
-
2025-03-19status Active
-
2025-03-19historical
-
2025-03-06price $1,199,000
-
2025-02-18price $1,249,000
-
2025-02-01$1,299,999 Active
-
2025-01-31historical
-
2025-01-23$1,299,999 Active
-
2025-01-23historical
-
2025-01-22status Active
-
2025-01-18historical Active Under Contract
-
2025-01-03historical
-
2025-01-03$1,299,999 Active
-
2024-12-12historical
-
2024-12-12$1,299,999 Active
-
2024-11-21historical
-
2024-11-21$1,299,999 Active
-
2024-11-08$1,299,999 Active
-
2014-02-03soldstatus $340,000
-
2014-01-31historical
-
2014-01-30soldstatus $340,000 Sold
-
2014-01-30soldstatus $340,000
-
2013-09-01status Contingent (No Kick Out)
-
2013-08-31historical
-
2013-08-28status Active
-
2013-04-12status Contingent (No Kick Out)
ⓘ Source: listings_history table (triggers on properties + properties_extension) + one-shot
backfill from property_details.listing_events for pre-trigger history.
Tax reassessment forecast DC · Partial reset (capped growth)
- Current annual tax
- $6,912 · $576/mo
- Projected year-2 tax
- $6,912 · $576/mo
- Expected delta
- $0/yr ($0/mo · 0.0%)
ⓘ Screening estimate from a state-policy table — verify with the county assessor before closing.
Climate risk First Street
- Flood 1/10 Low FEMA zone X (unshaded) · 0% chance over 30 yrs
- Wildfire 1/10 Low
- Heat 7/10 Severe 7 d/yr ≥105°F today · 15 d/yr by 30 yrs out
- Wind 4/10 Moderate 18% chance of damaging wind over 30 yrs
- Air quality 4/10 Moderate 4 unhealthy d/yr today · 5 by 30 yrs out
Nearby sold comps map
Loading sold comps map…
Walkable amenities ~0.75 mi
Loading nearby amenities…
Taxation est. · year 1
- Rental income
- $249,696
- − Mortgage interest
- −$50,302
- − Property taxes
- −$6,912
- − Insurance
- −$4,490
- − Repairs & maintenance
- −$19,976
- − Management
- −$19,976
- − Depreciation
- −$26,124
- Taxable income
- $121,917
- Est. tax owed @ 24.0%
- −$29,260
- After-tax cash flow
- $100,087/yr
For passive investors: Depreciation is non-cash, so a rental often shows a tax loss while cash-flowing — sheltering income. Rental losses are passive: they offset passive income freely, and up to $25,000/yr can offset ordinary (W-2) income if you actively participate and your MAGI is under $100k (phasing out to $0 by $150k); unused losses carry forward. On sale, claimed depreciation is recaptured at up to 25%, and gains may owe capital-gains tax (a 1031 exchange can defer both). Figures are a year-1 estimate at your 24.0% rate — not tax advice; consult a CPA.
Schools (NCES district)
- District
- District Of Columbia Public Schools
- NCES district ID
- 1100030
- Math proficiency
- 33% ▲ 3.00%
- Reading proficiency
- 40% ▲ 5.00%
- Median HH income
- $67,671
- Composite
- 35.84/100
- National rank
- #9606
- State rank
- #8 of 32 in DC
Livability — Washington
- Score
- 73/100
- State rank
- #1
- US rank
- #5327
Category grades
Schools grade is shown separately in the Schools card above.
Census & demographics
- Census place
- Washington, DC
- County
- District of Columbia · 671,873 people
- City population
- 671,873
- Metro
- Washington-Arlington-Alexandria, DC-VA-MD-WV
- Population (ZIP)
- 72,397
- Household income
- $120,337
- Rent vs Own
- Severe rent burden
- 3854.0
Population outlook (District of Columbia County) Hauer SSP2
- Today (2025)
- 821,926 people
- By 2030
- 899,517 · +9.4%
- By 2040
- 1,061,162 · +29.1%
- By 2050
- 1,231,493 · +49.8%
- By 2075
- 1,603,312 · +95.1%
- By 2100
- 1,847,141 · +124.7%
Race, ethnicity, and origin ACS 2023
- Neighborhood character
- Diverse neighborhood (Simpson 0.66)
- Race & ethnicity
- White 41% Black 40% Two or more races 9% Hispanic / Latino 9% Asian 3%
- Hispanic origin (detail)
- Mexican 2%
- Common ancestry
- Romanian 3% Lithuanian 2% Italian 2%
- Foreign-born
- 9% · Canada, China, South Korea
- Languages at home
- 87% English-only · Spanish 5% French/Haitian/Cajun 2% Other Indo-European 1%
Political lean MEDSL · District of Columbia
- 2024 margin
- Solid D (+86.1) · D 91.2% · R 5.1% · Other 3.8%
- 2008→2024 swing
- +0.1pp no change · 2008: 85.9pp · 2024: 86.1pp
- All cycles
- 2024: D+86.1 2020: D+86.8 2016: D+88.7 2012: D+84.2 2008: D+85.9
Not yet ingested
- Civics
- —
Market trends
- HPI YoY
- ▼ -852.61%
- Current HPI
- 396.6033
- Rent YoY
- ▼ -3.04%
- Metro
- Washington-Arlington-Alexandria, DC-VA-MD-WV
- State GDP YoY
- ▲ 1.33%
- F500 in state
- 6
Industry mix (Fortune 500 HQ in DC)
| Industry | F500 HQs | Revenue |
|---|---|---|
| Financial Services | 1 | $153B |
|
||
| Life Sciences / Industrials | 1 | $25B |
|
||
| Industrial Machinery | 1 | $8B |
|
||
Price history
+1448.3% since first listed44 events — show timeline
- 2026-03-11 Listed $898,000 BRIGHT MLS
- 2026-01-31 Listing Removed — BRIGHT MLS
- 2026-01-15 Price Changed $923,000 BRIGHT MLS
- 2025-11-04 Listed $924,000 BRIGHT MLS
- 2025-10-31 Listing Removed — BRIGHT MLS
- 2025-09-17 Price Changed $924,000 BRIGHT MLS
- 2025-09-17 Relisted — BRIGHT MLS
- 2025-09-17 Listing Removed — BRIGHT MLS
- 2025-07-24 Listed $950,000 BRIGHT MLS
- 2025-04-23 Listing Removed — BRIGHT MLS
- 2025-04-04 Listed $999,000 BRIGHT MLS
- 2025-04-04 Listing Removed — BRIGHT MLS
- 2025-03-19 Price Changed $1,199,999 BRIGHT MLS
- 2025-03-19 Relisted — BRIGHT MLS
- 2025-03-19 Listing Removed — BRIGHT MLS
- 2025-03-06 Price Changed $1,199,000 BRIGHT MLS
- 2025-02-18 Price Changed $1,249,000 BRIGHT MLS
- 2025-02-01 Listed $1,299,999 BRIGHT MLS
- 2025-01-31 Listing Removed — BRIGHT MLS
- 2025-01-23 Listing Removed — BRIGHT MLS
- 2025-01-23 Listed $1,299,999 BRIGHT MLS
- 2025-01-22 Relisted — BRIGHT MLS
- 2025-01-18 Contingent — BRIGHT MLS
- 2025-01-03 Listed $1,299,999 BRIGHT MLS
- 2025-01-03 Listing Removed — BRIGHT MLS
- 2024-12-12 Listed $1,299,999 BRIGHT MLS
- 2024-12-12 Listing Removed — BRIGHT MLS
- 2024-11-21 Listed $1,299,999 BRIGHT MLS
- 2024-11-21 Listing Removed — BRIGHT MLS
- 2024-11-08 Listed $1,299,999 BRIGHT MLS
- 2014-02-03 Sold (Public Records) $340,000 Public Records
- 2014-01-31 Delisted — MRIS
- 2014-01-30 Sold (MLS) $340,000 BRIGHT MLS
- 2014-01-30 Sold (MLS) $340,000 MRIS
- 2013-09-01 Pending — MRIS
- 2013-08-31 Listing Removed — BRIGHT MLS
- 2013-08-28 Relisted — MRIS
- 2013-04-12 Pending — MRIS
- 2013-03-29 Relisted — MRIS
- 2013-03-27 Delisted — MRIS
- 2013-03-26 Listed $336,000 MRIS
- 2013-03-26 Listed $336,000 BRIGHT MLS
- 2002-05-28 Sold (Public Records) $139,500 Public Records
- 2001-08-14 Sold (Public Records) $58,000 Public Records
Property tax history
+5.1%/yrLatest (2025): $6,912 · -1.2% YoY. Source: county tax records.
Cash-flow waterfall
monthlySold comps — $/sqft
last 12 mo · ≤1 miLoading sold comps…