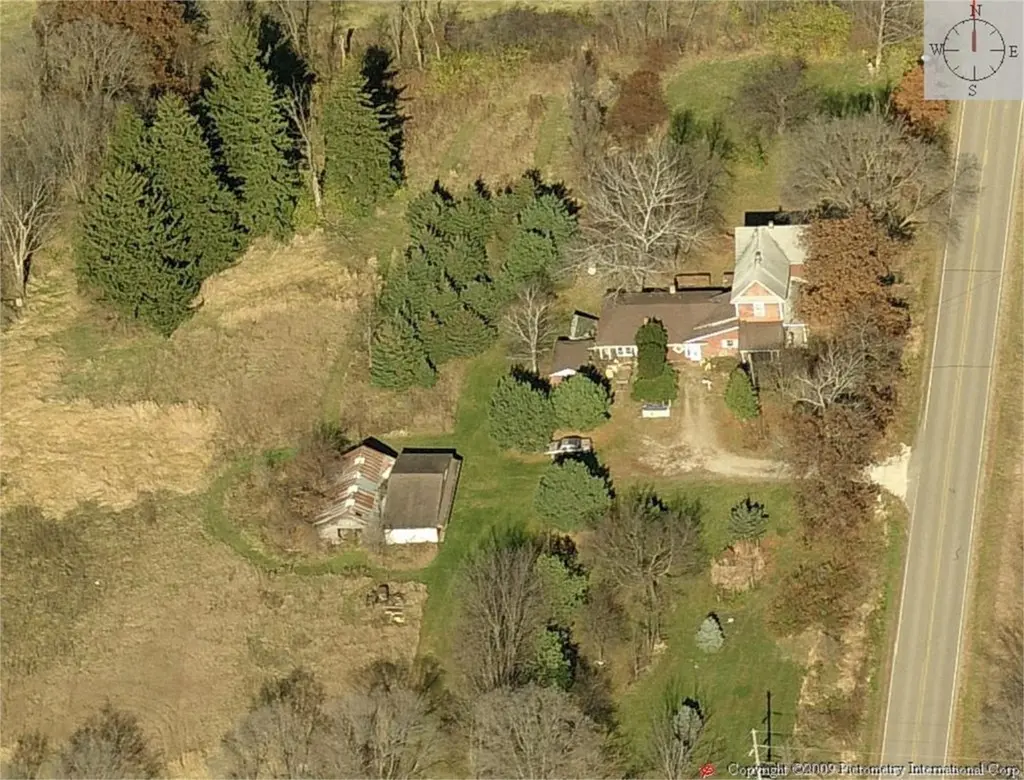
34017 Hwy D65 · Union, IA
Flood risk 1/10 · Minimal
- FEMA flood zone
- X (unshaded)
- Chance of flooding over 30 yrs
- 0.0%
- Est. flood insurance / yr
- $473 – $860
Fire risk 2/10 · Minimal
- Est. fire insurance / yr
- $902 – $1,676
Heat risk 2/10 · Minimal
- Hot days now (above 103°F)
- 7 days/yr
- Hot days in 30 yrs
- 15 days/yr
Wind risk 2/10 · Minimal
- Chance of severe wind over 30 yrs
- —
Air-quality risk 1/10 · Minimal
- Unhealthy air days now
- 0 days/yr
- Unhealthy air days in 30 yrs
- 0 days/yr
Risk factors via First Street. Map © Google.
Why this score? — see what drove the B+ grade
The composite is a weighted blend of 9 inputs, each scored 0–100. Each bar is that input's sub-score; the figure is the points it added to the 100-point composite (weight × sub-score).
- Cash flow +30.0/30.0
- 1% rule +10.0/10.0
- DSCR +10.0/10.0
- ARV discount +7.5/15.0
- Appreciation +6.4/10.0
- Schools +5.6/10.0
- Livability +3.4/5.0
- Rent growth +2.5/5.0
- Condition / age +2.5/5.0
$39,500
🖨 Deal sheet (PDF) 📄 Offer letter ✓ Due diligence
Listing remarks
Great opportunity for investor. Property has 1.5 acres, Beautiful Timber and close to Whitten, Eldora and Union!! This one won't last long.
Key facts
- Beautiful timber
- 1.5 acres
- 1.5 acre lot
Tags
Property features AI
Exterior
- Parking: Attached garage; Carport with 2 spaces
- Utilities: Private well water; Septic tank sewage
- Home design: Residential property; 2-story home; Property currently used for hunting
- Construction: Wood siding exterior; Asphalt roof
- Exterior features: Bluff and rolling slope lot; Gravel road access; Horses allowed on the property
Interior
- Bathrooms: One full bathroom
- Heating & cooling: Has heating (propane available); No central cooling
- Interior features: Basement is unfinished
Neighborhood map
What this means for you Summary
Snapshot
- This is a 3-bed/1.5-bath single-family listed at $40k.
Deal economics
- At list price, monthly cash flow is $482 ($6k/yr) — positive.
- The deal already cash-flows at list — no discount required.
- Meets the 1% rule at list price ($1k rent vs $40k).
Location & tenants
- Location reads 67/100 on livability (#472 in IA) — a middle-class / working-renter tenant base. Strengths: cost of living A+, housing A+; Watch: amenities F, commute F, health & safety D-.
- Bcluw Community School District (rural): math 60% / reading 70% proficiency, ranked #192 of 289 in IA (top 66%) — acceptable for families but not a draw, mixed tenant base, ~2y average lease.
- Zoned schools: Bcluw Elementary School (math 72% / reading 67%, grade A-, #224 of 616 statewide, top 42%, 179 students, 47% FRL); Bcluw Middle School (math 57% / reading 72%, grade A-, #157 of 246 statewide, top 67%, 150 students, 43% FRL); Bcluw High School (math 62% / reading 72%, grade B, #192 of 336 statewide, top 59%, 177 students, 31% FRL).
- Market conditions: 8 active listings in the ZIP; 6 units permitted in Hardin County in 2024 (0 in 5+ unit buildings).
Forward outlook
- In year one you build about $1k of equity ($273 loan paydown + $1k appreciation (2.7% local appreciation)).
- Hardin County population projected to shrink 6% by 2050 — rents likely to lag national; underwrite the cash flow, not the appreciation.
- At projected returns (2.7% appreciation + 3.0% rent growth), your $11k cash investment doubles in ~2 years — after that, you're playing with house money.
Negotiation context
- Only 2 days on market — expect competitive offers; lowballing is unlikely to land.
Risks & watch-outs
- Watch-outs: property tax is 2.9% of price; built in 1900 — expect roof / HVAC / electrical / plumbing capex.
Questions for the listing agent
- Built in 1900 — when were the roof, HVAC, electrical panel, plumbing, and water heater last replaced?
- Property tax is high relative to price — has the assessment been appealed recently, and will the sale trigger a re-assessment?
- Is there a deadline driving the sale (1031 exchange, divorce, estate, relocation)? That informs how much negotiation room exists.
- Schools are A-rated — typically a magnet for longer-tenancy family renters. What's the average tenant stay here, and is there a school-zone premium baked into asking?
- What's the average days-on-market for RENTAL listings here right now (not sales)? A rising rental-DOM trend means longer vacancies and softer asking-rent achievability than the comps imply.
- What's the recent tenant-quality profile in this submarket — average credit score on applications, eviction rate, late-payment / NSF rate, and stable-employment percentage? A property-management company in the area should have these aggregated.
- How much new for-sale + rental construction is in the pipeline within 1–3 miles? Heavy new supply typically softens prices + rents 12–24 months out; constrained supply supports both.
Investment metrics
- 1% rule
- 2.57% ✓
- Cap rate
- 20.95%
- Cash-on-cash
- 52.33%
- DSCR
- 3.33
- GRM
- 3.2
CMA / ARV
No comps found within radius.
Projected returns pro-forma
2.74% appreciation · 3.0% rent growth · sell at horizon
- IRR
- 57.1%
- Equity multiple
- 4.16×
- Total profit
- $34,988
- Equity at exit
- $17,194
- IRR
- 57.0%
- Equity multiple
- 8.44×
- Total profit
- $82,240
- Equity at exit
- $26,064
Cash invested: $11,060 (down + closing). Projections, not guarantees.
Landlord ↔ Tenant lean methodology
- Overall (STATE)
- 83 Strongly Landlord-Friendly
- State Iowa
- 83 Strongly Landlord-Friendly · R+6
- County
- — inherits STATE
- City
- — inherits STATE
ZIP-level market 50258
- Home prices YoY
- 2.7%
- Active inventory
- 8
- Price-to-rent
- 3.2×
Monthly cashflow live
- Estimated rent
- $1,016 medium interval (Pro) →
- Mortgage (P&I)
- −$207
- Tax from tax record
- −$97 /mo · $1,162/yr
- Insurance
- −$16
- HOA
- −$0
- Vacancy / Maint / Mgmt
- −$213
- Net cashflow
- $482
Break-even live
Sensitivity live
| Price | -10% $505 | -5% $493 | +0% $482 | +5% $471 | +10% $460 |
|---|---|---|---|---|---|
| Rent | -10% $402 | -5% $442 | +0% $482 | +5% $522 | +10% $563 |
| Rate | -1.0pp $502 | -0.5pp $492 | base $482 | +0.5pp $472 | +1.0pp $462 |
UW: 25.0% down · 7.5% · 30yr · 1.5% tax · 5.0% vac · 8.0% maint · 8.0% mgmt
Financing live
Cash to close
- Down payment
- $9,875
- Closing costs
- $1,185
- Reserves months
- —
- Total cash needed
- —
Loan-product check · same deal, 3 products live
Conventional
25% down · 7.5% · 30yr
- Down + closing
- —
- Monthly P&I
- —
- Monthly cashflow
- —
- DSCR
- —
- Eligible?
- —
Personal DTI + credit; lowest rate.
DSCR
20% down · 8.5% · 30yr
- Down + closing
- —
- Monthly P&I
- —
- Monthly cashflow
- —
- DSCR
- —
- Eligible?
- —
No personal income docs; deal must DSCR.
Hard money
10% down · 12.0% · 12mo
- Down + closing
- —
- Monthly P&I
- —
- Monthly cashflow
- —
- DSCR
- —
- Eligible?
- —
Short-term bridge; refi at stabilization.
Listing history 2 events
-
2026-06-12remarks 140-char remark
-
2026-06-12$39,500 Pending 2 DOM
ⓘ Source: listings_history table (triggers on properties + properties_extension) + one-shot
backfill from property_details.listing_events for pre-trigger history.
Tax reassessment forecast IA · Partial reset (capped growth)
- Current annual tax
- $1,162 · $97/mo
- Projected year-2 tax
- $1,162 · $97/mo
- Expected delta
- $0/yr ($0/mo · 0.0%)
ⓘ Screening estimate from a state-policy table — verify with the county assessor before closing.
Climate risk First Street
- Flood 1/10 Low FEMA zone X (unshaded) · 0% chance over 30 yrs
- Wildfire 2/10 Low
- Heat 2/10 Low 7 d/yr ≥103°F today · 15 d/yr by 30 yrs out
- Wind 2/10 Low
- Air quality 1/10 Low 0 unhealthy d/yr today · 0 by 30 yrs out
Nearby sold comps map
Loading sold comps map…
Walkable amenities ~0.75 mi
Loading nearby amenities…
Taxation est. · year 1
- Rental income
- $12,194
- − Mortgage interest
- −$2,213
- − Property taxes
- −$1,162
- − Insurance
- −$198
- − Repairs & maintenance
- −$975
- − Management
- −$975
- − Depreciation
- −$1,149
- Taxable income
- $5,521
- Est. tax owed @ 24.0%
- −$1,325
- After-tax cash flow
- $4,463/yr
For passive investors: Depreciation is non-cash, so a rental often shows a tax loss while cash-flowing — sheltering income. Rental losses are passive: they offset passive income freely, and up to $25,000/yr can offset ordinary (W-2) income if you actively participate and your MAGI is under $100k (phasing out to $0 by $150k); unused losses carry forward. On sale, claimed depreciation is recaptured at up to 25%, and gains may owe capital-gains tax (a 1031 exchange can defer both). Figures are a year-1 estimate at your 24.0% rate — not tax advice; consult a CPA.
Schools (NCES district)
- District
- Bcluw Community School District
- NCES district ID
- 1904440
- Math proficiency
- 60% ▼ -10.00%
- Reading proficiency
- 70% ▼ -2.00%
- Median HH income
- $53,760
- Composite
- 55.54/100
- National rank
- #1241
- State rank
- #192 of 289 in IA
Livability — Union
- Score
- 67/100
- State rank
- #472
- US rank
- #10373
Category grades
Schools grade is shown separately in the Schools card above.
Census & demographics
- Population (ZIP)
- 989
Population outlook (Hardin County) Hauer SSP2
- Today (2025)
- 17,474 people
- By 2030
- 17,369 · -0.6%
- By 2040
- 17,018 · -2.6%
- By 2050
- 16,454 · -5.8%
- By 2075
- 14,665 · -16.1%
- By 2100
- 12,404 · -29.0%
Race, ethnicity, and origin ACS 2023
- Neighborhood character
- Predominantly White (96%)
- Race & ethnicity
- White 96% Asian 3%
- Common ancestry
- Italian 15% Portuguese 6% German 4%
- Foreign-born
- 4% · South Korea, Canada
Political lean MEDSL · Hardin
- 2024 margin
- Solid R (+38.4) · D 30.3% · R 68.7% · Other 1.1%
- 2008→2024 swing
- -39.3pp toward R · 2008: 0.9pp · 2024: -38.4pp
- All cycles
- 2024: R+38.4 2020: R+32.0 2016: R+29.2 2012: R+7.1 2008: D+0.9
Not yet ingested
- Civics
- —
Market trends
- HPI YoY
- ▲ 2.74%
- Current HPI
- 104.0413
- Rent YoY
- —
- Metro
- —
- State GDP YoY
- ▲ 2.48%
- F500 in state
- 4
Industry mix (Fortune 500 HQ in IA)
| Industry | F500 HQs | Revenue |
|---|---|---|
| Financial Services | 1 | $16B |
|
||
| Retail / Convenience | 1 | $15B |
|
||
Price history
2 events — show timeline
- 2026-06-11 Pending — NEIRBR as distributed by MLS GRID
- 2026-06-07 Listed $39,500 NEIRBR as distributed by MLS GRID
Property tax history
+2.7%/yrLatest (2018): $1,162 · +3.0% YoY. Source: county tax records.
Cash-flow waterfall
monthlySold comps — $/sqft
last 12 mo · ≤1 miLoading sold comps…