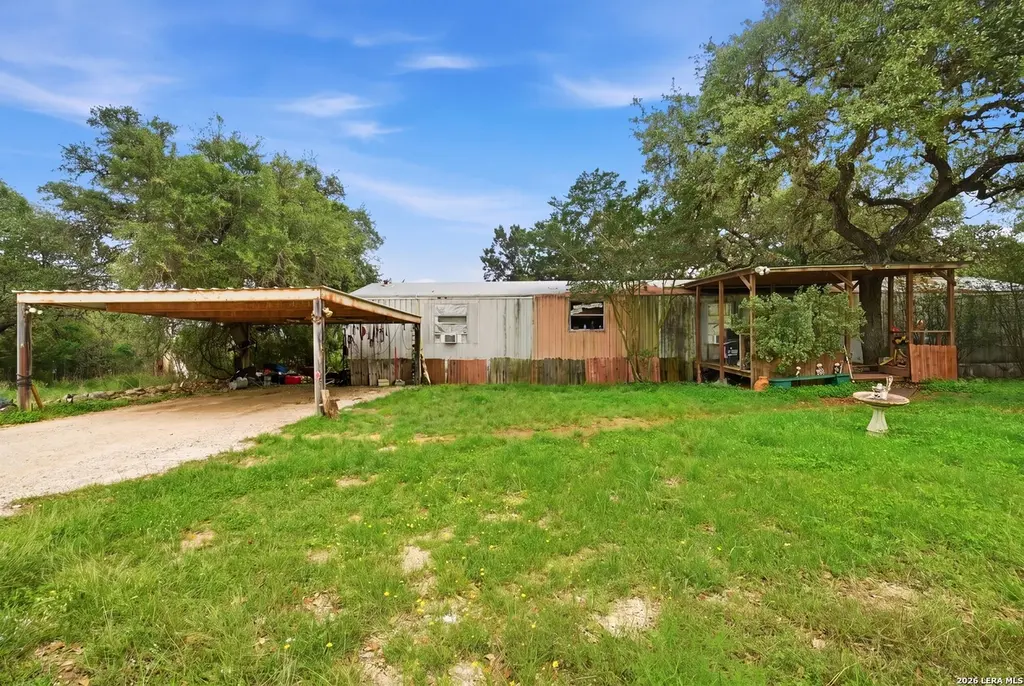
329 Westminister Sq · Canyon Lake, TX
Flood risk 1/10 · Minimal
- FEMA flood zone
- X (unshaded)
- Chance of flooding over 30 yrs
- 0.0%
- Est. flood insurance / yr
- $507 – $1,088
Fire risk 4/10 · Minor
- Est. fire insurance / yr
- $1,222 – $2,270
Heat risk 8/10 · Major
- Hot days now (above 105°F)
- 7 days/yr
- Hot days in 30 yrs
- 22 days/yr
Wind risk 6/10 · Moderate
- Chance of severe wind over 30 yrs
- 73.0%
Air-quality risk 2/10 · Minimal
- Unhealthy air days now
- 0 days/yr
- Unhealthy air days in 30 yrs
- 1 days/yr
Risk factors via First Street. Map © Google.
Why this score? — see what drove the B grade
The composite is a weighted blend of 9 inputs, each scored 0–100. Each bar is that input's sub-score; the figure is the points it added to the 100-point composite (weight × sub-score).
- Cash flow +30.0/30.0
- 1% rule +10.0/10.0
- DSCR +10.0/10.0
- ARV discount +7.5/15.0
- Schools +5.2/10.0
- Livability +3.4/5.0
- Condition / age +2.5/5.0
- Rent growth +2.2/5.0
- Appreciation +0.0/10.0
$55,000
🖨 Deal sheet 📄 Offer letter ✓ Due diligence
Listing remarks MLS
Move in ready home in well established neighborhood minutes from boat ramps 6, 7 & 8 & Cranes Mill Marina. Refrigerator, microwave & W/D convey with sale. AC & furnace replaced in 2010. Very nice hill views & beautiful oaks & fruit trees adorn the landscaping. Two storage buildings in back were used for workshops & have power. Fire pit in backyard as well as horseshoe game pits for outdoor gatherings. Central to San Antonio, Austin & Hill Country attractions.
Key facts
- Half-acre lot
- 0.5 acre lot
- 2 garage spots
Tags
Property features AI
Finance
- Financial info: Down payment resources available
- HOA & community: Subdivision legal name: ROLLING HILLS ESTATES 3
Exterior
- Parking: 2-car garage
- Utilities: Septic system
- Home design: Pre-owned single-family home; Approximately 33 years old
- Construction: Wood exterior construction; Metal roof
- Exterior features: Wood exterior; Metal roof; Located in the Rolling Hills subdivision
Interior
- Kitchen: Kitchen (approx. 10 x 12); Stove/Range
- Bedrooms: Master bedroom on lower level (approx. 6 x 16); Bedroom 2 (approx. 10 x 16); Bedroom 3 (approx. 12 x 9)
- Flooring: Wood flooring; Vinyl flooring
- Bathrooms: Two full bathrooms; Master bath with separate tub and shower (approx. 13 x 16)
- Heating & cooling: Central heating (electric); Central air conditioning; Multiple window A/C units (3+)
- Interior features: Ceiling fans; Washer and dryer connections; Stove/Range included; One living area; All window coverings remain; Accessible/adaptive home; Bathroom on first floor; Bedroom on first floor; No carpet
- Laundry & utility: Washer connection; Dryer connection
Neighborhood map
What this means for you Summary
Snapshot
- This is a 3-bed/2.0-bath manufactured listed at $55k.
Deal economics
- At list price, monthly cash flow is $976 ($12k/yr) — positive.
- The deal already cash-flows at list — no discount required.
- Meets the 1% rule at list price ($2k rent vs $55k).
- Recommended offer: $53k (3.0% below list) — sets the bar for market timing.
- Cap rate 27.6% vs local median 2.3% in Canyon Lake — top-decile yield for the area; either an underpriced asset or a hidden risk that comps aren't pricing in. Stress-test before assuming the spread holds.
Location & tenants
- Location reads 67/100 on livability (#534 in TX) — a middle-class / working-renter tenant base. Strengths: employment A+, housing A+, cost of living A; Watch: schools C-, amenities F, commute F.
- Comal ISD (rural): math 57% / reading 59% proficiency, ranked #58 of 826 in TX (top 7%) — acceptable for families but not a draw, mixed tenant base, ~2y average lease.
- Market conditions: Rents soft (-1.2%/yr); 1014 active listings in the ZIP; 12 comparable units currently listed for rent nearby; rentals lingering (median 44d on market — plan ~5-8 weeks vacancy on turnover, expect pricing pressure); 58% of comp listings sitting > 30 days — soft ceiling on asking rent; solid renter incomes; 3,420 units permitted in Comal County in 2024 (1,164 in 5+ unit buildings).
Forward outlook
- Local home prices are declining (-3.0%/yr); year-one equity from $380 of loan paydown is wiped out by about $2k of value loss. Plan a longer hold.
- Comal County population projected at +70% by 2050 — long-run rental-demand tailwind backs the buy-and-hold thesis.
- At projected returns (-3.0% appreciation + 0.0% rent growth), your $15k cash investment doubles in ~2 years — after that, you're playing with house money.
Negotiation context
- It's been on market 32 days — a 3% lower offer ($53k) is reasonable based on typical stale-listing flexibility.
- 3 sale attempts since 14y ago; this cycle's ask has dropped $10k (15%) from the opening price — seller is motivated, your offer sets the floor, not the list.
Risks & watch-outs
- Climate carrying-cost: major wind risk, 73% chance of damaging wind over 30y; extreme-heat days projected 7→22/yr by 2055 (HVAC capex compounding) — expect insurance premiums to compound above CPI over the hold.
Questions for the listing agent
- It's been on market 32 days. Have you received any prior offers? Is the seller open to a 3% concession, seller financing, or rate buy-down credit?
- Is there a deadline driving the sale (1031 exchange, divorce, estate, relocation)? That informs how much negotiation room exists.
- What's the average days-on-market for RENTAL listings here right now (not sales)? A rising rental-DOM trend means longer vacancies and softer asking-rent achievability than the comps imply.
- What's the recent tenant-quality profile in this submarket — average credit score on applications, eviction rate, late-payment / NSF rate, and stable-employment percentage? A property-management company in the area should have these aggregated.
- How much new for-sale + rental construction is in the pipeline within 1–3 miles? Heavy new supply typically softens prices + rents 12–24 months out; constrained supply supports both.
Investment metrics
- 1% rule
- 3.12% ✓
- Cap rate
- 27.59%
- Cash-on-cash
- 76.05%
- DSCR
- 4.38
- GRM
- 2.7
CMA / ARV
- ARV (median comp)
- $185,870
- List price
- $55,000
- Delta
- -70.41%
- Verdict
- UNDERPRICED
- Comps
- 6 within 1.0 mi
Show comp detail 5 sales within ~0.75 mi
| Address | Dist | Beds/Ba | Sqft | Sold | Price | $/sf | Match |
|---|---|---|---|---|---|---|---|
| 4508 Chamberlain Way | 0.26mi | 3/2.0 | 1,216 (0%) | 20mo | $65,000 | $53 | 72 |
| 1154 Hidden Fawn | 0.51mi | 3/2.0 | 1,140 (-6%) | 6mo | $190,000 | $167 | 60 |
| 442 Buckhorn Dr | 0.66mi | 3/2.0 | 1,232 (+1%) | 12mo | $95,000 | $77 | 56 |
| 220 Sir Arthur Way | 0.22mi | 2/2.0 (-1) | 1,056 (-13%) | 22mo | $149,500 | $142 | 45 |
| 706 Flintstone Dr | 0.61mi | 3/2.0 | 1,064 (-12%) | 16mo | $60,000 | $56 | 38 |
Match score weights: distance 35% · size 25% · config 20% · recency 20%. Top-matched comps best support the ARV.
Projected returns pro-forma
-3.0% appreciation · 0.0% rent growth · sell at horizon
- IRR
- 72.6%
- Equity multiple
- 4.13×
- Total profit
- $48,246
- Equity at exit
- $8,201
- IRR
- 75.6%
- Equity multiple
- 7.67×
- Total profit
- $102,725
- Equity at exit
- $4,755
Cash invested: $15,400 (down + closing). Projections, not guarantees.
Landlord ↔ Tenant lean methodology
- Overall (STATE)
- 87 Strongly Landlord-Friendly
- State Texas
- 87 Strongly Landlord-Friendly · R+5
- County
- — inherits STATE
- City
- — inherits STATE
ZIP-level market 78133
- Home prices YoY
- -33.8%
- Rents YoY
- -1.2%
- Active inventory
- 1014
- Price-to-rent
- 2.7×
Monthly cashflow live
- Estimated rent
- $1,716 high interval (Pro) →
- Mortgage (P&I)
- −$288
- Tax from tax record
- −$68 /mo · $819/yr
- Insurance
- −$23
- HOA
- −$0
- Vacancy / Maint / Mgmt
- −$360
- Net cashflow
- $976
Break-even live
UW: 25.0% down · 7.5% · 30yr · 1.5% tax · 5.0% vac · 8.0% maint · 8.0% mgmt
Financing live
Cash to close
- Down payment
- $13,750
- Closing costs
- $1,650
- Reserves months
- —
- Total cash needed
- —
Loan-product check · same deal, 3 products live
Conventional
25% down · 7.5% · 30yr
- Down + closing
- —
- Monthly P&I
- —
- Monthly cashflow
- —
- DSCR
- —
- Eligible?
- —
Personal DTI + credit; lowest rate.
DSCR
20% down · 8.5% · 30yr
- Down + closing
- —
- Monthly P&I
- —
- Monthly cashflow
- —
- DSCR
- —
- Eligible?
- —
No personal income docs; deal must DSCR.
Hard money
10% down · 12.0% · 12mo
- Down + closing
- —
- Monthly P&I
- —
- Monthly cashflow
- —
- DSCR
- —
- Eligible?
- —
Short-term bridge; refi at stabilization.
Rent comps 12 comps
| Address | Beds | Baths | Sqft | Rent | $/sqft | DOM | Units | Dist |
|---|---|---|---|---|---|---|---|---|
| 252 Sir Winston Dr Canyon Lake, TX | 3.0 | 2.0 | 1288 | $1,495 | $1.16 | 43d | 1 | 0.18mi |
| 507 Scenic Run Canyon Lake, TX | 3.0 | 2.0 | 1276 | $1,650 | $1.29 | 43d | 1 | 0.48mi |
| 127 Quail Run St Canyon Lake, TX | 3.0 | 2.0 | 940 | $1,400 | $1.49 | 43d | 1 | 0.98mi |
| 532 Grandview Bnd Canyon Lake, TX | 3.0 | 2.0 | 1344 | $1,450 | $1.08 | 20d | 1 | 1.04mi |
| 270 Ridgerock Dr Canyon Lake, TX | 3.0 | 2.0 | 900 | $1,600 | $1.78 | 43d | 1 | 1.07mi |
| 324 Ridgerock Dr Unit 1 Canyon Lake, TX | 2.0 | 2.0 | 1050 | $1,450 | $1.38 | 23d | 1 | 1.10mi |
| 1015 Twin Deer Ln Canyon Lake, TX | 3.0 | 1.0 | 1470 | $1,895 | $1.29 | 23d | 1 | 1.18mi |
| 1015 Twin Deer Ln Canyon Lake, TX | 3.0 | 2.0 | 1470 | $1,995 | $1.36 | 43d | 1 | 1.18mi |
| 371 Cloud Top Unit 1351233P Canyon Lake, TX | 2.0 | 2.0 | 957 | $4,021 | $4.20 | 16d | 1 | 1.19mi |
| 634 Flatrock Dr Canyon Lake, TX | 3.0 | 2.0 | 1250 | $2,400 | $1.92 | 43d | 1 | 1.41mi |
| 668 Creekside Dr Canyon Lake, TX | 2.0 | 2.0 | 980 | $1,225 | $1.25 | 43d | 1 | 1.47mi |
| 1475 Bonnyview Dr Canyon Lake, TX | 3.0 | 2.0 | 1320 | $1,800 | $1.36 | 23d | 1 | 1.49mi |
Listing history 11 events
-
2026-06-02status $55,000 Pending 32 DOM
-
2026-06-01days on market $55,000 Active Option 32 DOM
-
2026-05-31days on market $55,000 Active Option 31 DOM
-
2026-05-16price $55,000 671-char remark
-
2026-04-30$65,000 New 671-char remark
-
2013-02-27soldstatus
-
2013-02-22soldstatus 495-char remark
Show marketing remark (512 chars)
Move in ready home in well established neighborhood minutes from boat ramps 6, 7 & 8 & Cranes Mill Marina. Refrigerator, microwave & W/ D convey with sale. AC & furnace replaced in 2010. Very nice hill views & beautiful oaks & fruit trees adorn the landscaping. Two storage buildings in back were used for workshops & have power. Fire pit in backyard as well as horseshoe game pits for outdoor gatherings. Central to San Antonio, Austin & Hill Country attractions.
-
2013-02-22soldstatus $45,000
Show marketing remark (512 chars)
Move in ready home in well established neighborhood minutes from boat ramps 6, 7 & 8 & Cranes Mill Marina. Refrigerator, microwave & W/ D convey with sale. AC & furnace replaced in 2010. Very nice hill views & beautiful oaks & fruit trees adorn the landscaping. Two storage buildings in back were used for workshops & have power. Fire pit in backyard as well as horseshoe game pits for outdoor gatherings. Central to San Antonio, Austin & Hill Country attractions.
-
2013-01-10historical 495-char remark
Show marketing remark (495 chars)
Move in ready home in well established neighborhood minutes from boat ramps 6, 7 & 8 & Cranes Mill Marina. Refrigerator, microwave & W/D convey with sale. AC & furnace replaced in 2010. Very nice hill views & beautiful oaks & fruit trees adorn the landscaping. Two storage buildings in back were used for workshops & have power. Fire pit in backyard as well as horseshoe game pits for outdoor gatherings. Central to San Antonio, Austin & Hill Country attractions.
-
2012-10-01$52,500 495-char remark
Show marketing remark (512 chars)
Move in ready home in well established neighborhood minutes from boat ramps 6, 7 & 8 & Cranes Mill Marina. Refrigerator, microwave & W/ D convey with sale. AC & furnace replaced in 2010. Very nice hill views & beautiful oaks & fruit trees adorn the landscaping. Two storage buildings in back were used for workshops & have power. Fire pit in backyard as well as horseshoe game pits for outdoor gatherings. Central to San Antonio, Austin & Hill Country attractions.
-
2012-10-01$52,500
Show marketing remark (512 chars)
Move in ready home in well established neighborhood minutes from boat ramps 6, 7 & 8 & Cranes Mill Marina. Refrigerator, microwave & W/ D convey with sale. AC & furnace replaced in 2010. Very nice hill views & beautiful oaks & fruit trees adorn the landscaping. Two storage buildings in back were used for workshops & have power. Fire pit in backyard as well as horseshoe game pits for outdoor gatherings. Central to San Antonio, Austin & Hill Country attractions.
ⓘ Source: listings_history table (triggers on properties + properties_extension) + one-shot
backfill from property_details.listing_events for pre-trigger history.
Tax reassessment forecast TX · Resets to sale price
- Current annual tax
- $819 · $68/mo
- Projected year-2 tax
- $1,006 · $84/mo
- Expected delta
- +$188/yr (+$16/mo · 22.9%)
ⓘ Screening estimate from a state-policy table — verify with the county assessor before closing.
Climate risk First Street
- Flood 1/10 Low FEMA zone X (unshaded) · 0% chance over 30 yrs
- Wildfire 4/10 Moderate
- Heat 8/10 Severe 7 d/yr ≥105°F today · 22 d/yr by 30 yrs out
- Wind 6/10 Major 73% chance of damaging wind over 30 yrs
- Air quality 2/10 Low 0 unhealthy d/yr today · 1 by 30 yrs out
Nearby sold comps map
Loading sold comps map…
Walkable amenities ~0.75 mi
Loading nearby amenities…
Taxation est. · year 1
- Rental income
- $20,591
- − Mortgage interest
- −$3,081
- − Property taxes
- −$819
- − Insurance
- −$275
- − Repairs & maintenance
- −$1,647
- − Management
- −$1,647
- − Depreciation
- −$1,600
- Taxable income
- $11,522
- Est. tax owed @ 24.0%
- −$2,765
- After-tax cash flow
- $8,947/yr
For passive investors: Depreciation is non-cash, so a rental often shows a tax loss while cash-flowing — sheltering income. Rental losses are passive: they offset passive income freely, and up to $25,000/yr can offset ordinary (W-2) income if you actively participate and your MAGI is under $100k (phasing out to $0 by $150k); unused losses carry forward. On sale, claimed depreciation is recaptured at up to 25%, and gains may owe capital-gains tax (a 1031 exchange can defer both). Figures are a year-1 estimate at your 24.0% rate — not tax advice; consult a CPA.
Schools (NCES district)
- District
- Comal ISD
- NCES district ID
- 4814730
- Math proficiency
- 57% ▼ -9.00%
- Reading proficiency
- 59% ▼ -2.00%
- Median HH income
- $74,792
- Composite
- 51.79/100
- National rank
- #1671
- State rank
- #58 of 826 in TX
Livability — Canyon Lake
- Score
- 67/100
- State rank
- #534
- US rank
- #10441
Category grades
Schools grade is shown separately in the Schools card above.
Census & demographics
- Census place
- Canyon Lake, TX
- County
- Comal County · 206,262 people
- City population
- 42,159
- Metro
- San Antonio-New Braunfels, TX
- Population (ZIP)
- 21,959
- Household income
- $83,853
- Rent vs Own
- Severe rent burden
- 402.0
Population outlook (Comal County) Hauer SSP2
- Today (2025)
- 175,637 people
- By 2030
- 199,911 · +13.8%
- By 2040
- 249,436 · +42.0%
- By 2050
- 299,430 · +70.5%
- By 2075
- 423,857 · +141.3%
- By 2100
- 512,048 · +191.5%
Race, ethnicity, and origin ACS 2023
- Neighborhood character
- Predominantly White (74%)
- Race & ethnicity
- White 74% Hispanic / Latino 20% Two or more races 10% Black 2%
- Hispanic origin (detail)
- Mexican 15%
- Common ancestry
- Lithuanian 3% Romanian 3% Italian 3%
- Foreign-born
- 4% · Canada
- Languages at home
- 91% English-only · Spanish 7%
Political lean MEDSL · Comal
- 2024 margin
- Solid R (+45.5) · D 26.8% · R 72.2%
- 2008→2024 swing
- +1.9pp toward D · 2008: -47.4pp · 2024: -45.5pp
- All cycles
- 2024: R+45.5 2020: R+42.7 2016: R+50.1 2012: R+54.1 2008: R+47.4
Not yet ingested
- Civics
- —
Market trends
- HPI YoY
- ▼ -111.36%
- Current HPI
- 218.4633
- Rent YoY
- ▼ -1.20%
- Metro
- San Antonio-New Braunfels, TX
- State GDP YoY
- ▲ 3.95%
- F500 in state
- 110
Industry mix (Fortune 500 HQ in TX)
| Industry | F500 HQs | Revenue |
|---|---|---|
| Energy | 16 | $1,198B |
|
||
| Technology | 5 | $198B |
|
||
| Engineering / Construction | 4 | $72B |
|
||
| Energy Services | 3 | $60B |
|
||
| Utilities | 3 | $41B |
|
||
| Healthcare | 2 | $330B |
|
||
Price history
+4.8% since first listed10 events — show timeline
- 2026-06-01 Pending — LERA
- 2026-05-26 Contingent — LERA
- 2026-05-16 Price Changed $55,000 LERA
- 2026-04-30 Listed $65,000 LERA
- 2013-02-27 Sold (Public Records) — Public Records
- 2013-02-22 Sold (MLS) — LERA
- 2013-02-22 Sold (MLS) — CTXMLS
- 2013-01-10 Listing Removed — LERA
- 2012-10-01 Listed $52,500 LERA
- 2012-10-01 Listed $52,500 CTXMLS
Property tax history
+2.2%/yrLatest (2026): $819 · +10.0% YoY. Source: county tax records.
Cash-flow waterfall
monthlySold comps — $/sqft
last 12 mo · ≤1 miLoading sold comps…