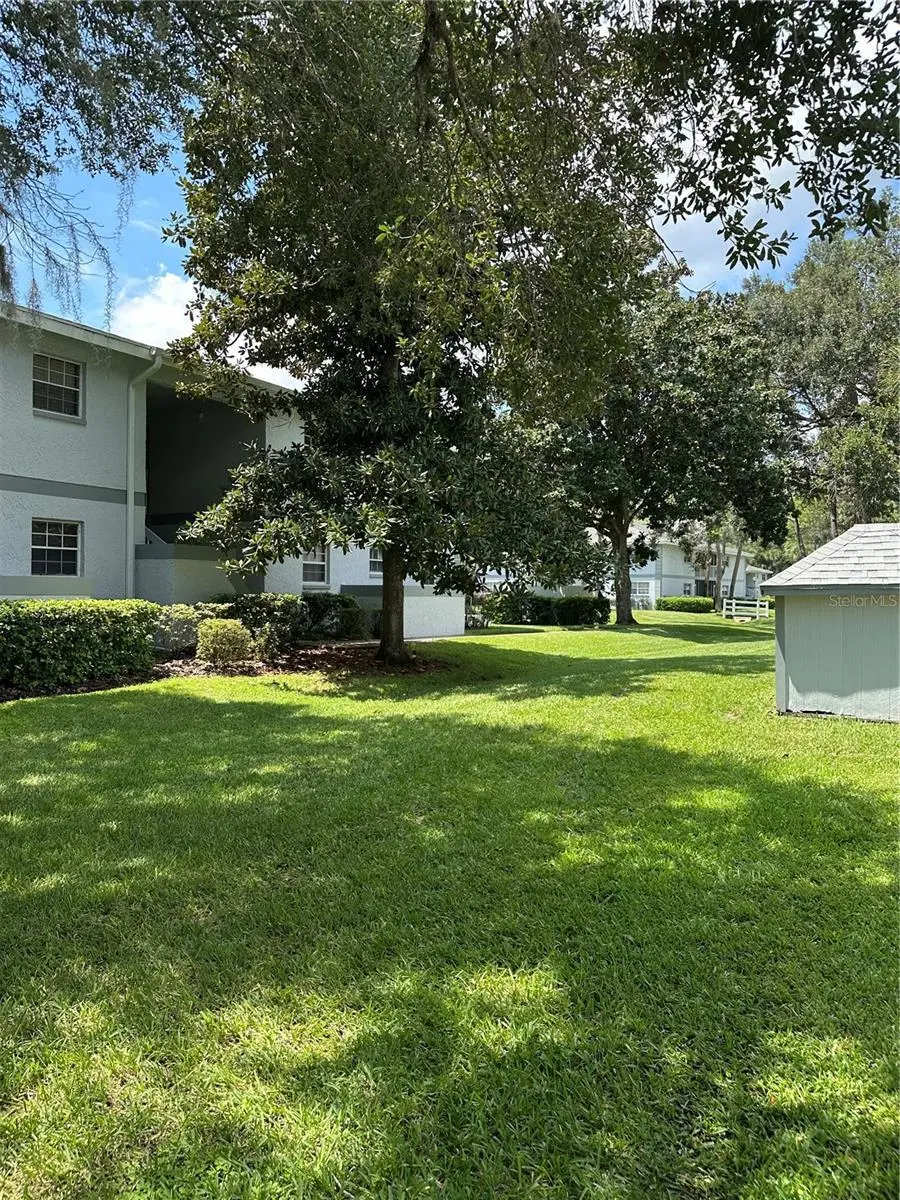
584 Fairways Ln Unit F202 · Silver Springs Shores, FL
Flood risk 1/10 · Minimal
- FEMA flood zone
- X (unshaded)
- Chance of flooding over 30 yrs
- 0.0%
- Est. flood insurance / yr
- $507 – $1,088
Fire risk 4/10 · Minor
- Est. fire insurance / yr
- $947 – $1,759
Heat risk 8/10 · Major
- Hot days now (above 108°F)
- 7 days/yr
- Hot days in 30 yrs
- 22 days/yr
Wind risk 9/10 · Severe
- Chance of severe wind over 30 yrs
- 99.0%
Air-quality risk 3/10 · Minor
- Unhealthy air days now
- 3 days/yr
- Unhealthy air days in 30 yrs
- 4 days/yr
Risk factors via First Street. Map © Google.
Why this score? — see what drove the C+ grade
The composite is a weighted blend of 9 inputs, each scored 0–100. Each bar is that input's sub-score; the figure is the points it added to the 100-point composite (weight × sub-score).
- Cash flow +17.4/30.0
- ARV discount +10.2/15.0
- 1% rule +8.7/10.0
- Appreciation +8.0/10.0
- DSCR +5.4/10.0
- Schools +3.6/10.0
- Livability +3.4/5.0
- Rent growth +2.5/5.0
- Condition / age +2.5/5.0
$99,900
🖨 Deal sheet 📄 Offer letter ✓ Due diligence
Listing remarks MLS
Lovely well maintained unit. Very clean, nicely decorated. Furniture is optional.
Key facts
- $304 HOA
- Community pool
- Built 1984
Neighborhood map
What this means for you Summary
Snapshot
- This is a 2-bed/2.0-bath condo listed at $100k.
Deal economics
- At list price, monthly cash flow is $75 ($894/yr) — positive.
- The deal already cash-flows at list — no discount required.
- Meets the 1% rule at list price ($1k rent vs $100k).
- Recommended offer: $88k (12.0% below list) — sets the bar for market timing.
- Cap rate 7.2% vs local median 4.7% in Silver Springs Shores — top-decile yield for the area; either an underpriced asset or a hidden risk that comps aren't pricing in. Stress-test before assuming the spread holds.
Location & tenants
- Location reads 68/100 on livability (#527 in FL) — a middle-class / working-renter tenant base. Strengths: cost of living A+, housing A+, health & safety A-; Watch: crime C-, employment D, schools F.
- Marion (rural): math 42% / reading 43% proficiency, ranked #61 of 73 in FL (top 84%) — families likely to look elsewhere, expect single-tenant / working-renter base with shorter leases; 61% free/reduced lunch — lower-income household profile, screen leases tightly.
- Market conditions: Rents flat; 674 active listings in the ZIP; 25 comparable units currently listed for rent nearby; rentals at typical pace (median 22d on market — plan ~3-4 weeks tenant-placement turnaround); 7,071 units permitted in Marion County in 2024 (534 in 5+ unit buildings).
Forward outlook
- In year one you build about $7k of equity ($691 loan paydown + $6k appreciation (5.9% local appreciation)).
- Marion County population projected at +13% by 2050 — modest demand growth; plan on rents tracking national, not racing it.
- At projected returns (5.9% appreciation + 0.2% rent growth), your $28k cash investment doubles in ~4 years — after that, you're playing with house money.
- By year 6, paydown + projected appreciation supports a ~$36k cash-out refi (75% LTV) — recoverable capital for the next deal without selling this one.
Negotiation context
- It's been on market 291 days — a 12% lower offer ($88k) is reasonable based on typical stale-listing flexibility.
- 3 sale attempts since 9y ago; this cycle's ask has dropped $30k (23%) from the opening price — seller is motivated, your offer sets the floor, not the list.
Risks & watch-outs
- Watch-outs: HOA is 22% of rent.
- Climate carrying-cost: severe wind risk, 99% chance of damaging wind over 30y; extreme-heat days projected 7→22/yr by 2055 (HVAC capex compounding) — expect insurance premiums to compound above CPI over the hold.
Questions for the listing agent
- It's been on market 291 days. Have you received any prior offers? Is the seller open to a 12% concession, seller financing, or rate buy-down credit?
- What does the HOA fee cover, when was the last increase, and are there any pending special assessments or reserve-fund shortfalls?
- Any open or pending special assessments — roof, HVAC, plumbing, elevator, façade? What's the per-unit balance and payoff schedule, and is the seller paying it off at close or rolling it to the buyer?
- Why hasn't it sold? Are there any deal-killer items the seller is aware of (foundation, flood, title, zoning, code violations)?
- Is there a deadline driving the sale (1031 exchange, divorce, estate, relocation)? That informs how much negotiation room exists.
- Schools are F-rated, which usually means shorter tenancies and higher turnover. Who's the typical renter profile here, and what's been the actual vacancy rate?
- What's the average days-on-market for RENTAL listings here right now (not sales)? A rising rental-DOM trend means longer vacancies and softer asking-rent achievability than the comps imply.
- What's the recent tenant-quality profile in this submarket — average credit score on applications, eviction rate, late-payment / NSF rate, and stable-employment percentage? A property-management company in the area should have these aggregated.
- How much new apartment / multifamily construction is in the pipeline within 1–3 miles? Heavy new supply (>2% of stock underway) typically softens rents 12–24 months out; light construction supports rent growth.
Investment metrics
- 1% rule
- 1.37% ✓
- Cap rate
- 7.19%
- Cash-on-cash
- 3.20%
- DSCR
- 1.14
- GRM
- 6.1
CMA / ARV
- ARV (median comp)
- $106,245
- List price
- $99,900
- Delta
- -5.97%
- Verdict
- FAIR
- Comps
- 20 within 1.0 mi
Projected returns pro-forma
5.93% appreciation · 0.17% rent growth · sell at horizon
- IRR
- 16.1%
- Equity multiple
- 2.06×
- Total profit
- $29,623
- Equity at exit
- $62,376
- IRR
- 14.8%
- Equity multiple
- 3.76×
- Total profit
- $77,112
- Equity at exit
- $112,750
Cash invested: $27,972 (down + closing). Projections, not guarantees.
Landlord ↔ Tenant lean methodology
- Overall (STATE)
- 87 Strongly Landlord-Friendly
- State Florida
- 87 Strongly Landlord-Friendly · R+3
- County
- — inherits STATE
- City
- — inherits STATE
ZIP-level market 34472
- Home prices YoY
- 2.4%
- Rents YoY
- 0.2%
- Active inventory
- 674
- Price-to-rent
- 6.1×
Monthly cashflow live
- Estimated rent
- $1,366 high interval (Pro) →
- Mortgage (P&I)
- −$524
- Tax from tax record
- −$135 /mo · $1,618/yr
- Insurance
- −$42
- HOA
- −$304
- Vacancy / Maint / Mgmt
- −$287
- Net cashflow
- $75
Break-even live
UW: 25.0% down · 7.5% · 30yr · 1.5% tax · 5.0% vac · 8.0% maint · 8.0% mgmt
Financing live
Cash to close
- Down payment
- $24,975
- Closing costs
- $2,997
- Reserves months
- —
- Total cash needed
- —
Loan-product check · same deal, 3 products live
Conventional
25% down · 7.5% · 30yr
- Down + closing
- —
- Monthly P&I
- —
- Monthly cashflow
- —
- DSCR
- —
- Eligible?
- —
Personal DTI + credit; lowest rate.
DSCR
20% down · 8.5% · 30yr
- Down + closing
- —
- Monthly P&I
- —
- Monthly cashflow
- —
- DSCR
- —
- Eligible?
- —
No personal income docs; deal must DSCR.
Hard money
10% down · 12.0% · 12mo
- Down + closing
- —
- Monthly P&I
- —
- Monthly cashflow
- —
- DSCR
- —
- Eligible?
- —
Short-term bridge; refi at stabilization.
Rent comps 25 comps
| Address | Beds | Baths | Sqft | Rent | $/sqft | DOM | Units | Dist |
|---|---|---|---|---|---|---|---|---|
| 576 Fairways Ln Unit M104 Ocala, FL | 2.0 | 2.0 | 837 | $1,250 | $1.49 | 21d | 1 | 0.04mi |
| 567 Midway Trak Unit H201 Ocala, FL | 3.0 | 2.0 | 1029 | $1,350 | $1.31 | 14d | 1 | 0.05mi |
| 454 Fairways Cir Unit B204 Ocala, FL | 2.0 | 2.0 | 837 | $1,289 | $1.54 | 21d | 1 | 0.05mi |
| 454 Fairways Cir Unit B203 Ocala, FL | 2.0 | 2.0 | 850 | $1,375 | $1.62 | 21d | 1 | 0.05mi |
| 454 Fairways Cir Ocala, FL | 2.0 | 2.0 | 837 | $1,200 | $1.43 | 21d | 1 | 0.05mi |
| 510 Fairways Cir Unit A Ocala, FL | 2.0 | 2.0 | 1000 | $1,299 | $1.30 | 21d | 1 | 0.08mi |
| 548 Fairways Cir Unit C102 Ocala, FL | 2.0 | 2.0 | 850 | $1,400 | $1.65 | 21d | 1 | 0.08mi |
| 520 Fairways Cir Unit A Ocala, FL | 2.0 | 1.5 | 1027 | $1,100 | $1.07 | 21d | 1 | 0.11mi |
| 532 Bahia Cir Unit A Ocala, FL | 2.0 | 1.5 | 1027 | $1,300 | $1.27 | 21d | 1 | 0.13mi |
| 549 Fairways Dr Unit A Ocala, FL | 2.0 | 2.0 | 1072 | $1,200 | $1.12 | 21d | 1 | 0.20mi |
| 561 Fairways Cir Unit A Ocala, FL | 2.0 | 1.5 | 1031 | $1,250 | $1.21 | 21d | 1 | 0.22mi |
| 593 Fairways Cir Unit A Ocala, FL | 2.0 | 1.5 | 1031 | $1,200 | $1.16 | 21d | 1 | 0.32mi |
| 633 Silver Pass Unit B Ocala, FL | 2.0 | 2.0 | 1072 | $1,500 | $1.40 | 21d | 1 | 0.34mi |
| 544 Silver Crse Ocala, FL | 2.0 | 1.0 | 904 | $1,395 | $1.54 | 14d | 1 | 0.34mi |
| 608 Midway Dr Unit A Ocala, FL | 2.0 | 1.5 | 1054 | $1,500 | $1.42 | 14d | 1 | 0.38mi |
| 681 Midway Dr Unit A Ocala, FL | 2.0 | 2.0 | 1000 | $1,250 | $1.25 | 14d | 1 | 0.43mi |
| 681 Midway Dr Unit A Ocala, FL | 2.0 | 2.0 | 1000 | $1,250 | $1.25 | 21d | 1 | 0.43mi |
| 7817 Midway Drive Ter Unit A103 Ocala, FL | 1.0 | 1.0 | 729 | $1,300 | $1.78 | 21d | 1 | 0.67mi |
| 54 Pine Trak Unit 104F Ocala, FL | 2.0 | 2.0 | 832 | $1,300 | $1.56 | 21d | 1 | 0.86mi |
| 162 Bahia Terrace Dr Ocala, FL | 2.0 | 2.0 | 984 | $1,375 | $1.40 | 21d | 1 | 0.87mi |
| 58 Pine Trak Unit 104D Ocala, FL | 2.0 | 2.0 | 832 | $1,050 | $1.26 | 21d | 1 | 0.89mi |
| 62 Pine Trak Ocala, FL | 2.0 | 2.0 | 832 | $1,250 | $1.50 | 21d | 1 | 0.93mi |
| 5 Cedar Ln Ocala, FL | 3.0 | 2.0 | 1064 | $1,750 | $1.64 | 21d | 1 | 1.27mi |
| 7455 Midway Ter Unit K Ocala, FL | 2.0 | 1.0 | 904 | $1,249 | $1.38 | 21d | 1 | 1.27mi |
| 12 Spring Loop Ocala, FL | 2.0 | 1.0 | 900 | $1,350 | $1.50 | 14d | 1 | 1.29mi |
HOA detail condo
- Monthly dues
- $304 · $3,648/yr
- Assessments
- None detected in remarks — confirm with the listing agent.
Listing history 27 events
-
2026-06-18days on market $99,900 Active 291 DOM
-
2026-06-17days on market $99,900 Active 290 DOM
-
2026-06-16days on market $99,900 Active 289 DOM
-
2026-06-15days on market $99,900 Active 288 DOM
-
2026-06-14days on market $99,900 Active 286 DOM
-
2026-06-13days on market $99,900 Active 285 DOM
-
2026-06-10days on market $99,900 Active 283 DOM
-
2026-06-09days on market $99,900 Active 282 DOM
-
2026-06-08days on market $99,900 Active 281 DOM
-
2026-06-07days on market $99,900 Active 280 DOM
-
2026-06-03days on market $99,900 Active 276 DOM
-
2026-06-02days on market $99,900 Active 275 DOM
-
2026-05-31days on market $99,900 Active 273 DOM
-
2026-05-30days on market $99,900 Active 272 DOM
-
2026-05-15price $99,900 81-char remark
Show marketing remark (81 chars)
Lovely well maintained unit. Very clean, nicely decorated. Furniture is optional.
-
2026-04-16price $109,900 81-char remark
Show marketing remark (81 chars)
Lovely well maintained unit. Very clean, nicely decorated. Furniture is optional.
-
2026-01-24price $114,900 81-char remark
Show marketing remark (81 chars)
Lovely well maintained unit. Very clean, nicely decorated. Furniture is optional.
-
2025-10-31price $119,900 81-char remark
Show marketing remark (81 chars)
Lovely well maintained unit. Very clean, nicely decorated. Furniture is optional.
-
2025-08-31$129,900 Active 81-char remark
Show marketing remark (81 chars)
Lovely well maintained unit. Very clean, nicely decorated. Furniture is optional.
-
2023-06-09soldstatus $110,900 Closed 157-char remark
Show marketing remark (157 chars)
Nice upstairs 2 bedroom 2 bath with screened porch in desirable Silver Downs. Carpet in mail areas and bedrooms. Sheet Vinyl in kitchen and baths. See Photos
-
2023-05-14status Pending 157-char remark
Show marketing remark (157 chars)
Nice upstairs 2 bedroom 2 bath with screened porch in desirable Silver Downs. Carpet in mail areas and bedrooms. Sheet Vinyl in kitchen and baths. See Photos
-
2023-04-26$114,900 Active 157-char remark
Show marketing remark (157 chars)
Nice upstairs 2 bedroom 2 bath with screened porch in desirable Silver Downs. Carpet in mail areas and bedrooms. Sheet Vinyl in kitchen and baths. See Photos
-
2017-12-13soldstatus $40,000
-
2017-12-08soldstatus $40,000
-
2017-08-25$43,900
-
2013-07-12soldstatus $20,000
-
1985-04-01soldstatus $67,300
ⓘ Source: listings_history table (triggers on properties + properties_extension) + one-shot
backfill from property_details.listing_events for pre-trigger history.
Tax reassessment forecast FL · Resets to sale price
- Current annual tax
- $1,618 · $135/mo
- Projected year-2 tax
- $1,618 · $135/mo
- Expected delta
- $0/yr ($0/mo · 0.0%)
ⓘ Screening estimate from a state-policy table — verify with the county assessor before closing.
Climate risk First Street
- Flood 1/10 Low FEMA zone X (unshaded) · 0% chance over 30 yrs
- Wildfire 4/10 Moderate
- Heat 8/10 Severe 7 d/yr ≥108°F today · 22 d/yr by 30 yrs out
- Wind 9/10 Extreme 99% chance of damaging wind over 30 yrs
- Air quality 3/10 Moderate 3 unhealthy d/yr today · 4 by 30 yrs out
Nearby sold comps map
Loading sold comps map…
Walkable amenities ~0.75 mi
Loading nearby amenities…
Taxation est. · year 1
- Rental income
- $16,389
- − Mortgage interest
- −$5,596
- − Property taxes
- −$1,618
- − Insurance
- −$500
- − Repairs & maintenance
- −$1,311
- − Management
- −$1,311
- − HOA
- −$3,648
- − Depreciation
- −$2,906
- Taxable loss
- −$502
- Est. tax savings @ 24.0%
- +$120
- After-tax cash flow
- $1,015/yr
For passive investors: Depreciation is non-cash, so a rental often shows a tax loss while cash-flowing — sheltering income. Rental losses are passive: they offset passive income freely, and up to $25,000/yr can offset ordinary (W-2) income if you actively participate and your MAGI is under $100k (phasing out to $0 by $150k); unused losses carry forward. On sale, claimed depreciation is recaptured at up to 25%, and gains may owe capital-gains tax (a 1031 exchange can defer both). Figures are a year-1 estimate at your 24.0% rate — not tax advice; consult a CPA.
Schools (NCES district)
- District
- Marion
- NCES district ID
- 1201260
- Math proficiency
- 42% ▼ -7.00%
- Reading proficiency
- 43% ▼ -4.00%
- Median HH income
- $40,015
- Composite
- 35.61/100
- National rank
- #4890
- State rank
- #61 of 73 in FL
Livability — Silver Springs Shores
- Score
- 68/100
- State rank
- #527
- US rank
- #9854
Category grades
Schools grade is shown separately in the Schools card above.
Census & demographics
- Census place
- Silver Springs Shores, FL
- County
- Marion County · 315,796 people
- City population
- 34,665
- Metro
- Ocala, FL
- Population (ZIP)
- 35,851
- Household income
- $64,208
- Rent vs Own
- Severe rent burden
- 655.0
Population outlook (Marion County) Hauer SSP2
- Today (2025)
- 365,905 people
- By 2030
- 376,768 · +3.0%
- By 2040
- 396,555 · +8.4%
- By 2050
- 412,723 · +12.8%
- By 2075
- 446,090 · +21.9%
- By 2100
- 436,193 · +19.2%
Race, ethnicity, and origin ACS 2023
- Neighborhood character
- Diverse neighborhood (Simpson 0.65)
- Race & ethnicity
- White 50% Hispanic / Latino 25% Black 21% Two or more races 18% Asian 2%
- Hispanic origin (detail)
- Mexican 2% Puerto Rican 14% Cuban 3%
- Common ancestry
- Romanian 2% Iranian 1% Lithuanian 1%
- Foreign-born
- 11% · Canada, Jamaica, China
- Languages at home
- 78% English-only · Spanish 19% Other Indo-European 1%
Political lean MEDSL · Marion
- 2024 margin
- Solid R (+31.6) · D 33.8% · R 65.5%
- 2008→2024 swing
- -20.0pp toward R · 2008: -11.6pp · 2024: -31.6pp
- All cycles
- 2024: R+31.6 2020: R+25.9 2016: R+26.2 2012: R+16.2 2008: R+11.6
Not yet ingested
- Civics
- —
Market trends
- HPI YoY
- ▲ 5.93%
- Current HPI
- 255.0714
- Rent YoY
- ▲ 0.17%
- Metro
- Ocala, FL
- State GDP YoY
- ▲ 3.28%
- F500 in state
- 36
Industry mix (Fortune 500 HQ in FL)
| Industry | F500 HQs | Revenue |
|---|---|---|
| Industrial Technology | 2 | $29B |
|
||
| Insurance | 2 | $17B |
|
||
| Retail | 1 | $60B |
|
||
| Technology Distribution | 1 | $58B |
|
||
| Homebuilding | 1 | $35B |
|
||
| Technology Manufacturing | 1 | $35B |
|
||
Price history
+48.4% since first listed13 events — show timeline
- 2026-05-15 Price Changed $99,900 Stellar MLS as Distributed by MLS Grid
- 2026-04-16 Price Changed $109,900 Stellar MLS as Distributed by MLS Grid
- 2026-01-24 Price Changed $114,900 Stellar MLS as Distributed by MLS Grid
- 2025-10-31 Price Changed $119,900 Stellar MLS as Distributed by MLS Grid
- 2025-08-31 Listed $129,900 Stellar MLS as Distributed by MLS Grid
- 2023-06-09 Sold (MLS) $110,900 Stellar MLS as Distributed by MLS Grid
- 2023-05-14 Pending — Stellar MLS as Distributed by MLS Grid
- 2023-04-26 Listed $114,900 Stellar MLS as Distributed by MLS Grid
- 2017-12-13 Sold (Public Records) $40,000 Public Records
- 2017-12-08 Sold (MLS) $40,000 Stellar MLS as Distributed by MLS Grid
- 2017-08-25 Listed $43,900 Stellar MLS as Distributed by MLS Grid
- 2013-07-12 Sold (Public Records) $20,000 Public Records
- 1985-04-01 Sold (Public Records) $67,300 Public Records
Property tax history
+6.7%/yrLatest (2025): $1,618 · +17.6% YoY. Source: county tax records.
Cash-flow waterfall
monthlySold comps — $/sqft
last 12 mo · ≤1 miLoading sold comps…