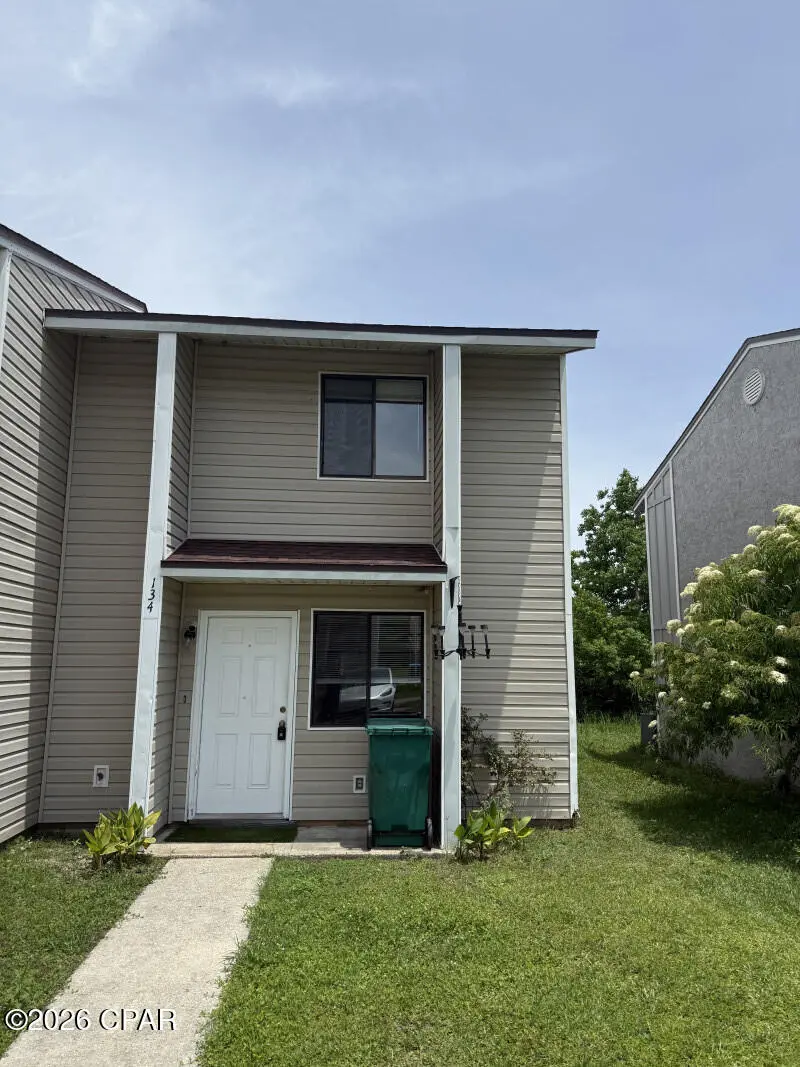
134 Cheri Ln · Parker, FL
Flood risk 4/10 · Minor
- FEMA flood zone
- X (unshaded)
- Chance of flooding over 30 yrs
- 0.21%
- Est. flood insurance / yr
- $507 – $1,088
Fire risk 1/10 · Minimal
- Est. fire insurance / yr
- $947 – $1,759
Heat risk 10/10 · Severe
- Hot days now (above 104°F)
- 7 days/yr
- Hot days in 30 yrs
- 21 days/yr
Wind risk 9/10 · Severe
- Chance of severe wind over 30 yrs
- 99.0%
Air-quality risk 1/10 · Minimal
- Unhealthy air days now
- 0 days/yr
- Unhealthy air days in 30 yrs
- 0 days/yr
Risk factors via First Street. Map © Google.
Why this score? — see what drove the B grade
The composite is a weighted blend of 9 inputs, each scored 0–100. Each bar is that input's sub-score; the figure is the points it added to the 100-point composite (weight × sub-score).
- Cash flow +30.0/30.0
- ARV discount +12.4/15.0
- DSCR +10.0/10.0
- 1% rule +8.0/10.0
- Schools +4.3/10.0
- Livability +3.2/5.0
- Rent growth +2.8/5.0
- Condition / age +2.5/5.0
- Appreciation +0.0/10.0
$107,000
🖨 Deal sheet 📄 Offer letter ✓ Due diligence
Listing remarks
Spacious and inviting 2 bedroom, 1.5 bath end unit townhome offering extra privacy and natural light throughout. This well maintained home features a functional layout with comfortable living spaces, an open flow from living room to dining to kitchen on the 1st floor and generously sized bedrooms and full bath upstairs. Conveniently located near shopping, dining, schools, and major roadways, this townhome is perfect for first time buyers, downsizers, or investors. Move in ready and full of potential, don't miss this opportunity!
Key facts
- Built 1984
- Listed 36 days
Property features AI
Finance
- Financial info: Annual tax amount reported ($785 for 2025)
Exterior
- Utilities: Public sewer
- Home design: Mobile home dimension units measured in feet
- Exterior features: Lot dimensions listed as 0
Interior
- Bedrooms: Two bedrooms on the second floor (10 x 11; 14 x 16)
- Bathrooms: One full bathroom; One half bathroom
- Interior features: Two total rooms
Neighborhood map
What this means for you Summary
Snapshot
- This is a 2-bed/2.0-bath townhouse listed at $107k.
Deal economics
- At list price, monthly cash flow is $430 ($5k/yr) — positive.
- The deal already cash-flows at list — no discount required.
- Meets the 1% rule at list price ($1k rent vs $107k).
- Recommended offer: $104k (3.0% below list) — sets the bar for market timing.
Location & tenants
- Location reads 63/100 on livability (#704 in FL) — a middle-class / working-renter tenant base. Strengths: cost of living A+, housing A+; Watch: crime C-, schools F, amenities F.
- Bay (suburban): math 51% / reading 51% proficiency, ranked #29 of 73 in FL (top 40%) — acceptable for families but not a draw, mixed tenant base, ~2y average lease.
- Market conditions: Rents rising (+1.1%/yr); 969 active listings in the ZIP; 15 comparable units currently listed for rent nearby; rentals at typical pace (median 21d on market — plan ~3-4 weeks tenant-placement turnaround); 2,473 units permitted in Bay County in 2024 (559 in 5+ unit buildings).
Forward outlook
- Local home prices are declining (-3.0%/yr); year-one equity from $740 of loan paydown is wiped out by about $3k of value loss. Plan a longer hold.
- Bay County population projected at +24% by 2050 — long-run rental-demand tailwind backs the buy-and-hold thesis.
- At projected returns (-3.0% appreciation + 1.1% rent growth), your $30k cash investment doubles in ~9 years — after that, you're playing with house money.
Negotiation context
- It's been on market 37 days — a 3% lower offer ($104k) is reasonable based on typical stale-listing flexibility.
Risks & watch-outs
- Climate carrying-cost: severe wind risk, 99% chance of damaging wind over 30y; extreme-heat days projected 7→21/yr by 2055 (HVAC capex compounding) — expect insurance premiums to compound above CPI over the hold.
Questions for the listing agent
- It's been on market 37 days. Have you received any prior offers? Is the seller open to a 3% concession, seller financing, or rate buy-down credit?
- Is there a deadline driving the sale (1031 exchange, divorce, estate, relocation)? That informs how much negotiation room exists.
- Schools are F-rated, which usually means shorter tenancies and higher turnover. Who's the typical renter profile here, and what's been the actual vacancy rate?
- What's the average days-on-market for RENTAL listings here right now (not sales)? A rising rental-DOM trend means longer vacancies and softer asking-rent achievability than the comps imply.
- What's the recent tenant-quality profile in this submarket — average credit score on applications, eviction rate, late-payment / NSF rate, and stable-employment percentage? A property-management company in the area should have these aggregated.
- How much new for-sale + rental construction is in the pipeline within 1–3 miles? Heavy new supply typically softens prices + rents 12–24 months out; constrained supply supports both.
Investment metrics
- 1% rule
- 1.30% ✓
- Cap rate
- 11.12%
- Cash-on-cash
- 17.23%
- DSCR
- 1.77
- GRM
- 6.4
CMA / ARV
- ARV (median comp)
- $120,216
- List price
- $107,000
- Delta
- -10.99%
- Verdict
- UNDERPRICED
- Comps
- 14 within 1.0 mi
Show comp detail 1 sale within ~0.75 mi
| Address | Dist | Beds/Ba | Sqft | Sold | Price | $/sf | Match |
|---|---|---|---|---|---|---|---|
| 121 Cheri Ln | 0.05mi | 2/1.5 | 972 (0%) | 15mo | $110,000 | $113 | 83 |
Match score weights: distance 35% · size 25% · config 20% · recency 20%. Top-matched comps best support the ARV.
Projected returns pro-forma
-3.0% appreciation · 1.12% rent growth · sell at horizon
- IRR
- 6.5%
- Equity multiple
- 1.25×
- Total profit
- $7,457
- Equity at exit
- $15,954
- IRR
- 14.2%
- Equity multiple
- 2.05×
- Total profit
- $31,468
- Equity at exit
- $9,251
Cash invested: $29,960 (down + closing). Projections, not guarantees.
Landlord ↔ Tenant lean methodology
- Overall (STATE)
- 87 Strongly Landlord-Friendly
- State Florida
- 87 Strongly Landlord-Friendly · R+3
- County
- — inherits STATE
- City
- — inherits STATE
ZIP-level market 32404
- Home prices YoY
- -16.1%
- Rents YoY
- 1.1%
- Active inventory
- 969
- Price-to-rent
- 6.4×
Monthly cashflow live
- Estimated rent
- $1,394 high interval (Pro) →
- Mortgage (P&I)
- −$561
- Tax from tax record
- −$65 /mo · $785/yr
- Insurance
- −$45
- HOA
- −$0
- Vacancy / Maint / Mgmt
- −$293
- Net cashflow
- $430
Break-even live
UW: 25.0% down · 7.5% · 30yr · 1.5% tax · 5.0% vac · 8.0% maint · 8.0% mgmt
Financing live
Cash to close
- Down payment
- $26,750
- Closing costs
- $3,210
- Reserves months
- —
- Total cash needed
- —
Loan-product check · same deal, 3 products live
Conventional
25% down · 7.5% · 30yr
- Down + closing
- —
- Monthly P&I
- —
- Monthly cashflow
- —
- DSCR
- —
- Eligible?
- —
Personal DTI + credit; lowest rate.
DSCR
20% down · 8.5% · 30yr
- Down + closing
- —
- Monthly P&I
- —
- Monthly cashflow
- —
- DSCR
- —
- Eligible?
- —
No personal income docs; deal must DSCR.
Hard money
10% down · 12.0% · 12mo
- Down + closing
- —
- Monthly P&I
- —
- Monthly cashflow
- —
- DSCR
- —
- Eligible?
- —
Short-term bridge; refi at stabilization.
Rent comps 15 comps
| Address | Beds | Baths | Sqft | Rent | $/sqft | DOM | Units | Dist |
|---|---|---|---|---|---|---|---|---|
| 543 N 9th St Unit 543 Panama City, FL | 2.0 | 1.0 | 850 | $1,195 | $1.41 | 13d | 1 | 0.43mi |
| 4828 Grimes St #3 Panama City, FL | 2.0 | 1.0 | 850 | $1,150 | $1.35 | 20d | 1 | 0.44mi |
| 4837 S Lakewood Dr Panama City, FL | 2.0 | 1.5 | 1116 | $1,500 | $1.34 | 20d | 1 | 0.60mi |
| 1128 S Gay Ave Lot N Panama City, FL | 3.0 | 2.0 | 924 | $40,000 | $43.29 | 20d | 1 | 0.70mi |
| 322 S Burkett Dr Panama City, FL | 1.0–2.0 | 1.0–2.0 | 600 | $1,519 | $2.53 | 13d | 13 | 0.75mi |
| 4480 East Highway 98 Unit 1 Panama City, FL | 2.0 | 1.5 | 972 | $1,250 | $1.29 | 20d | 1 | 0.84mi |
| 4480 E Highway 98 Panama City, FL | 2.0 | 1.0 | 972 | $1,250 | $1.29 | 20d | 1 | 0.84mi |
| 149 North Highway 22 A Unit 5 Panama City, FL | 2.0 | 1.0 | 900 | $1,140 | $1.27 | 13d | 1 | 1.09mi |
| 108 N Anita Dr Callaway, FL | 1.0 | 1.0 | 700 | $1,200 | $1.71 | 20d | 1 | 1.10mi |
| 5805 Cherry St Panama City, FL | 2.0 | 1.0 | 1025 | $1,200 | $1.17 | 13d | 1 | 1.10mi |
| 208 North Highway 22 A Unit 33 Panama City, FL | 3.0 | 2.0 | 1080 | $1,350 | $1.25 | 20d | 1 | 1.23mi |
| 5101 Willow St Panama City, FL | 3.0 | 2.0 | 1099 | $1,500 | $1.36 | 13d | 1 | 1.35mi |
| 719 S Berthe Ave Unit 8 Panama City, FL | 2.0 | 1.0 | 910 | $1,000 | $1.10 | 20d | 1 | 1.37mi |
| 4905 Alameda St Unit 1 Panama City, FL | 3.0 | 2.0 | 942 | $1,295 | $1.37 | 20d | 1 | 1.41mi |
| 6600 Oakshore Dr Panama City, FL | 1.0–3.0 | 1.0–2.0 | 1002 | $1,938 | $1.93 | 13d | 57 | 1.48mi |
Listing history 18 events
-
2026-06-19days on market $107,000 Active 37 DOM
-
2026-06-18days on market $107,000 Active 36 DOM
-
2026-06-17days on market $107,000 Active 35 DOM
-
2026-06-16days on market $107,000 Active 34 DOM
-
2026-06-15pricedays on market $107,000 Active 33 DOM
-
2026-06-14days on market $109,900 Active 31 DOM
-
2026-06-13days on market $109,900 Active 30 DOM
-
2026-06-10days on market $109,900 Active 28 DOM
-
2026-06-09days on market $109,900 Active 27 DOM
-
2026-06-08days on market $109,900 Active 26 DOM
-
2026-06-07days on market $109,900 Active 25 DOM
-
2026-06-05days on market $109,900 Active 22 DOM
-
2026-06-03days on market $109,900 Active 21 DOM
-
2026-06-02days on market $109,900 Active 20 DOM
-
2026-06-01days on market $109,900 Active 19 DOM
-
2026-05-31days on market $109,900 Active 18 DOM
-
2026-05-30pricedays on market $109,900 Active 17 DOM
-
2026-05-13$119,900 Active 534-char remark
ⓘ Source: listings_history table (triggers on properties + properties_extension) + one-shot
backfill from property_details.listing_events for pre-trigger history.
Tax reassessment forecast FL · Resets to sale price
- Current annual tax
- $785 · $65/mo
- Projected year-2 tax
- $888 · $74/mo
- Expected delta
- +$103/yr (+$9/mo · 13.1%)
ⓘ Screening estimate from a state-policy table — verify with the county assessor before closing.
Climate risk First Street
- Flood 4/10 Moderate FEMA zone X (unshaded) · 21% chance over 30 yrs
- Wildfire 1/10 Low
- Heat 10/10 Extreme 7 d/yr ≥104°F today · 21 d/yr by 30 yrs out
- Wind 9/10 Extreme 99% chance of damaging wind over 30 yrs
- Air quality 1/10 Low 0 unhealthy d/yr today · 0 by 30 yrs out
Nearby sold comps map
Loading sold comps map…
Walkable amenities ~0.75 mi
Loading nearby amenities…
Taxation est. · year 1
- Rental income
- $16,730
- − Mortgage interest
- −$5,994
- − Property taxes
- −$785
- − Insurance
- −$535
- − Repairs & maintenance
- −$1,338
- − Management
- −$1,338
- − Depreciation
- −$3,113
- Taxable income
- $3,627
- Est. tax owed @ 24.0%
- −$870
- After-tax cash flow
- $4,293/yr
For passive investors: Depreciation is non-cash, so a rental often shows a tax loss while cash-flowing — sheltering income. Rental losses are passive: they offset passive income freely, and up to $25,000/yr can offset ordinary (W-2) income if you actively participate and your MAGI is under $100k (phasing out to $0 by $150k); unused losses carry forward. On sale, claimed depreciation is recaptured at up to 25%, and gains may owe capital-gains tax (a 1031 exchange can defer both). Figures are a year-1 estimate at your 24.0% rate — not tax advice; consult a CPA.
Schools (NCES district)
- District
- Bay
- NCES district ID
- 1200090
- Math proficiency
- 51% ▼ -8.00%
- Reading proficiency
- 51% ▼ -7.00%
- Median HH income
- $47,740
- Composite
- 43.41/100
- National rank
- #3014
- State rank
- #29 of 73 in FL
Livability — Parker
- Score
- 63/100
- State rank
- #704
- US rank
- #14956
Category grades
Schools grade is shown separately in the Schools card above.
Census & demographics
- Census place
- Parker, FL
- County
- Bay County · 163,593 people
- Metro
- Panama City, FL
- Population (ZIP)
- 42,514
- Household income
- $74,708
- Rent vs Own
- Severe rent burden
- 1218.0
Population outlook (Bay County) Hauer SSP2
- Today (2025)
- 206,264 people
- By 2030
- 217,740 · +5.6%
- By 2040
- 238,738 · +15.7%
- By 2050
- 255,545 · +23.9%
- By 2075
- 288,295 · +39.8%
- By 2100
- 288,638 · +39.9%
Race, ethnicity, and origin ACS 2023
- Neighborhood character
- Predominantly White (69%)
- Race & ethnicity
- White 69% Black 12% Two or more races 10% Hispanic / Latino 9% Asian 3%
- Hispanic origin (detail)
- Mexican 2% Puerto Rican 3%
- Common ancestry
- Lithuanian 3% Slovak 2% Italian 2%
- Foreign-born
- 7% · Canada, Vietnam, Mexico
- Languages at home
- 90% English-only · Spanish 6% Vietnamese 1% Other Asian/Pacific 1%
Political lean MEDSL · Bay
- 2024 margin
- Solid R (+47.4) · D 25.8% · R 73.1% · Other 1.1%
- 2008→2024 swing
- -6.6pp toward R · 2008: -40.7pp · 2024: -47.4pp
- All cycles
- 2024: R+47.4 2020: R+43.5 2016: R+46.3 2012: R+43.6 2008: R+40.7
Not yet ingested
- Civics
- —
Market trends
- HPI YoY
- ▼ -50.59%
- Current HPI
- 263.7178
- Rent YoY
- ▲ 1.12%
- Metro
- Panama City, FL
- State GDP YoY
- ▲ 3.28%
- F500 in state
- 36
Industry mix (Fortune 500 HQ in FL)
| Industry | F500 HQs | Revenue |
|---|---|---|
| Industrial Technology | 2 | $29B |
|
||
| Insurance | 2 | $17B |
|
||
| Retail | 1 | $60B |
|
||
| Technology Distribution | 1 | $58B |
|
||
| Homebuilding | 1 | $35B |
|
||
| Technology Manufacturing | 1 | $35B |
|
||
Price history
-10.8% since first listed4 events — show timeline
- 2026-06-15 Price Changed $107,000 CPARMLS
- 2026-05-30 Price Changed $109,900 CPARMLS
- 2026-05-26 Price Changed $114,900 CPARMLS
- 2026-05-13 Listed $119,900 CPARMLS
Property tax history
+4.7%/yrLatest (2025): $785 · +9.5% YoY. Source: county tax records.
Cash-flow waterfall
monthlySold comps — $/sqft
last 12 mo · ≤1 miLoading sold comps…