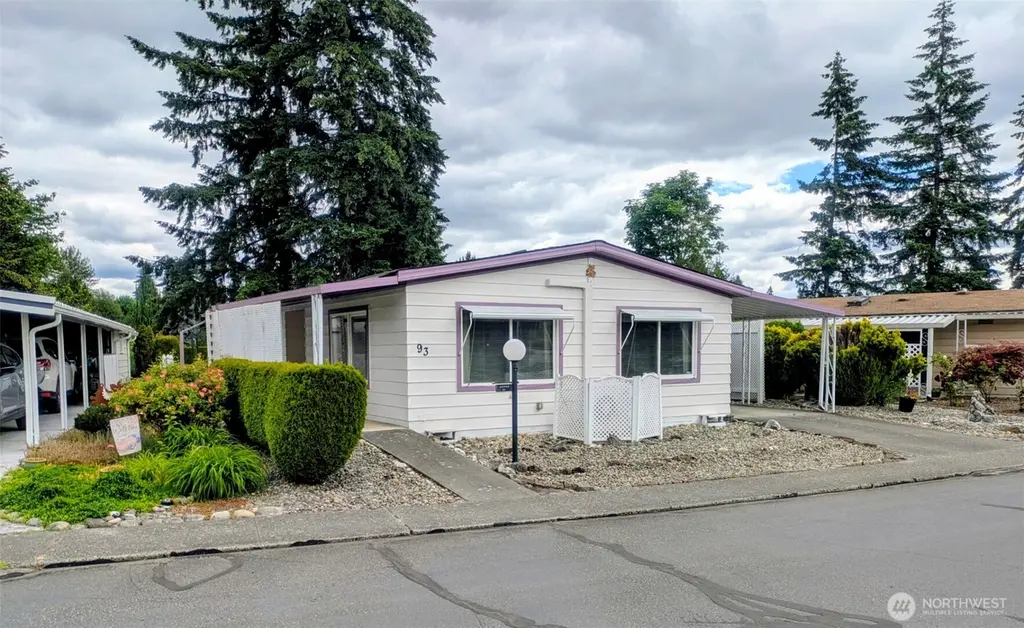
201 Union Ave SE #93 · Renton, WA
Flood risk 1/10 · Minimal
- FEMA flood zone
- X (unshaded)
- Chance of flooding over 30 yrs
- 0.0%
- Est. flood insurance / yr
- $507 – $1,088
Fire risk 1/10 · Minimal
- Est. fire insurance / yr
- $604 – $1,122
Heat risk 3/10 · Minor
- Hot days now (above 86°F)
- 7 days/yr
- Hot days in 30 yrs
- 15 days/yr
Wind risk 1/10 · Minimal
- Chance of severe wind over 30 yrs
- —
Air-quality risk 7/10 · Major
- Unhealthy air days now
- 10 days/yr
- Unhealthy air days in 30 yrs
- 11 days/yr
Risk factors via First Street. Map © Google.
Why this score? — see what drove the B grade
The composite is a weighted blend of 9 inputs, each scored 0–100. Each bar is that input's sub-score; the figure is the points it added to the 100-point composite (weight × sub-score).
- Cash flow +30.0/30.0
- 1% rule +10.0/10.0
- DSCR +10.0/10.0
- ARV discount +7.5/15.0
- Schools +4.7/10.0
- Livability +4.2/5.0
- Rent growth +2.6/5.0
- Condition / age +2.2/5.0
- Appreciation +0.0/10.0
$75,000
🖨 Deal sheet 📄 Offer letter ✓ Due diligence
Listing remarks
Perfect location in Leisure Estates, a 55+ manufactured home community in the Renton Highlands. You will love the features of this 1248 sq. ft. home. First of all, it's located in a perfect spot in the park. Close to the clubhouse on the upper hill side . . . only a short walk down the path to get your mail or swim in the pool! The home offers 2 bedrooms and 1.75 bathrooms. The primary bedroom has a walk-in closet and additional storage. You will enjoy the convenience of stepping outside the slider from the primary bedroom to the private patio out back. What a relaxing way to enjoy your morning coffee. The home offers vaulted ceilings allowing for a larger feel, and vinyl windows for effici
Key facts
- Vinyl windows
- Huge shop
- Private patio
Tags
Property features AI
Finance
- Other: Buyer brokerage compensation: 3%
- Financial info: Listing terms: Cash; Land lease amount: $1,485
- HOA & community: Located in Leisure Estates manufactured home park; Park approved for sale; Senior community; Park amenities: clubhouse, exercise room, golf, pool, recreational area, RV parking, sauna, security gate, sidewalks, spa/hot tub; Approximately 254 homes in the park; Bus line nearby; Land lease payment not included here
Exterior
- Parking: Carport
- Security: Security gate (community)
- Utilities: Public water; City of Renton water service; City of Renton sewer service; PSE power; Electric energy source; Water heater in outside closet
- Home design: Manufactured double-wide home; One story; Double wide layout; Entry level information not specified; Facing direction not specified
- Construction: Metal/Vinyl construction materials; Composition roof; Manufactured after 6/15/1976
- Exterior features: Patio/porch/deck; Landscaped; Metal/vinyl exterior; Has view; Spa/Hot Tub (community amenity)
Interior
- Kitchen: Disposal; Refrigerator; Stove/Range
- Bedrooms: 2 bedrooms
- Flooring: Laminate; Vinyl; Carpet
- Bathrooms: 1 full bath; 1 three-quarter bath; 1 bathtub; 1 shower
- Heating & cooling: Ductless heating; Forced air heating; Has cooling
- Interior features: Vaulted ceilings; Walk-in closet; Dining room; Living room; Kitchen with eating space; Utility room; Electric fireplace
- Laundry & utility: Washer; Dryer; Utility room
Neighborhood map
What this means for you Summary
Snapshot
- This is a 2-bed/2.0-bath manufactured listed at $75k. Condition is rated fair.
Deal economics
- At list price, monthly cash flow is $1k ($17k/yr) — positive.
- The deal already cash-flows at list — no discount required.
- Meets the 1% rule at list price ($2k rent vs $75k).
- Cap rate 29.0% vs local median 2.3% in Renton — top-decile yield for the area; either an underpriced asset or a hidden risk that comps aren't pricing in. Stress-test before assuming the spread holds.
Location & tenants
- Location reads 83/100 on livability (#52 in WA, #949 nationally) — a professional / high-income tenant draw. Strengths: amenities A+, commute A+, employment A+; Watch: crime D-, cost of living F.
- Renton School District (urban): math 47% / reading 55% proficiency, ranked #119 of 291 in WA (top 41%) — acceptable for families but not a draw, mixed tenant base, ~2y average lease.
- Market conditions: Rents flat; 255 active listings in the ZIP; 24 comparable units currently listed for rent nearby; rentals leasing fast (median 12d on market — plan ~1-2 weeks tenant-placement turnaround); high-income renter base; 10,555 units permitted in King County in 2024 (7,119 in 5+ unit buildings).
Forward outlook
- Local home prices are declining (-3.0%/yr); year-one equity from $519 of loan paydown is wiped out by about $2k of value loss. Plan a longer hold.
- King County population projected at +44% by 2050 — long-run rental-demand tailwind backs the buy-and-hold thesis.
- At projected returns (-3.0% appreciation + 0.3% rent growth), your $21k cash investment doubles in ~2 years — after that, you're playing with house money.
Negotiation context
- Only 14 days on market — expect competitive offers; lowballing is unlikely to land.
- 2 sale attempts since 21y ago with the ask held roughly flat each time — persistent listings suggest the price (not the market) is what's stuck; bring a comps-based counter.
- Current owner paid $55k; 36% above their basis — modest negotiation headroom, anchor on the comps not their cost.
Questions for the listing agent
- Have any recent inspections been done? Can we get a copy of the seller's disclosures and any deferred-maintenance estimates?
- Built in 1979 — when were the roof, HVAC, electrical panel, plumbing, and water heater last replaced?
- Is there a deadline driving the sale (1031 exchange, divorce, estate, relocation)? That informs how much negotiation room exists.
- Schools are B-rated — typically a magnet for longer-tenancy family renters. What's the average tenant stay here, and is there a school-zone premium baked into asking?
- Crime grade is D in this area — have there been break-ins, vandalism, or insurance claims at this property in the last 3 years? What carrier currently insures it and at what premium?
- What's the average days-on-market for RENTAL listings here right now (not sales)? A rising rental-DOM trend means longer vacancies and softer asking-rent achievability than the comps imply.
- What's the recent tenant-quality profile in this submarket — average credit score on applications, eviction rate, late-payment / NSF rate, and stable-employment percentage? A property-management company in the area should have these aggregated.
- How much new for-sale + rental construction is in the pipeline within 1–3 miles? Heavy new supply typically softens prices + rents 12–24 months out; constrained supply supports both.
Investment metrics
- 1% rule
- 3.27% ✓
- Cap rate
- 28.98%
- Cash-on-cash
- 81.04%
- DSCR
- 4.61
- GRM
- 2.5
CMA / ARV
- ARV (on-the-fly)
- $172,224
- Comps found
- 12
Show comp detail 12 sales within ~0.75 mi
| Address | Dist | Beds/Ba | Sqft | Sold | Price | $/sf | Match |
|---|---|---|---|---|---|---|---|
| 201 Union Ave SE #217 | 0.00mi | 2/2.0 | 1,248 (0%) | 2mo | $110,000 | $88 | 98 |
| 201 Union Ave SE #235 | 0.00mi | 2/2.0 | 1,248 (0%) | 12mo | $148,950 | $119 | 90 |
| 201 Union Ave SE #155 | 0.22mi | 2/2.0 | 1,248 (0%) | 1mo | $175,000 | $140 | 89 |
| 201 Union Ave SE #112 | 0.01mi | 2/2.0 | 1,339 (+7%) | 2mo | $86,000 | $64 | 86 |
| 201 Union Ave SE #247 | 0.00mi | 2/2.0 | 1,344 (+8%) | 5mo | $175,000 | $130 | 83 |
| 375 Union Ave SE #61 | 0.19mi | 2/2.0 | 1,300 (+4%) | 4mo | $180,000 | $138 | 80 |
| 201 Union Ave SE #136 | 0.00mi | 2/2.0 | 1,152 (-8%) | 11mo | $125,000 | $109 | 78 |
| 375 Union Ave SE #136 | 0.10mi | 3/2.0 (+1) | 1,344 (+8%) | 0mo | $192,448 | $143 | 77 |
| 201 Union Ave SE #249 | 0.22mi | 2/2.0 | 1,344 (+8%) | 4mo | $185,500 | $138 | 74 |
| 201 Union Ave SE #231 | 0.04mi | 3/2.0 (+1) | 1,344 (+8%) | 14mo | $140,000 | $104 | 69 |
| 375 Union Ave SE #97 | 0.10mi | 3/2.0 (+1) | 1,344 (+8%) | 10mo | $237,900 | $177 | 69 |
| 375 Union Ave SE #62 | 0.10mi | 2/1.5 | 1,120 (-10%) | 13mo | $175,000 | $156 | 65 |
Match score weights: distance 35% · size 25% · config 20% · recency 20%. Top-matched comps best support the ARV.
Projected returns pro-forma
-3.0% appreciation · 0.29% rent growth · sell at horizon
- IRR
- 78.2%
- Equity multiple
- 4.41×
- Total profit
- $71,704
- Equity at exit
- $11,183
- IRR
- 81.0%
- Equity multiple
- 8.31×
- Total profit
- $153,606
- Equity at exit
- $6,485
Cash invested: $21,000 (down + closing). Projections, not guarantees.
Landlord ↔ Tenant lean methodology
- Overall (STATE)
- 28 Tenant-Leaning
- State Washington
- 28 Tenant-Leaning · D+8
- County
- — inherits STATE
- City
- — inherits STATE
ZIP-level market 98059
- Rents YoY
- 0.3%
- Active inventory
- 255
- Price-to-rent
- 2.5×
Monthly cashflow live
- Estimated rent
- $2,451 high interval (Pro) →
- Mortgage (P&I)
- −$393
- Tax est. 1.5%
- −$94 /mo · $1,125/yr
- Insurance
- −$31
- HOA
- −$0
- Vacancy / Maint / Mgmt
- −$515
- Net cashflow
- $1,418
Break-even live
UW: 25.0% down · 7.5% · 30yr · 1.5% tax · 5.0% vac · 8.0% maint · 8.0% mgmt
Financing live
Cash to close
- Down payment
- $18,750
- Closing costs
- $2,250
- Reserves months
- —
- Total cash needed
- —
Loan-product check · same deal, 3 products live
Conventional
25% down · 7.5% · 30yr
- Down + closing
- —
- Monthly P&I
- —
- Monthly cashflow
- —
- DSCR
- —
- Eligible?
- —
Personal DTI + credit; lowest rate.
DSCR
20% down · 8.5% · 30yr
- Down + closing
- —
- Monthly P&I
- —
- Monthly cashflow
- —
- DSCR
- —
- Eligible?
- —
No personal income docs; deal must DSCR.
Hard money
10% down · 12.0% · 12mo
- Down + closing
- —
- Monthly P&I
- —
- Monthly cashflow
- —
- DSCR
- —
- Eligible?
- —
Short-term bridge; refi at stabilization.
Rent comps 24 comps
| Address | Beds | Baths | Sqft | Rent | $/sqft | DOM | Units | Dist |
|---|---|---|---|---|---|---|---|---|
| 4214 SE 1st Pl Renton, WA | 3.0 | 1.0 | 950 | $2,950 | $3.11 | 24d | 1 | 0.17mi |
| 3815 NE 4th St Renton, WA | 2.0 | 1.0 | 666 | $2,199 | $3.30 | 2d | 22 | 0.49mi |
| 3788 NE 4th St Renton, WA | 1.0–2.0 | 1.0–2.0 | 701 | $1,904 | $2.72 | 1d | 8 | 0.67mi |
| 4231 NE 5th St Unit D203 Renton, WA | 2.0 | 2.0 | 1025 | $2,200 | $2.15 | 10d | 1 | 0.67mi |
| 4415 NE 5th St Renton, WA | 1.0–3.0 | 1.0–2.0 | 923 | $2,370 | $2.57 | 1d | 10 | 0.76mi |
| 5027 NE 5th Pl Renton, WA | 3.0 | 2.5 | 1287 | $3,300 | $2.56 | 23d | 1 | 0.91mi |
| 2904 SE 8th St #2128 Renton, WA | 2.0 | 2.0 | 1046 | $2,450 | $2.34 | 43d | 1 | 0.92mi |
| 650 Duvall Ave NE Renton, WA | 1.0–2.0 | 1.0–2.0 | 849 | $2,427 | $2.86 | 3d | 12 | 0.92mi |
| 15205 140th Way SE Renton, WA | 1.0–3.0 | 1.0–2.0 | 1121 | $2,960 | $2.64 | 1d | 10 | 0.97mi |
| 2511 NE 4th St Renton, WA | 2.0 | 1.5 | 1008 | $1,900 | $1.88 | 2d | 1 | 1.10mi |
| 3507 NE 8th St Renton, WA | 3.0 | 1.0 | 960 | $2,650 | $2.76 | 18d | 1 | 1.10mi |
| 653 Index Pl NE Renton, WA | 2.0 | 1.0 | 720 | $2,395 | $3.33 | 24d | 1 | 1.12mi |
| 2307 NE 4th St Renton, WA | 1.0–2.0 | 1.0–2.0 | 740 | $2,259 | $3.05 | 1d | 14 | 1.14mi |
| 802 Harrington Ave NE Renton, WA | 2.0 | 1.0 | 828 | $1,750 | $2.11 | 3d | 1 | 1.26mi |
| 270 Bronson Way NE Unit The Hampton H22 Renton, WA | 2.0 | 1.0 | 1000 | $2,250 | $2.25 | 43d | 1 | 1.34mi |
| 330 Vuemont Pl NE Renton, WA | 2.0 | 1.0 | 791 | $1,962 | $2.48 | 5d | 7 | 1.37mi |
| 950 Harrington Ave NE Renton, WA | 1.0–2.0 | 1.0–2.0 | 868 | $2,853 | $3.29 | 1d | 11 | 1.40mi |
| 351 Vuemont Pl NE Renton, WA | 1.0–2.0 | 1.0–1.5 | 755 | $1,750 | $2.32 | 12d | 3 | 1.41mi |
| 913 Harrington Ave NE Renton, WA | 2.0 | 1.0 | 751 | $1,895 | $2.52 | 3d | 3 | 1.43mi |
| 913 Harrington Ave NE Unit 1 Renton, WA | 1.0 | 1.0 | 700 | $1,710 | $2.44 | 11d | 1 | 1.43mi |
| 913 Harrington Ave NE Unit 6 Renton, WA | 2.0 | 1.0 | 770 | $1,860 | $2.42 | 11d | 1 | 1.43mi |
| 913 Harrington Ave NE Apt 3 Renton, WA | 2.0 | 1.0 | 800 | $1,930 | $2.41 | 11d | 1 | 1.43mi |
| 1013 Kirkland Ave NE Unit 3 Renton, WA | 2.0 | 1.5 | 700 | $1,750 | $2.50 | 24d | 1 | 1.44mi |
| 906 Glennwood Ave NE Renton, WA | 2.0 | 1.0 | 850 | $1,595 | $1.88 | 24d | 1 | 1.44mi |
Listing history 10 events
-
2026-06-18days on market $75,000 Active 14 DOM
-
2026-06-17days on market $75,000 Active 13 DOM
-
2026-06-16days on market $75,000 Active 12 DOM
-
2026-06-15days on market $75,000 Active 11 DOM
-
2026-06-13days on market $75,000 Active 9 DOM
-
2026-06-13days on market $75,000 Active 8 DOM
-
2026-06-09days on market $75,000 Active 5 DOM
-
2026-06-08days on market $75,000 Active 4 DOM
-
2026-06-07remarks 699-char remark
-
2026-06-07$75,000 Active 3 DOM
ⓘ Source: listings_history table (triggers on properties + properties_extension) + one-shot
backfill from property_details.listing_events for pre-trigger history.
Climate risk First Street
- Flood 1/10 Low FEMA zone X (unshaded) · 0% chance over 30 yrs
- Wildfire 1/10 Low
- Heat 3/10 Moderate 7 d/yr ≥86°F today · 15 d/yr by 30 yrs out
- Wind 1/10 Low
- Air quality 7/10 Severe 10 unhealthy d/yr today · 11 by 30 yrs out
Nearby sold comps map
Loading sold comps map…
Walkable amenities ~0.75 mi
Loading nearby amenities…
Taxation est. · year 1
- Rental income
- $29,416
- − Mortgage interest
- −$4,201
- − Property taxes
- −$1,125
- − Insurance
- −$375
- − Repairs & maintenance
- −$2,353
- − Management
- −$2,353
- − Depreciation
- −$2,182
- Taxable income
- $16,826
- Est. tax owed @ 24.0%
- −$4,038
- After-tax cash flow
- $12,981/yr
For passive investors: Depreciation is non-cash, so a rental often shows a tax loss while cash-flowing — sheltering income. Rental losses are passive: they offset passive income freely, and up to $25,000/yr can offset ordinary (W-2) income if you actively participate and your MAGI is under $100k (phasing out to $0 by $150k); unused losses carry forward. On sale, claimed depreciation is recaptured at up to 25%, and gains may owe capital-gains tax (a 1031 exchange can defer both). Figures are a year-1 estimate at your 24.0% rate — not tax advice; consult a CPA.
Condition & rehab AI · 12 photos
This manufactured home requires moderate repairs and maintenance to improve its condition and value. Painting the exterior and replacing the carpet would significantly enhance its curb appeal and resale potential.
Repairs flagged
- Minor exterior siding — Some discoloration
- Minor interior paint — Some wear
Value-add opportunities
- Both paint exterior — Enhances curb appeal and resale value
- Both replace carpet — Improves comfort and resale value
Renovation cost estimate screening
| Repair item | Severity | Est. cost |
|---|---|---|
| exterior siding · Some discoloration | Minor | $500–3,000 |
| interior paint · Some wear | Minor | $500–3,000 |
| Total estimated repair cost · 2 items | $1,000–6,000 |
Value-add ROI direction
- Both paint exterior — Enhances curb appeal and resale value ↑
- Both replace carpet — Improves comfort and resale value ↑
ⓘ Cost ranges are severity-bucket heuristics (US national rule-of-thumb). Get contractor quotes + a written scope before underwriting a rehab budget.
Schools (NCES district)
- District
- Renton School District
- NCES district ID
- 5307230
- Math proficiency
- 47% ▼ -1.00%
- Reading proficiency
- 55% ▼ -1.00%
- Median HH income
- $66,354
- Composite
- 47.13/100
- National rank
- #5108
- State rank
- #119 of 291 in WA
Livability — Renton
- Score
- 83/100
- State rank
- #52
- US rank
- #949
Category grades
Schools grade is shown separately in the Schools card above.
Census & demographics
- Census place
- Renton, WA
- County
- King County · 2,251,916 people
- City population
- 158,600
- Metro
- Seattle-Tacoma-Bellevue, WA
- Population (ZIP)
- 42,406
- Household income
- $138,654
- Rent vs Own
- Severe rent burden
- 908.0
Population outlook (King County) Hauer SSP2
- Today (2025)
- 2,576,485 people
- By 2030
- 2,803,316 · +8.8%
- By 2040
- 3,255,921 · +26.4%
- By 2050
- 3,706,444 · +43.9%
- By 2075
- 4,746,063 · +84.2%
- By 2100
- 5,407,730 · +109.9%
Race, ethnicity, and origin ACS 2023
- Neighborhood character
- Diverse neighborhood (Simpson 0.68)
- Race & ethnicity
- White 48% Asian 29% Two or more races 15% Hispanic / Latino 9% Black 2%
- Hispanic origin (detail)
- Mexican 5%
- Common ancestry
- Portuguese 3% Italian 3% Slovak 2%
- Foreign-born
- 23% · China, Vietnam, Canada
- Languages at home
- 67% English-only · Chinese 9% Vietnamese 6% Spanish 5%
Political lean MEDSL · King
- 2024 margin
- Solid D (+51.7) · D 74.2% · R 22.5% · Other 3.4%
- 2008→2024 swing
- +9.6pp toward D · 2008: 42.1pp · 2024: 51.7pp
- All cycles
- 2024: D+51.7 2020: D+52.7 2016: D+50.4 2012: D+39.9 2008: D+42.1
Not yet ingested
- Civics
- —
Market trends
- HPI YoY
- ▼ -920.66%
- Current HPI
- 338.4495
- Rent YoY
- ▲ 0.29%
- Metro
- Seattle-Tacoma-Bellevue, WA
- State GDP YoY
- ▲ 4.65%
- F500 in state
- 22
Industry mix (Fortune 500 HQ in WA)
| Industry | F500 HQs | Revenue |
|---|---|---|
| Retail | 2 | $269B |
|
||
| Technology / Retail | 1 | $638B |
|
||
| Technology | 1 | $245B |
|
||
| Telecommunications | 1 | $38B |
|
||
| Food / Beverage | 1 | $36B |
|
||
| Automotive / Trucks | 1 | $34B |
|
||
Price history
+25.0% since first listed3 events — show timeline
- 2026-06-04 Listed $75,000 NWMLS as Distributed by MLS Grid
- 2005-04-21 Sold (MLS) $55,000 NWMLS as Distributed by MLS Grid
- 2005-04-06 Listed $59,990 NWMLS as Distributed by MLS Grid
Cash-flow waterfall
monthlySold comps — $/sqft
last 12 mo · ≤1 miLoading sold comps…