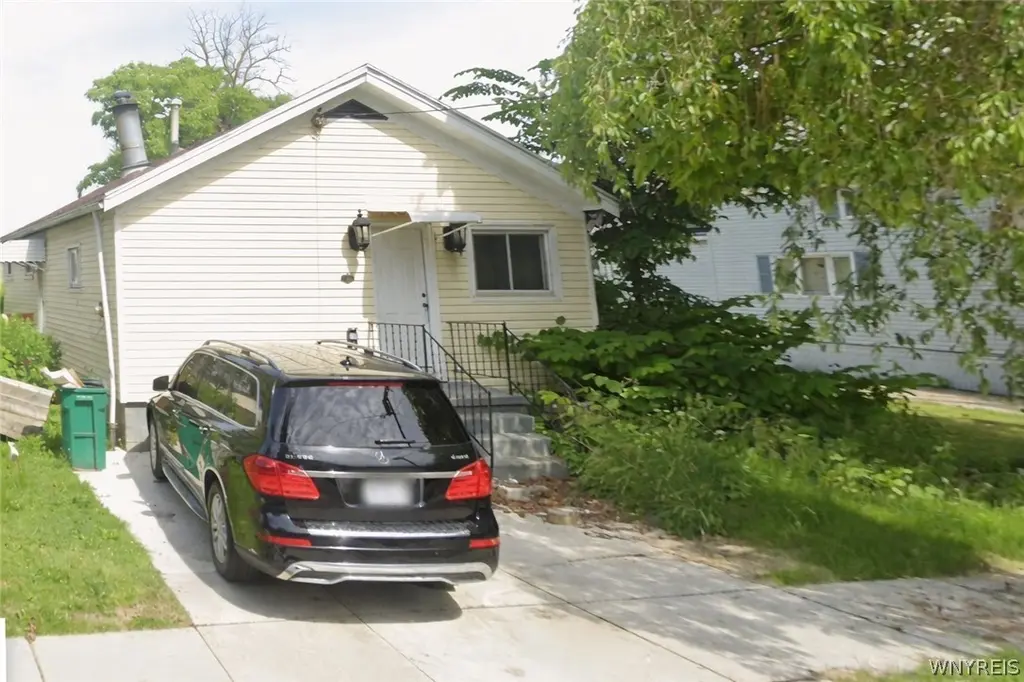
126 Bushnell St · Buffalo, NY
Flood risk 1/10 · Minimal
- FEMA flood zone
- X (unshaded)
- Chance of flooding over 30 yrs
- 0.0%
- Est. flood insurance / yr
- $507 – $1,088
Fire risk 1/10 · Minimal
- Est. fire insurance / yr
- $691 – $1,283
Heat risk 3/10 · Minor
- Hot days now (above 92°F)
- 7 days/yr
- Hot days in 30 yrs
- 15 days/yr
Wind risk 1/10 · Minimal
- Chance of severe wind over 30 yrs
- —
Air-quality risk 3/10 · Minor
- Unhealthy air days now
- 2 days/yr
- Unhealthy air days in 30 yrs
- 3 days/yr
Risk factors via First Street. Map © Google.
Why this score? — see what drove the B grade
The composite is a weighted blend of 9 inputs, each scored 0–100. Each bar is that input's sub-score; the figure is the points it added to the 100-point composite (weight × sub-score).
- Cash flow +26.2/30.0
- ARV discount +11.6/15.0
- Appreciation +9.0/10.0
- DSCR +8.8/10.0
- 1% rule +7.0/10.0
- Livability +3.9/5.0
- Schools +3.3/10.0
- Rent growth +2.5/5.0
- Condition / age +2.5/5.0
$90,000
🖨 Deal sheet 📄 Offer letter ✓ Due diligence
Listing remarks MLS
VRP - Seller will consider offers between $90,000 and $110,000. Like New! New flooring throughout, new furnace (in crawlspace), new hot water tank (in first floor laundry room), new light fixtures, remodeled bath, 2-year-old roof, updated kitchen with new vent and gas hookup for stove, vinyl windows, some new doors and trim, freshly painted throughout. Loads of storage room - pull down staircase to attic, large shed, and spacious laundry rom. Located on a quiet, low traffic, dead end street. Off street concrete parking pad. Easy access to the 190. Conveniently located right between Filmore and Bailey for all stores and activities.
Key facts
- 2 year old roof
- New furnace
- New hot water tank
Tags
Neighborhood map
What this means for you Summary
Snapshot
- This is a 2-bed/1.0-bath single-family listed at $90k.
Deal economics
- At list price, monthly cash flow is $229 ($3k/yr) — positive.
- The deal already cash-flows at list — no discount required.
- Meets the 1% rule at list price ($1k rent vs $90k).
- Recommended offer: $87k (3.0% below list) — sets the bar for market timing.
Location & tenants
- Location reads 77/100 on livability (#195 in NY, #3,011 nationally) — a middle-class / working-renter tenant base. Strengths: commute A+, housing A+, health & safety A+; Watch: crime F, employment D-.
- Buffalo City School District (urban): math 41% / reading 40% proficiency, ranked #535 of 590 in NY (top 91%) — families likely to look elsewhere, expect single-tenant / working-renter base with shorter leases; 75% free/reduced lunch — lower-income household profile, screen leases tightly.
- Market conditions: 169 active listings in the ZIP; 7 comparable units currently listed for rent nearby; rentals at typical pace (median 24d on market — plan ~3-4 weeks tenant-placement turnaround); 43% of comp listings sitting > 30 days — soft ceiling on asking rent; 1,244 units permitted in Erie County in 2024 (563 in 5+ unit buildings).
Forward outlook
- In year one you build about $8k of equity ($622 loan paydown + $7k appreciation (8.1% local appreciation)).
- At projected returns (8.1% appreciation + 3.0% rent growth), your $25k cash investment doubles in ~3 years — after that, you're playing with house money.
- By year 5, paydown + projected appreciation supports a ~$36k cash-out refi (75% LTV) — recoverable capital for the next deal without selling this one.
Negotiation context
- It's been on market 49 days — a 3% lower offer ($87k) is reasonable based on typical stale-listing flexibility.
- 2 sale attempts; this cycle's ask has dropped $10k (10%) from the opening price — seller is motivated, your offer sets the floor, not the list.
- Current owner paid $37k; list at $90k implies a 143% gain — meaningful room to come down on a strong offer.
Risks & watch-outs
- Watch-outs: built in 1940 — expect roof / HVAC / electrical / plumbing capex.
Questions for the listing agent
- It's been on market 49 days. Have you received any prior offers? Is the seller open to a 3% concession, seller financing, or rate buy-down credit?
- Built in 1940 — when were the roof, HVAC, electrical panel, plumbing, and water heater last replaced?
- Is there a deadline driving the sale (1031 exchange, divorce, estate, relocation)? That informs how much negotiation room exists.
- Crime grade is F in this area — have there been break-ins, vandalism, or insurance claims at this property in the last 3 years? What carrier currently insures it and at what premium?
- What's the average days-on-market for RENTAL listings here right now (not sales)? A rising rental-DOM trend means longer vacancies and softer asking-rent achievability than the comps imply.
- What's the recent tenant-quality profile in this submarket — average credit score on applications, eviction rate, late-payment / NSF rate, and stable-employment percentage? A property-management company in the area should have these aggregated.
- How much new for-sale + rental construction is in the pipeline within 1–3 miles? Heavy new supply typically softens prices + rents 12–24 months out; constrained supply supports both.
Investment metrics
- 1% rule
- 1.20% ✓
- Cap rate
- 9.34%
- Cash-on-cash
- 10.89%
- DSCR
- 1.48
- GRM
- 7.0
CMA / ARV
- ARV (median comp)
- $98,911
- List price
- $90,000
- Delta
- -9.01%
- Verdict
- FAIR
- Comps
- 7 within 1.0 mi
Projected returns pro-forma
8.06% appreciation · 3.0% rent growth · sell at horizon
- IRR
- 28.6%
- Equity multiple
- 3.06×
- Total profit
- $51,999
- Equity at exit
- $68,733
- IRR
- 25.6%
- Equity multiple
- 6.56×
- Total profit
- $140,089
- Equity at exit
- $136,777
Cash invested: $25,200 (down + closing). Projections, not guarantees.
Landlord ↔ Tenant lean methodology
- Overall (STATE)
- 15 Strongly Tenant-Friendly
- State New York
- 15 Strongly Tenant-Friendly · D+10
- County
- — inherits STATE
- City
- — inherits STATE
ZIP-level market 14206
- Home prices YoY
- 1.8%
- Active inventory
- 169
- Price-to-rent
- 7.0×
Monthly cashflow live
- Estimated rent
- $1,077 high interval (Pro) →
- Mortgage (P&I)
- −$472
- Tax est. 1.5%
- −$112 /mo · $1,350/yr
- Insurance
- −$38
- HOA
- −$0
- Vacancy / Maint / Mgmt
- −$226
- Net cashflow
- $229
Break-even live
UW: 25.0% down · 7.5% · 30yr · 1.5% tax · 5.0% vac · 8.0% maint · 8.0% mgmt
Financing live
Cash to close
- Down payment
- $22,500
- Closing costs
- $2,700
- Reserves months
- —
- Total cash needed
- —
Loan-product check · same deal, 3 products live
Conventional
25% down · 7.5% · 30yr
- Down + closing
- —
- Monthly P&I
- —
- Monthly cashflow
- —
- DSCR
- —
- Eligible?
- —
Personal DTI + credit; lowest rate.
DSCR
20% down · 8.5% · 30yr
- Down + closing
- —
- Monthly P&I
- —
- Monthly cashflow
- —
- DSCR
- —
- Eligible?
- —
No personal income docs; deal must DSCR.
Hard money
10% down · 12.0% · 12mo
- Down + closing
- —
- Monthly P&I
- —
- Monthly cashflow
- —
- DSCR
- —
- Eligible?
- —
Short-term bridge; refi at stabilization.
Rent comps 7 comps
| Address | Beds | Baths | Sqft | Rent | $/sqft | DOM | Units | Dist |
|---|---|---|---|---|---|---|---|---|
| 47 Lester St Unit Main Floor Buffalo, NY | 3.0 | 1.0 | 900 | $1,000 | $1.11 | 44d | 1 | 0.51mi |
| 118 Detroit St Unit 1 Buffalo, NY | 2.0 | 1.0 | 620 | $850 | $1.37 | 44d | 1 | 0.95mi |
| 118 Detroit St Buffalo, NY | 2.0 | 1.0 | 620 | $850 | $1.37 | 23d | 1 | 0.95mi |
| 674 Clinton St Unit 6 Buffalo, NY | 1.0 | 1.0 | 800 | $1,650 | $2.06 | 14d | 1 | 1.07mi |
| 950 Broadway Unit 307 Buffalo, NY | 1.0 | 1.0 | 675 | $940 | $1.39 | 3d | 1 | 1.24mi |
| 700 Hopkins St Buffalo, NY | 3.0 | 1.0 | 1100 | $1,225 | $1.11 | 14d | 1 | 1.41mi |
| 696 Hopkins St Unit 2 Buffalo, NY | 2.0 | 1.0 | 750 | $950 | $1.27 | 44d | 1 | 1.42mi |
Listing history 6 events
-
2026-05-07price $90,000 643-char remark
Show marketing remark (643 chars)
VRP - Seller will consider offers between $90,000 and $110,000. Like New! New flooring throughout, new furnace (in crawlspace), new hot water tank (in first floor laundry room), new light fixtures, remodeled bath, 2-year-old roof, updated kitchen with new vent and gas hookup for stove, vinyl windows, some new doors and trim, freshly painted throughout. Loads of storage room - pull down staircase to attic, large shed, and spacious laundry rom. Located on a quiet, low traffic, dead end street. Off street concrete parking pad. Easy access to the 190. Conveniently located right between Filmore and Bailey for all stores and activities.
-
2026-04-01$100,000 Active 643-char remark
Show marketing remark (643 chars)
VRP - Seller will consider offers between $90,000 and $110,000. Like New! New flooring throughout, new furnace (in crawlspace), new hot water tank (in first floor laundry room), new light fixtures, remodeled bath, 2-year-old roof, updated kitchen with new vent and gas hookup for stove, vinyl windows, some new doors and trim, freshly painted throughout. Loads of storage room - pull down staircase to attic, large shed, and spacious laundry rom. Located on a quiet, low traffic, dead end street. Off street concrete parking pad. Easy access to the 190. Conveniently located right between Filmore and Bailey for all stores and activities.
-
2026-03-29historical
-
2025-12-26price $89,900
-
2025-12-11$109,900 Active
-
1994-06-09soldstatus $37,000
ⓘ Source: listings_history table (triggers on properties + properties_extension) + one-shot
backfill from property_details.listing_events for pre-trigger history.
Climate risk First Street
- Flood 1/10 Low FEMA zone X (unshaded) · 0% chance over 30 yrs
- Wildfire 1/10 Low
- Heat 3/10 Moderate 7 d/yr ≥92°F today · 15 d/yr by 30 yrs out
- Wind 1/10 Low
- Air quality 3/10 Moderate 2 unhealthy d/yr today · 3 by 30 yrs out
Nearby sold comps map
Loading sold comps map…
Walkable amenities ~0.75 mi
Loading nearby amenities…
Taxation est. · year 1
- Rental income
- $12,923
- − Mortgage interest
- −$5,041
- − Property taxes
- −$1,350
- − Insurance
- −$450
- − Repairs & maintenance
- −$1,034
- − Management
- −$1,034
- − Depreciation
- −$2,618
- Taxable income
- $1,396
- Est. tax owed @ 24.0%
- −$335
- After-tax cash flow
- $2,411/yr
For passive investors: Depreciation is non-cash, so a rental often shows a tax loss while cash-flowing — sheltering income. Rental losses are passive: they offset passive income freely, and up to $25,000/yr can offset ordinary (W-2) income if you actively participate and your MAGI is under $100k (phasing out to $0 by $150k); unused losses carry forward. On sale, claimed depreciation is recaptured at up to 25%, and gains may owe capital-gains tax (a 1031 exchange can defer both). Figures are a year-1 estimate at your 24.0% rate — not tax advice; consult a CPA.
Schools (NCES district)
- District
- Buffalo City School District
- NCES district ID
- 3605850
- Math proficiency
- 41% ▲ 11.00%
- Reading proficiency
- 40% ▲ 7.00%
- Median HH income
- $31,665
- Composite
- 33.17/100
- National rank
- #5544
- State rank
- #535 of 590 in NY
Livability — Buffalo
- Score
- 77/100
- State rank
- #195
- US rank
- #3011
Category grades
Schools grade is shown separately in the Schools card above.
Census & demographics
- Census place
- Buffalo, NY
- County
- Erie County · 714,559 people
- City population
- 440,021
- Metro
- Buffalo-Cheektowaga, NY
- Population (ZIP)
- 21,631
- Household income
- $50,450
- Rent vs Own
- Severe rent burden
- 841.0
Population outlook (Erie County) Hauer SSP2
- Today (2025)
- 933,037 people
- By 2030
- 935,181 · +0.2%
- By 2040
- 928,531 · -0.5%
- By 2050
- 905,725 · -2.9%
- By 2075
- 834,037 · -10.6%
- By 2100
- 708,033 · -24.1%
Race, ethnicity, and origin ACS 2023
- Neighborhood character
- Majority White (65%)
- Race & ethnicity
- White 65% Hispanic / Latino 13% Black 12% Two or more races 8% Asian 4%
- Hispanic origin (detail)
- Mexican 2% Puerto Rican 10%
- Common ancestry
- Romanian 25% Lithuanian 1% Italian 1%
- Foreign-born
- 6% · Canada, China
- Languages at home
- 88% English-only · Spanish 5% Other Indo-European 3% Arabic 2%
Political lean MEDSL · Erie
- 2024 margin
- Lean D (+9.7) · D 54.8% · R 45.2%
- 2008→2024 swing
- -7.9pp toward R · 2008: 17.5pp · 2024: 9.7pp
- All cycles
- 2024: D+9.7 2020: D+14.7 2016: D+4.8 2012: D+15.6 2008: D+17.5
Not yet ingested
- Civics
- —
Market trends
- HPI YoY
- ▲ 8.06%
- Current HPI
- 457.3935
- Rent YoY
- —
- Metro
- Buffalo-Cheektowaga, NY
- State GDP YoY
- ▲ 2.60%
- F500 in state
- 92
Industry mix (Fortune 500 HQ in NY)
| Industry | F500 HQs | Revenue |
|---|---|---|
| Financial Services | 10 | $950B |
|
||
| Consumer Goods | 9 | $162B |
|
||
| Insurance | 4 | $225B |
|
||
| Telecommunications | 2 | $144B |
|
||
| Pharmaceuticals | 2 | $112B |
|
||
| Media / Entertainment | 2 | $69B |
|
||
Price history
+143.2% since first listed6 events — show timeline
- 2026-05-07 Price Changed $90,000 WNYREIS
- 2026-04-01 Listed $100,000 WNYREIS
- 2026-03-29 Listing Removed — WNYREIS
- 2025-12-26 Price Changed $89,900 WNYREIS
- 2025-12-11 Listed $109,900 WNYREIS
- 1994-06-09 Sold (Public Records) $37,000 Public Records
Property tax history
+0.1%/yrLatest (2025): $163 · +0.0% YoY. Source: county tax records.
Cash-flow waterfall
monthlySold comps — $/sqft
last 12 mo · ≤1 miLoading sold comps…