 🏷️ Likely Rental
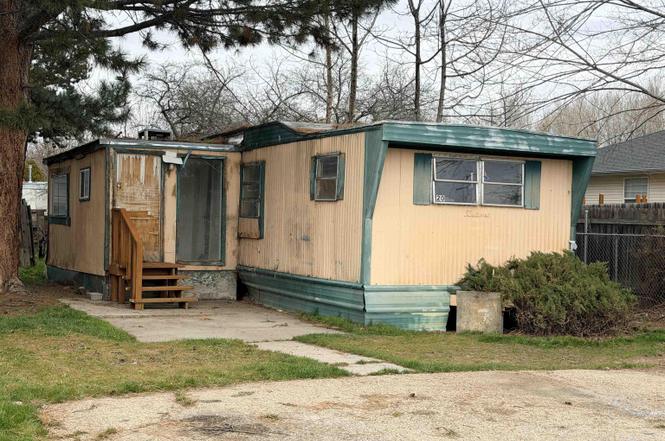
412 E 48th St #20 · Garden City, ID
Flood risk 2/10 · Minimal
- FEMA flood zone
- AE
- Chance of flooding over 30 yrs
- 0.03%
- Est. flood insurance / yr
- $1,737 – $8,500
Fire risk 4/10 · Minor
- Est. fire insurance / yr
- $584 – $1,086
Heat risk 4/10 · Minor
- Hot days now (above 96°F)
- 7 days/yr
- Hot days in 30 yrs
- 18 days/yr
Wind risk 1/10 · Minimal
- Chance of severe wind over 30 yrs
- —
Air-quality risk 8/10 · Major
- Unhealthy air days now
- 14 days/yr
- Unhealthy air days in 30 yrs
- 19 days/yr
Risk factors via First Street. Map © Google.
Why this score? — see what drove the D+ grade
The composite is a weighted blend of 9 inputs, each scored 0–100. Each bar is that input's sub-score; the figure is the points it added to the 100-point composite (weight × sub-score).
- Cash flow +15.0/30.0
- ARV discount +7.5/15.0
- 1% rule +5.0/10.0
- DSCR +5.0/10.0
- Schools +4.2/10.0
- Livability +4.1/5.0
- Rent growth +3.7/5.0
- Condition / age +2.5/5.0
- Appreciation +0.0/10.0
$14,900
🖨 Deal sheet 📄 Offer letter ✓ Due diligence
Listing remarks
This 2-bedroom, 1-bathroom mobile home in Garden City is an investor special waiting for the right vision. It needs work, but that's where the value lies—solid bones and a compact footprint keep renovation costs manageable while leaving plenty of room to build equity. Update the layout, refresh the finishes, and transform a rough property into a rewarding one. Flippers will appreciate the margins, and buy-and-hold investors can turn this into reliable rental income once the work is complete. The lot lease is an affordable $550 per month, helping keep ongoing expenses low and the numbers attractive for any strategy. The location adds further appeal. Brown Box Organics is just around th
Key facts
- Solid bones
- Affordable lot lease
- Compact footprint
Tags
Property features AI
Finance
- Other: Directions: Left on Adams from Curtis, then right on 48th
- Financial info: $94.14 annual taxes
- HOA & community: Monthly association fee of $550
Exterior
- Home design: Manufactured on land; Built in 1967
- Exterior features: Located within a mobile home park; Subdivision: River View
Interior
- Bedrooms: 2 bedrooms on the main level
- Bathrooms: 1 bathroom
- Heating & cooling: No heating; No cooling
- Interior features: Located primarily on the main level
Neighborhood map
What this means for you Summary
Snapshot
- This is a 2-bed/1.0-bath manufactured listed at $15k.
Deal economics
- At list price, monthly cash flow is $146 ($2k/yr) — positive.
- The deal already cash-flows at list — no discount required.
- Meets the 1% rule at list price ($2k rent vs $15k).
- Cap rate 52.4% vs local median 2.5% in Garden City — top-decile yield for the area; either an underpriced asset or a hidden risk that comps aren't pricing in. Stress-test before assuming the spread holds.
Location & tenants
- Location reads 82/100 on livability (#11 in ID, #1,264 nationally) — a professional / high-income tenant draw. Strengths: commute A+, health & safety A+, housing A; Watch: crime F.
- Boise Independent District (urban): math 42% / reading 56% proficiency, ranked #36 of 92 in ID (top 39%) — families likely to look elsewhere, expect single-tenant / working-renter base with shorter leases.
- Zoned schools: Mountain View Elementary School (math 42% / reading 47%, grade F, #199 of 357 statewide, top 59%, 312 students, 31% FRL); Capital Senior High School (math 34% / reading 57%, grade D-, #59 of 169 statewide, top 35%, 1,220 students, 28% FRL) — zoned schools at 29% FRL track the district average.
- Market conditions: Rents rising fast (+4.9%/yr); 445 active listings in the ZIP; 14 comparable units currently listed for rent nearby; rentals at typical pace (median 23d on market — plan ~3-4 weeks tenant-placement turnaround); solid renter incomes; 5,129 units permitted in Ada County in 2024 (414 in 5+ unit buildings).
Forward outlook
- Local home prices are declining (-3.0%/yr); year-one equity from $103 of loan paydown is wiped out by about $447 of value loss. Plan a longer hold.
- Ada County population projected at +45% by 2050 — long-run rental-demand tailwind backs the buy-and-hold thesis.
- At projected returns (-3.0% appreciation + 4.9% rent growth), your $4k cash investment doubles in ~3 years — after that, you're playing with house money.
Negotiation context
- Only 5 days on market — expect competitive offers; lowballing is unlikely to land.
Risks & watch-outs
- Watch-outs: flood insurance adds $427/mo; HOA is 35% of rent.
- Climate carrying-cost: in FEMA flood zone AE (mandatory federal flood insurance) — expect insurance premiums to compound above CPI over the hold.
Questions for the listing agent
- Built in 1967 — when were the roof, HVAC, electrical panel, plumbing, and water heater last replaced?
- What's the actual annual flood-insurance premium (NFIP or private), and is the property in a SFHA with mandatory coverage?
- What does the HOA fee cover, when was the last increase, and are there any pending special assessments or reserve-fund shortfalls?
- Is there a deadline driving the sale (1031 exchange, divorce, estate, relocation)? That informs how much negotiation room exists.
- Crime grade is F in this area — have there been break-ins, vandalism, or insurance claims at this property in the last 3 years? What carrier currently insures it and at what premium?
- The area grade is low — what's the realistic commute time and amenity access for the typical tenant pool here? Any planned neighborhood developments (good or bad) we should know about?
- What's the average days-on-market for RENTAL listings here right now (not sales)? A rising rental-DOM trend means longer vacancies and softer asking-rent achievability than the comps imply.
- What's the recent tenant-quality profile in this submarket — average credit score on applications, eviction rate, late-payment / NSF rate, and stable-employment percentage? A property-management company in the area should have these aggregated.
- How much new for-sale + rental construction is in the pipeline within 1–3 miles? Heavy new supply typically softens prices + rents 12–24 months out; constrained supply supports both.
Investment metrics
- 1% rule
- 10.41% ✓
- Cap rate
- 52.43%
- Cash-on-cash
- 164.77%
- DSCR
- 8.33
- GRM
- 0.8
CMA / ARV
- ARV (on-the-fly)
- $51,072
- Comps found
- 4
Show comp detail 4 sales within ~0.75 mi
| Address | Dist | Beds/Ba | Sqft | Sold | Price | $/sf | Match |
|---|---|---|---|---|---|---|---|
| 308 E 48th St Trlr 6 | 0.13mi | 3/1.0 (+1) | 684 (+2%) | 19mo | $24,900 | $36 | 70 |
| 208 E 44th St #5 | 0.55mi | 2/1.0 | 672 (0%) | 10mo | $75,000 | $112 | 66 |
| 415 E 44th St #12 | 0.54mi | 3/1.0 (+1) | 720 (+7%) | 5mo | $55,000 | $76 | 54 |
| 301 E 45th St #18 | 0.43mi | 2/1.0 | 728 (+8%) | 24mo | $54,900 | $75 | 46 |
Match score weights: distance 35% · size 25% · config 20% · recency 20%. Top-matched comps best support the ARV.
Projected returns pro-forma
-3.0% appreciation · 4.87% rent growth · sell at horizon
- IRR
- 50.2%
- Equity multiple
- 3.52×
- Total profit
- $10,502
- Equity at exit
- $2,222
- IRR
- 59.1%
- Equity multiple
- 9.71×
- Total profit
- $36,356
- Equity at exit
- $1,288
Cash invested: $4,172 (down + closing). Projections, not guarantees.
Landlord ↔ Tenant lean methodology
- Overall (STATE)
- 91 Strongly Landlord-Friendly
- State Idaho
- 91 Strongly Landlord-Friendly · R+18
- County
- — inherits STATE
- City
- — inherits STATE
ZIP-level market 83714
- Home prices YoY
- -31.5%
- Rents YoY
- 4.9%
- Active inventory
- 445
- Price-to-rent
- 0.8×
Monthly cashflow live
- Estimated rent
- $1,552 high interval (Pro) →
- Mortgage (P&I)
- −$78
- Tax est. 1.5%
- −$19 /mo · $224/yr
- Insurance
- −$6
- Flood insurance flood zone
- −$427 /mo · $5,118/yr
- HOA
- −$550
- Vacancy / Maint / Mgmt
- −$326
- Net cashflow
- $146
Break-even live
UW: 25.0% down · 7.5% · 30yr · 1.5% tax · 5.0% vac · 8.0% maint · 8.0% mgmt
Financing live
Cash to close
- Down payment
- $3,725
- Closing costs
- $447
- Reserves months
- —
- Total cash needed
- —
Loan-product check · same deal, 3 products live
Conventional
25% down · 7.5% · 30yr
- Down + closing
- —
- Monthly P&I
- —
- Monthly cashflow
- —
- DSCR
- —
- Eligible?
- —
Personal DTI + credit; lowest rate.
DSCR
20% down · 8.5% · 30yr
- Down + closing
- —
- Monthly P&I
- —
- Monthly cashflow
- —
- DSCR
- —
- Eligible?
- —
No personal income docs; deal must DSCR.
Hard money
10% down · 12.0% · 12mo
- Down + closing
- —
- Monthly P&I
- —
- Monthly cashflow
- —
- DSCR
- —
- Eligible?
- —
Short-term bridge; refi at stabilization.
Rent comps 14 comps
| Address | Beds | Baths | Sqft | Rent | $/sqft | DOM | Units | Dist |
|---|---|---|---|---|---|---|---|---|
| 4632 N Iota Ln Unit 300 Garden City, ID | 1.0 | 1.0 | 563 | $1,375 | $2.44 | 23d | 1 | 0.28mi |
| 4632 N Iota Ln Unit 200 Garden City, ID | 1.0 | 1.0 | 563 | $1,375 | $2.44 | 18d | 1 | 0.28mi |
| 4633 N Iota Ln Unit 201 Garden City, ID | 1.0 | 1.0 | 563 | $1,375 | $2.44 | 23d | 1 | 0.28mi |
| 3304 N Lakeharbor Ln Boise, ID | 1.0–3.0 | 1.0–2.0 | 1000 | $1,935 | $1.94 | 2d | 16 | 0.58mi |
| 3115 Sycamore Dr Boise, ID | 1.0 | 1.0 | 454 | $1,520 | $3.35 | 23d | 1 | 0.73mi |
| 4220 N Adams St Garden City, ID | 2.0 | 1.0–2.0 | 767 | $2,333 | $3.04 | 2d | 7 | 0.75mi |
| 385 E 42nd St Garden City, ID | 1.0–2.0 | 1.0–2.0 | 832 | $1,495 | $1.80 | 3d | 1 | 0.79mi |
| 521 E 41st St Garden City, ID | 2.0 | 1.0–2.0 | 814 | $5,000 | $6.14 | 23d | 18 | 0.92mi |
| 331 E 40th St Garden City, ID | 2.0 | 2.0 | 678 | $1,875 | $2.77 | 2d | 1 | 1.03mi |
| 6103 W State St Unit 6103-10 Garden City, ID | 1.0 | 1.0 | 580 | $1,150 | $1.98 | 23d | 1 | 1.18mi |
| 7460 W Holbrook Ln Boise, ID | 1.0 | 1.0 | 674 | $1,095 | $1.62 | 23d | 1 | 1.32mi |
| 2722 N Retirement Ln Boise, ID | 1.0 | 1.0 | 590 | $1,095 | $1.86 | 23d | 1 | 1.34mi |
| 7479 W Holbrook Ln Boise, ID | 1.0 | 1.0 | 650 | $1,095 | $1.68 | 23d | 1 | 1.34mi |
| 1901 N 32nd St Boise, ID | 2.0 | 1.0 | 616 | $1,245 | $2.02 | 23d | 1 | 1.48mi |
HOA detail
- Monthly dues
- $550 · $6,600/yr
Listing history 5 events
-
2026-06-18days on market $14,900 Active 5 DOM
-
2026-06-17days on market $14,900 Active 4 DOM
-
2026-06-16days on market $14,900 Active 3 DOM
-
2026-06-15remarks 693-char remark
-
2026-06-15$14,900 Active 2 DOM
ⓘ Source: listings_history table (triggers on properties + properties_extension) + one-shot
backfill from property_details.listing_events for pre-trigger history.
Climate risk First Street
- Flood 2/10 Low FEMA zone AE · 3% chance over 30 yrs
- Wildfire 4/10 Moderate
- Heat 4/10 Moderate 7 d/yr ≥96°F today · 18 d/yr by 30 yrs out
- Wind 1/10 Low
- Air quality 8/10 Severe 14 unhealthy d/yr today · 19 by 30 yrs out
Nearby sold comps map
Loading sold comps map…
Walkable amenities ~0.75 mi
Loading nearby amenities…
Taxation est. · year 1
- Rental income
- $18,620
- − Mortgage interest
- −$835
- − Property taxes
- −$224
- − Insurance
- −$5,193
- − Repairs & maintenance
- −$1,490
- − Management
- −$1,490
- − HOA
- −$6,600
- − Depreciation
- −$433
- Taxable income
- $2,356
- Est. tax owed @ 24.0%
- −$566
- After-tax cash flow
- $1,190/yr
For passive investors: Depreciation is non-cash, so a rental often shows a tax loss while cash-flowing — sheltering income. Rental losses are passive: they offset passive income freely, and up to $25,000/yr can offset ordinary (W-2) income if you actively participate and your MAGI is under $100k (phasing out to $0 by $150k); unused losses carry forward. On sale, claimed depreciation is recaptured at up to 25%, and gains may owe capital-gains tax (a 1031 exchange can defer both). Figures are a year-1 estimate at your 24.0% rate — not tax advice; consult a CPA.
Schools (NCES district)
- District
- Boise Independent District
- NCES district ID
- 1600360
- Math proficiency
- 42% ▼ -5.00%
- Reading proficiency
- 56% ▼ -1.00%
- Median HH income
- $49,135
- Composite
- 41.82/100
- National rank
- #3388
- State rank
- #36 of 92 in ID
Livability — Garden City
- Score
- 82/100
- State rank
- #11
- US rank
- #1264
Category grades
Schools grade is shown separately in the Schools card above.
Census & demographics
- Census place
- Garden City, ID
- County
- Ada County · 522,161 people
- Metro
- Boise City, ID
- Population (ZIP)
- 27,564
- Household income
- $87,651
- Rent vs Own
- Severe rent burden
- 557.0
Population outlook (Ada County) Hauer SSP2
- Today (2025)
- 535,818 people
- By 2030
- 585,751 · +9.3%
- By 2040
- 682,435 · +27.4%
- By 2050
- 775,818 · +44.8%
- By 2075
- 994,458 · +85.6%
- By 2100
- 1,148,884 · +114.4%
Race, ethnicity, and origin ACS 2023
- Neighborhood character
- Predominantly White (86%)
- Race & ethnicity
- White 86% Hispanic / Latino 9% Two or more races 7%
- Hispanic origin (detail)
- Mexican 7%
- Common ancestry
- Italian 4% Slovak 4% Portuguese 4%
- Foreign-born
- 5% · Canada
- Languages at home
- 92% English-only · Spanish 5% Russian/Polish/Slavic 2% Other Indo-European 1%
Political lean MEDSL · Ada
- 2024 margin
- R (+10.3) · D 43.4% · R 53.8% · Other 2.8%
- 2008→2024 swing
- -4.2pp toward R · 2008: -6.2pp · 2024: -10.3pp
- All cycles
- 2024: R+10.3 2020: R+3.9 2016: R+9.2 2012: R+11.3 2008: R+6.2
Not yet ingested
- Civics
- —
Market trends
- HPI YoY
- ▼ -155.87%
- Current HPI
- 339.0701
- Rent YoY
- ▲ 4.87%
- Metro
- Boise City, ID
- State GDP YoY
- ▲ 4.51%
- F500 in state
- 6
Industry mix (Fortune 500 HQ in ID)
| Industry | F500 HQs | Revenue |
|---|---|---|
| Retail | 1 | $79B |
|
||
| Technology | 1 | $25B |
|
||
| Food / Agriculture | 1 | $6B |
|
||
Price history
1 event — show timeline
- 2026-06-13 Listed $14,900 IMLS
Cash-flow waterfall
monthlySold comps — $/sqft
last 12 mo · ≤1 miLoading sold comps…