 Multi-family
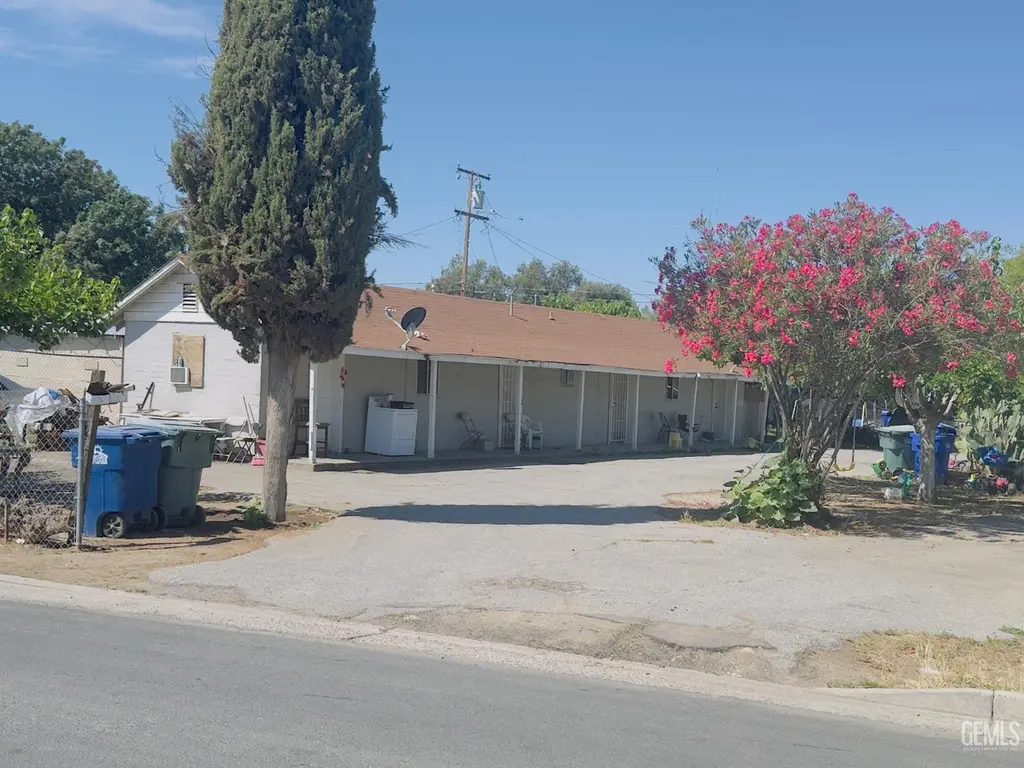
121 Glenwood St · Delano, CA
Flood risk 1/10 · Minimal
- FEMA flood zone
- X (unshaded)
- Chance of flooding over 30 yrs
- 0.0%
- Est. flood insurance / yr
- $507 – $1,088
Fire risk 5/10 · Moderate
- Est. fire insurance / yr
- $659 – $1,223
Heat risk 8/10 · Major
- Hot days now (above 106°F)
- 7 days/yr
- Hot days in 30 yrs
- 18 days/yr
Wind risk 1/10 · Minimal
- Chance of severe wind over 30 yrs
- —
Air-quality risk 10/10 · Severe
- Unhealthy air days now
- 30 days/yr
- Unhealthy air days in 30 yrs
- 34 days/yr
Risk factors via First Street. Map © Google.
Why this score? — see what drove the C+ grade
The composite is a weighted blend of 9 inputs, each scored 0–100. Each bar is that input's sub-score; the figure is the points it added to the 100-point composite (weight × sub-score).
- Cash flow +27.5/30.0
- DSCR +9.6/10.0
- ARV discount +7.5/15.0
- 1% rule +6.2/10.0
- Schools +3.4/10.0
- Rent growth +2.5/5.0
- Livability +2.5/5.0
- Condition / age +2.5/5.0
- Appreciation +0.0/10.0
$200,000
🖨 Deal sheet 📄 Offer letter ✓ Due diligence
Multi-family units
County records classify this as Multi-Family (2-4 Unit). Listing-text estimate: 1 unit. estimate disagrees with records
Listing remarks
Great Opportunity to add to your portfolio or your fist investment property. Duplexes are both 1 bedroom/ 1 bath. Over-sized lot for possible future units. Long term tenants. Upside for more potential rental income. Property is being sold in As-Is condition. Hard money or Cash only. Property must be sold in conjunction with 125 Glenwood St priced at $300,000. Offer subject to interior inspection.
Key facts
- 7,840 sq ft lot
- Built 1949
- Listed 28 days
Property features AI
Finance
- Other: Vacancy factor listed as 1.00; Price per unit listed at $125,000
- Financial info: Owner-occupied status listed as Owner; Two-unit property; Annual gross income approximately $12,960; Annual net income approximately $10,960; Total annual expenses approximately $2,000; Actual income/expense reporting; Actual monthly rent shown as $540 for each unit
Exterior
- Parking: Uncovered parking
- Utilities: Public water; Sewer service
- Home design: Single-story building
- Construction: Slab foundation; Composition roof
- Exterior features: Duplex zoning
Interior
- Bedrooms: Three 1-bedroom units total (one unit in Unit Type 1; two units in Unit Type 2)
- Bathrooms: Three 1-bath units (one bath per unit)
- Heating & cooling: Other heating and cooling
- Interior features: Tenant-occupied units
Neighborhood map
What this means for you Summary
Snapshot
- This is a 4-bed/2.0-bath multifamily listed at $200k.
Deal economics
- At list price, monthly cash flow is $591 ($7k/yr) — positive.
- The deal already cash-flows at list — no discount required.
- Meets the 1% rule at list price ($2k rent vs $200k).
- Recommended offer: $197k (1.5% below list) — sets the bar for market timing.
- Cap rate 9.8% vs local median 3.2% in Delano — top-decile yield for the area; either an underpriced asset or a hidden risk that comps aren't pricing in. Stress-test before assuming the spread holds.
Location & tenants
- Location reads 50/100 on livability (#1,143 in CA) — a working-class tenant base; expect higher turnover. Strengths: housing A+; Watch: cost of living D, schools F, amenities F.
- Delano Union Elementary (suburban): math 32% / reading 43% proficiency, ranked #860 of 1,400 in CA (top 61%) — families likely to look elsewhere, expect single-tenant / working-renter base with shorter leases; 76% free/reduced lunch — lower-income household profile, screen leases tightly.
- Market conditions: 149 active listings in the ZIP; 2 comparable units currently listed for rent nearby; 3,244 units permitted in Kern County in 2024 (73 in 5+ unit buildings).
Forward outlook
- Local home prices are declining (-3.0%/yr); year-one equity from $1k of loan paydown is wiped out by about $6k of value loss. Plan a longer hold.
- Kern County population projected at +17% by 2050 — long-run rental-demand tailwind backs the buy-and-hold thesis.
- At projected returns (-3.0% appreciation + 3.0% rent growth), your $56k cash investment doubles in ~9 years — after that, you're playing with house money.
Negotiation context
- It's been on market 28 days — a 2% lower offer ($197k) is reasonable based on typical stale-listing flexibility.
- 4 sale attempts since 2y ago; this cycle's ask has dropped $50k (20%) from the opening price — seller is motivated, your offer sets the floor, not the list.
Risks & watch-outs
- Watch-outs: built in 1949 — expect roof / HVAC / electrical / plumbing capex.
- Climate carrying-cost: moderate wildfire risk; extreme-heat days projected 7→18/yr by 2055 (HVAC capex compounding) — expect insurance premiums to compound above CPI over the hold.
Questions for the listing agent
- Built in 1949 — when were the roof, HVAC, electrical panel, plumbing, and water heater last replaced?
- Is there a deadline driving the sale (1031 exchange, divorce, estate, relocation)? That informs how much negotiation room exists.
- Schools are F-rated, which usually means shorter tenancies and higher turnover. Who's the typical renter profile here, and what's been the actual vacancy rate?
- What's the average days-on-market for RENTAL listings here right now (not sales)? A rising rental-DOM trend means longer vacancies and softer asking-rent achievability than the comps imply.
- What's the recent tenant-quality profile in this submarket — average credit score on applications, eviction rate, late-payment / NSF rate, and stable-employment percentage? A property-management company in the area should have these aggregated.
- How much new apartment / multifamily construction is in the pipeline within 1–3 miles? Heavy new supply (>2% of stock underway) typically softens rents 12–24 months out; light construction supports rent growth.
Investment metrics
- 1% rule
- 1.12% ✓
- Cap rate
- 9.84%
- Cash-on-cash
- 12.67%
- DSCR
- 1.56
- GRM
- 7.4
CMA / ARV
No comps found within radius.
Projected returns pro-forma
-3.0% appreciation · 3.0% rent growth · sell at horizon
- IRR
- 2.4%
- Equity multiple
- 1.09×
- Total profit
- $5,161
- Equity at exit
- $29,821
- IRR
- 11.9%
- Equity multiple
- 1.94×
- Total profit
- $52,615
- Equity at exit
- $17,292
Cash invested: $56,000 (down + closing). Projections, not guarantees.
Landlord ↔ Tenant lean methodology
- Overall (STATE)
- 18 Strongly Tenant-Friendly
- State California
- 18 Strongly Tenant-Friendly · D+13
- County
- — inherits STATE
- City
- — inherits STATE
ZIP-level market 93215
- Home prices YoY
- -15.4%
- Active inventory
- 149
- Price-to-rent
- 14.9×
Monthly cashflow live
- Estimated rent
- $2,238 medium interval (Pro) →
- Mortgage (P&I)
- −$1,049
- Tax from tax record
- −$45 /mo · $534/yr
- Insurance
- −$83
- HOA
- −$0
- Vacancy / Maint / Mgmt
- −$470
- Net cashflow
- $591
Break-even live
2-unit breakdown (identical units grouped — click to expand)
| Units | Beds | Baths | Est. rent |
|---|---|---|---|
| 2× units | 1 | 1 | $2,238 |
| #1 | 1 | 1 | $1,119 |
| #2 | 1 | 1 | $1,119 |
| Total (2 units) | $2,238 | ||
UW: 25.0% down · 7.5% · 30yr · 1.5% tax · 5.0% vac · 8.0% maint · 8.0% mgmt
Financing live
Cash to close
- Down payment
- $50,000
- Closing costs
- $6,000
- Reserves months
- —
- Total cash needed
- —
Loan-product check · same deal, 3 products live
Conventional
25% down · 7.5% · 30yr
- Down + closing
- —
- Monthly P&I
- —
- Monthly cashflow
- —
- DSCR
- —
- Eligible?
- —
Personal DTI + credit; lowest rate.
DSCR
20% down · 8.5% · 30yr
- Down + closing
- —
- Monthly P&I
- —
- Monthly cashflow
- —
- DSCR
- —
- Eligible?
- —
No personal income docs; deal must DSCR.
Hard money
10% down · 12.0% · 12mo
- Down + closing
- —
- Monthly P&I
- —
- Monthly cashflow
- —
- DSCR
- —
- Eligible?
- —
Short-term bridge; refi at stabilization.
Rent comps 2 comps
| Address | Beds | Baths | Sqft | Rent | $/sqft | DOM | Units | Dist |
|---|---|---|---|---|---|---|---|---|
| 529 Main St Delano, CA | 3.0 | 1.0 | 920 | $1,850 | $2.01 | 10d | 1 | 0.35mi |
| 1225 Lexington St Unit B Delano, CA | 3.0 | 2.0 | 983 | $1,700 | $1.73 | 2d | 1 | 1.01mi |
Listing history 13 events
-
2026-06-09status $200,000 Pending 28 DOM
-
2026-06-08days on market $200,000 Active 28 DOM
-
2026-06-07days on market $200,000 Active 27 DOM
-
2026-06-05days on market $200,000 Active 24 DOM
-
2026-06-03days on market $200,000 Active 23 DOM
-
2026-06-03days on market $200,000 Active 22 DOM
-
2026-06-01days on market $200,000 Active 21 DOM
-
2026-05-31days on market $200,000 Active 20 DOM
-
2026-05-12price $200,000
-
2026-05-11$250,000 Active
-
2025-02-01$250,000 Active
-
2025-02-01$250,000 Active
-
2024-08-27$247,451 Active
ⓘ Source: listings_history table (triggers on properties + properties_extension) + one-shot
backfill from property_details.listing_events for pre-trigger history.
Tax reassessment forecast CA · Resets to sale price
- Current annual tax
- $534 · $45/mo
- Projected year-2 tax
- $1,520 · $127/mo
- Expected delta
- +$986/yr (+$82/mo · 184.5%)
ⓘ Screening estimate from a state-policy table — verify with the county assessor before closing.
Climate risk First Street
- Flood 1/10 Low FEMA zone X (unshaded) · 0% chance over 30 yrs
- Wildfire 5/10 Major
- Heat 8/10 Severe 7 d/yr ≥106°F today · 18 d/yr by 30 yrs out
- Wind 1/10 Low
- Air quality 10/10 Extreme 30 unhealthy d/yr today · 34 by 30 yrs out
Nearby sold comps map
Loading sold comps map…
Walkable amenities ~0.75 mi
Loading nearby amenities…
Taxation est. · year 1
- Rental income
- $26,856
- − Mortgage interest
- −$11,203
- − Property taxes
- −$534
- − Insurance
- −$1,000
- − Repairs & maintenance
- −$2,148
- − Management
- −$2,148
- − Depreciation
- −$5,818
- Taxable income
- $4,003
- Est. tax owed @ 24.0%
- −$961
- After-tax cash flow
- $6,135/yr
For passive investors: Depreciation is non-cash, so a rental often shows a tax loss while cash-flowing — sheltering income. Rental losses are passive: they offset passive income freely, and up to $25,000/yr can offset ordinary (W-2) income if you actively participate and your MAGI is under $100k (phasing out to $0 by $150k); unused losses carry forward. On sale, claimed depreciation is recaptured at up to 25%, and gains may owe capital-gains tax (a 1031 exchange can defer both). Figures are a year-1 estimate at your 24.0% rate — not tax advice; consult a CPA.
Schools (NCES district)
- District
- Delano Union Elementary
- NCES district ID
- 0610890
- Math proficiency
- 32% ▲ 6.00%
- Reading proficiency
- 43% ▲ 4.00%
- Median HH income
- $36,893
- Composite
- 33.68/100
- National rank
- #10442
- State rank
- #860 of 1400 in CA
Livability — Delano
- Score
- 50/100
- State rank
- #1143
- US rank
- #25752
Category grades
Schools grade is shown separately in the Schools card above.
Census & demographics
- Census place
- Delano, CA
- Population (ZIP)
- 53,627
Population outlook (Kern County) Hauer SSP2
- Today (2025)
- 947,286 people
- By 2030
- 978,984 · +3.3%
- By 2040
- 1,045,018 · +10.3%
- By 2050
- 1,105,232 · +16.7%
- By 2075
- 1,229,538 · +29.8%
- By 2100
- 1,238,059 · +30.7%
Race, ethnicity, and origin ACS 2023
- Neighborhood character
- Predominantly Hispanic (77%)
- Race & ethnicity
- Hispanic / Latino 77% Two or more races 37% Asian 13% White 5% Black 4%
- Hispanic origin (detail)
- Mexican 73%
- Foreign-born
- 34% · Canada, Vietnam
- Languages at home
- 26% English-only · Spanish 64% Tagalog/Filipino 6% Other Asian/Pacific 3%
Political lean MEDSL · Kern
- 2024 margin
- Strong R (+21.1) · D 38.2% · R 59.3% · Other 2.5%
- 2008→2024 swing
- -3.3pp toward R · 2008: -17.8pp · 2024: -21.1pp
- All cycles
- 2024: R+21.1 2020: R+10.2 2016: R+15.0 2012: R+20.9 2008: R+17.8
Not yet ingested
- Civics
- —
Market trends
- HPI YoY
- ▼ -70.32%
- Current HPI
- 385.3136
- Rent YoY
- —
- Metro
- —
- State GDP YoY
- ▲ 3.21%
- F500 in state
- 116
Industry mix (Fortune 500 HQ in CA)
| Industry | F500 HQs | Revenue |
|---|---|---|
| Technology | 27 | $1,492B |
|
||
| Financial Services | 3 | $174B |
|
||
| Retail | 3 | $44B |
|
||
| Insurance | 3 | $26B |
|
||
| Media / Entertainment | 2 | $115B |
|
||
| Pharmaceuticals / Biotech | 2 | $62B |
|
||
Price history
-19.2% since first listed5 events — show timeline
- 2026-05-12 Price Changed $200,000 GEMLS
- 2026-05-11 Listed $250,000 GEMLS
- 2025-02-01 Listed $250,000 TCMLS
- 2025-02-01 Listed $250,000 GEMLS
- 2024-08-27 Listed $247,451 GEMLS
Property tax history
+5.2%/yrLatest (2025): $534 · +3.4% YoY. Source: county tax records.
Cash-flow waterfall
monthlySold comps — $/sqft
last 12 mo · ≤1 miLoading sold comps…