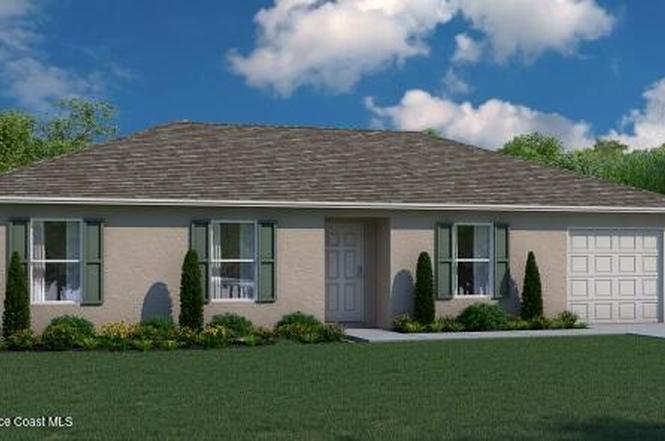
150 Hart St SW · Palm Bay, FL
Flood risk No data
- FEMA flood zone
- —
- Chance of flooding over 30 yrs
- —
- Est. flood insurance / yr
- —
Fire risk No data
- Est. fire insurance / yr
- —
Heat risk No data
- Hot days now (above threshold)
- —
- Hot days in 30 yrs
- —
Wind risk No data
- Chance of severe wind over 30 yrs
- —
Air-quality risk No data
- Unhealthy air days now
- —
- Unhealthy air days in 30 yrs
- —
Risk factors via First Street. Map © Google.
Why this score? — see what drove the F grade
The composite is a weighted blend of 9 inputs, each scored 0–100. Each bar is that input's sub-score; the figure is the points it added to the 100-point composite (weight × sub-score).
- ARV discount +7.5/15.0
- Cash flow +7.4/30.0
- Schools +4.7/10.0
- Livability +3.6/5.0
- Rent growth +2.8/5.0
- Condition / age +2.5/5.0
- 1% rule +2.1/10.0
- DSCR +1.5/10.0
- Appreciation +0.0/10.0
$292,990
🖨 Deal sheet (PDF) 📄 Offer letter ✓ Due diligence
Listing remarks
BRAND NEW HOME! Come see the beautiful Palm floor model has 1243 square feet of living space and comes equipped with 3 bedrooms, 2 bathrooms and a single car garage. Inside features include stain resistant wall to wall carpeting in the main living areas and a vinyl floor in the wet areas. 30'' upper cabinets in the kitchen, and laminate countertops. This new home includes one full year of builder's transferable warranty coverage and a 10-year limited structural warranty.
Key facts
- 0.24 acre lot
- Garage
- Built 2026
Neighborhood map
What this means for you Summary
Snapshot
- This is a 3-bed/2.0-bath land listed at $293k.
Deal economics
- At list price, monthly cash flow is $-378 ($-5k/yr) — negative.
- To cash-flow at today's rent, offer at most $238k (18.7% below list).
- To meet the 1% rule (rent ≥ 1% of price), the offer needs to be $208k (28.8% below list).
- Recommended offer: $208k (28.8% below list) — sets the bar for 1% rule.
Location & tenants
- Location reads 72/100 on livability (#366 in FL) — a middle-class / working-renter tenant base. Strengths: cost of living A+, housing A+; Watch: employment D+, amenities F, health & safety D-.
- Brevard (suburban): math 53% / reading 57% proficiency, ranked #19 of 73 in FL (top 26%) — acceptable for families but not a draw, mixed tenant base, ~2y average lease.
- Zoned schools: Jupiter Elementary School (math 41% / reading 42%, grade F, #1,437 of 2,144 statewide, top 68%, 732 students, 68% FRL); Southwest Middle School (math 40% / reading 39%, grade F, #373 of 571 statewide, top 66%, 920 students, 58% FRL); Heritage High School (math 30% / reading 44%, grade F, #340 of 667 statewide, top 52%, 2,007 students, 62% FRL) — zoned schools average 63% FRL vs 43% district-wide (20 pts higher); higher-poverty schools than district average — tighter screening recommended.
- Zoned-school proficiency averages 39% at this address vs 55% district-wide (-16 pts) — the specific schools serving this property underperform the Brevard average; the district grade overstates school quality for this exact location.
- Market conditions: Rents rising (+1.3%/yr); 1030 active listings in the ZIP; 16 comparable units currently listed for rent nearby; rentals at typical pace (median 26d on market — plan ~3-4 weeks tenant-placement turnaround); solid renter incomes; 4,602 units permitted in Brevard County in 2024 (702 in 5+ unit buildings).
- This rent runs 31% of the median local income ($80k/yr) — at the standard rent-burdened threshold; future hikes will face affordability resistance.
Forward outlook
- Local home prices are declining (-3.0%/yr); year-one equity from $2k of loan paydown is wiped out by about $9k of value loss. Plan a longer hold.
- Brevard County population projected at +15% by 2050 — modest demand growth; plan on rents tracking national, not racing it.
Negotiation context
- It's been on market 79 days — a 6% lower offer ($275k) is reasonable based on typical stale-listing flexibility.
Questions for the listing agent
- What do current leases actually rent for vs. the listed asking? Can we see a recent rent roll and the last 12 months of T-12 income?
- It's been on market 79 days. Have you received any prior offers? Is the seller open to a 29% concession, seller financing, or rate buy-down credit?
- Why hasn't it sold? Are there any deal-killer items the seller is aware of (foundation, flood, title, zoning, code violations)?
- Is there a deadline driving the sale (1031 exchange, divorce, estate, relocation)? That informs how much negotiation room exists.
- The area grade is low — what's the realistic commute time and amenity access for the typical tenant pool here? Any planned neighborhood developments (good or bad) we should know about?
- What's the average days-on-market for RENTAL listings here right now (not sales)? A rising rental-DOM trend means longer vacancies and softer asking-rent achievability than the comps imply.
- What's the recent tenant-quality profile in this submarket — average credit score on applications, eviction rate, late-payment / NSF rate, and stable-employment percentage? A property-management company in the area should have these aggregated.
- How much new for-sale + rental construction is in the pipeline within 1–3 miles? Heavy new supply typically softens prices + rents 12–24 months out; constrained supply supports both.
Investment metrics
- 1% rule
- 0.71% ✗
- Cap rate
- 4.75%
- Cash-on-cash
- -5.53%
- DSCR
- 0.75
- GRM
- 11.7
CMA / ARV
No comps found within radius.
Projected returns pro-forma
-3.0% appreciation · 1.29% rent growth · sell at horizon
- IRR
- -27.7%
- Equity multiple
- 0.09×
- Total profit
- $-75,038
- Equity at exit
- $43,686
- IRR
- -33.6%
- Equity multiple
- -0.34×
- Total profit
- $-110,186
- Equity at exit
- $25,332
Cash invested: $82,037 (down + closing). Projections, not guarantees.
Landlord ↔ Tenant lean methodology
- Overall (STATE)
- 87 Strongly Landlord-Friendly
- State Florida
- 87 Strongly Landlord-Friendly · R+3
- County
- — inherits STATE
- City
- — inherits STATE
ZIP-level market 32908
- Home prices YoY
- -10.4%
- Rents YoY
- 1.3%
- Active inventory
- 1030
- Price-to-rent
- 11.7×
Monthly cashflow live
- Estimated rent
- $2,085 high interval (Pro) →
- Mortgage (P&I)
- −$1,536
- Tax est. 1.5%
- −$366 /mo · $4,395/yr
- Insurance
- −$122
- HOA
- −$0
- Vacancy / Maint / Mgmt
- −$438
- Net cashflow
- $-378
Break-even live
Sensitivity live
| Price | -10% $-175 | -5% $-277 | +0% $-378 | +5% $-479 | +10% $-580 |
|---|---|---|---|---|---|
| Rent | -10% $-543 | -5% $-460 | +0% $-378 | +5% $-296 | +10% $-213 |
| Rate | -1.0pp $-230 | -0.5pp $-303 | base $-378 | +0.5pp $-454 | +1.0pp $-531 |
UW: 25.0% down · 7.5% · 30yr · 1.5% tax · 5.0% vac · 8.0% maint · 8.0% mgmt
Financing live
Cash to close
- Down payment
- $73,248
- Closing costs
- $8,790
- Reserves months
- —
- Total cash needed
- —
Loan-product check · same deal, 3 products live
Conventional
25% down · 7.5% · 30yr
- Down + closing
- —
- Monthly P&I
- —
- Monthly cashflow
- —
- DSCR
- —
- Eligible?
- —
Personal DTI + credit; lowest rate.
DSCR
20% down · 8.5% · 30yr
- Down + closing
- —
- Monthly P&I
- —
- Monthly cashflow
- —
- DSCR
- —
- Eligible?
- —
No personal income docs; deal must DSCR.
Hard money
10% down · 12.0% · 12mo
- Down + closing
- —
- Monthly P&I
- —
- Monthly cashflow
- —
- DSCR
- —
- Eligible?
- —
Short-term bridge; refi at stabilization.
Rent comps 16 comps
| Address | Beds | Baths | Sqft | Rent | $/sqft | DOM | Units | Dist |
|---|---|---|---|---|---|---|---|---|
| 914 Caligula Ave SE Palm Bay, FL | 3.0 | 2.0 | 1371 | $1,841 | $1.34 | 16d | 1 | 0.39mi |
| 726 Scotten Ave SW Palm Bay, FL | 3.0 | 2.0 | 1443 | $1,970 | $1.37 | 16d | 1 | 0.41mi |
| 857 Buchanan Ave SE Palm Bay, FL | 3.0 | 2.0 | 1257 | $1,950 | $1.55 | 25d | 1 | 0.49mi |
| 931 Commerce Rd SE Palm Bay, FL | 3.0 | 2.0 | 1068 | $2,300 | $2.15 | 25d | 1 | 0.59mi |
| 1072 Genesee Ave SE Palm Bay, FL | 3.0 | 2.0 | 1004 | $1,855 | $1.85 | 25d | 1 | 0.60mi |
| 171 Okeefe St SE Palm Bay, FL | 3.0 | 2.0 | 1288 | $1,855 | $1.44 | 16d | 1 | 0.67mi |
| 431 Brantley St SE Palm Bay, FL | 3.0 | 2.0 | 1326 | $2,050 | $1.55 | 21d | 1 | 0.71mi |
| 487 Wiltshire Ave SW Palm Bay, FL | 3.0 | 2.0 | 1462 | $2,300 | $1.57 | 25d | 1 | 1.03mi |
| 511 Trumpet St SW Palm Bay, FL | 3.0 | 2.0 | 1243 | $2,200 | $1.77 | 25d | 1 | 1.04mi |
| 320 Algiers Ave SE Palm Bay, FL | 3.0 | 2.0 | 1306 | $1,825 | $1.40 | 25d | 1 | 1.25mi |
| 710 Avalon St SE Palm Bay, FL | 3.0 | 2.0 | 1378 | $1,995 | $1.45 | 25d | 1 | 1.27mi |
| 743 Andrew St SE Palm Bay, FL | 3.0 | 2.0 | 1252 | $1,895 | $1.51 | 25d | 1 | 1.33mi |
| 2127 Jupiter Blvd SW Palm Bay, FL | 3.0 | 2.0 | 1104 | $1,885 | $1.71 | 25d | 1 | 1.39mi |
| 800 Starland St SE Palm Bay, FL | 2.0 | 1.0 | 904 | $1,650 | $1.83 | 25d | 1 | 1.41mi |
| 461 Ellington Ave SE Palm Bay, FL | 2.0 | 2.0 | 1040 | $1,595 | $1.53 | 25d | 1 | 1.42mi |
| 154 Daffodil Dr SW Palm Bay, FL | 3.0–4.0 | 2.0–3.0 | 1384 | $1,649 | $1.19 | 16d | 6 | 1.47mi |
Listing history 2 events
-
2026-04-03status Pending
-
2026-01-14$292,990 Active
ⓘ Source: listings_history table (triggers on properties + properties_extension) + one-shot
backfill from property_details.listing_events for pre-trigger history.
Nearby sold comps map
Loading sold comps map…
Walkable amenities ~0.75 mi
Loading nearby amenities…
Taxation est. · year 1
- Rental income
- $25,017
- − Mortgage interest
- −$16,412
- − Property taxes
- −$4,395
- − Insurance
- −$1,465
- − Repairs & maintenance
- −$2,001
- − Management
- −$2,001
- − Depreciation
- −$8,523
- Taxable loss
- −$9,781
- Est. tax savings @ 24.0%
- +$2,347
- After-tax cash flow
- $-2,187/yr
For passive investors: Depreciation is non-cash, so a rental often shows a tax loss while cash-flowing — sheltering income. Rental losses are passive: they offset passive income freely, and up to $25,000/yr can offset ordinary (W-2) income if you actively participate and your MAGI is under $100k (phasing out to $0 by $150k); unused losses carry forward. On sale, claimed depreciation is recaptured at up to 25%, and gains may owe capital-gains tax (a 1031 exchange can defer both). Figures are a year-1 estimate at your 24.0% rate — not tax advice; consult a CPA.
Schools (NCES district)
- District
- Brevard
- NCES district ID
- 1200150
- Math proficiency
- 53% ▼ -9.00%
- Reading proficiency
- 57% ▼ -4.00%
- Median HH income
- $49,426
- Composite
- 46.86/100
- National rank
- #2370
- State rank
- #19 of 73 in FL
Livability — Palm Bay
- Score
- 72/100
- State rank
- #366
- US rank
- #6458
Category grades
Schools grade is shown separately in the Schools card above.
Census & demographics
- Census place
- Palm Bay, FL
- County
- Brevard County · 602,871 people
- City population
- 132,211
- Metro
- Palm Bay-Melbourne-Titusville, FL
- Population (ZIP)
- 16,535
- Household income
- $79,596
- Rent vs Own
- Severe rent burden
- 112.0
Population outlook (Brevard County) Hauer SSP2
- Today (2025)
- 623,254 people
- By 2030
- 648,420 · +4.0%
- By 2040
- 690,009 · +10.7%
- By 2050
- 715,669 · +14.8%
- By 2075
- 775,744 · +24.5%
- By 2100
- 776,687 · +24.6%
Race, ethnicity, and origin ACS 2023
- Neighborhood character
- Diverse neighborhood (Simpson 0.69)
- Race & ethnicity
- White 48% Hispanic / Latino 20% Black 20% Two or more races 19%
- Hispanic origin (detail)
- Mexican 1% Puerto Rican 8% Cuban 6% Dominican 3%
- Common ancestry
- Hispanic 3% Estonian 2% Romanian 1%
- Foreign-born
- 10% · Canada, Jamaica, South Korea
- Languages at home
- 87% English-only · Spanish 9% Other Indo-European 1% French/Haitian/Cajun 1%
Political lean MEDSL · Brevard
- 2024 margin
- Strong R (+20.8) · D 39.1% · R 59.9% · Other 1.0%
- 2008→2024 swing
- -10.4pp toward R · 2008: -10.4pp · 2024: -20.8pp
- All cycles
- 2024: R+20.8 2020: R+16.4 2016: R+19.8 2012: R+12.7 2008: R+10.4
Not yet ingested
- Civics
- —
Market trends
- HPI YoY
- ▼ -38.22%
- Current HPI
- 330.0399
- Rent YoY
- ▲ 1.29%
- Metro
- Palm Bay-Melbourne-Titusville, FL
- State GDP YoY
- ▲ 3.28%
- F500 in state
- 36
Industry mix (Fortune 500 HQ in FL)
| Industry | F500 HQs | Revenue |
|---|---|---|
| Industrial Technology | 2 | $29B |
|
||
| Insurance | 2 | $17B |
|
||
| Retail | 1 | $60B |
|
||
| Technology Distribution | 1 | $58B |
|
||
| Homebuilding | 1 | $35B |
|
||
| Technology Manufacturing | 1 | $35B |
|
||
Price history
2 events — show timeline
- 2026-04-03 Pending — SCMLS
- 2026-01-14 Listed $292,990 SCMLS
Cash-flow waterfall
monthlySold comps — $/sqft
last 12 mo · ≤1 miLoading sold comps…