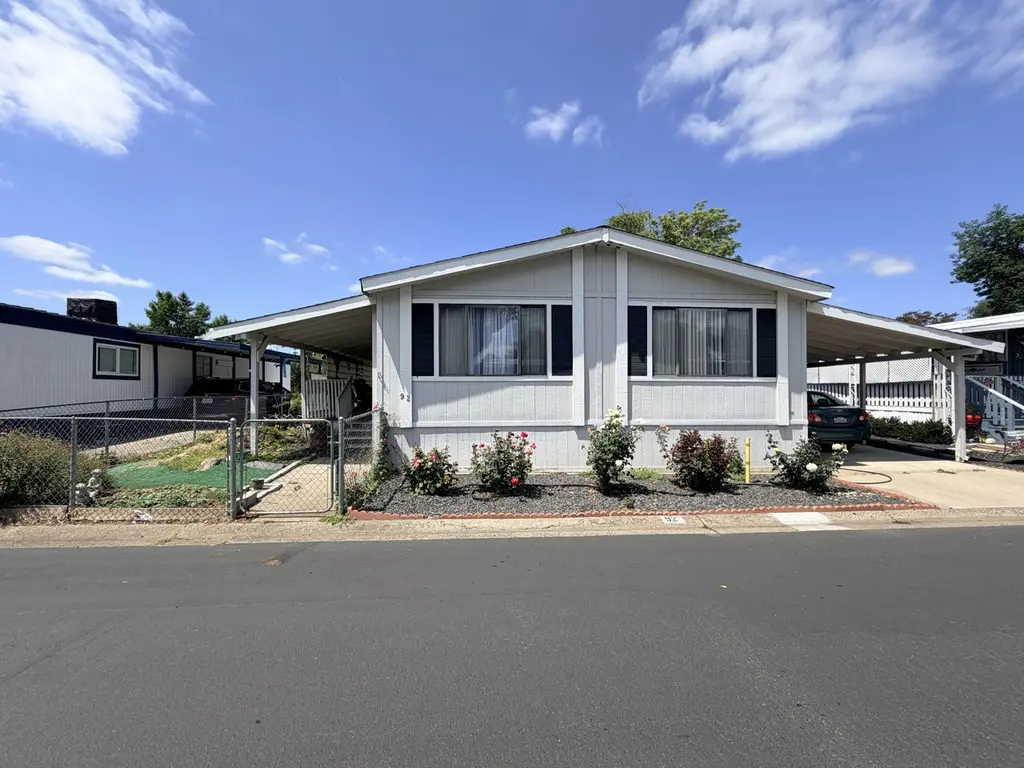
19964 Riverside Ave Spc 92 · Anderson, CA
Flood risk 7/10 · Major
- FEMA flood zone
- X (shaded)
- Chance of flooding over 30 yrs
- 0.76%
- Est. flood insurance / yr
- $507 – $1,088
Fire risk 8/10 · Major
- Est. fire insurance / yr
- $659 – $1,223
Heat risk 8/10 · Major
- Hot days now (above 104°F)
- 5 days/yr
- Hot days in 30 yrs
- 12 days/yr
Wind risk 1/10 · Minimal
- Chance of severe wind over 30 yrs
- —
Air-quality risk 10/10 · Severe
- Unhealthy air days now
- 35 days/yr
- Unhealthy air days in 30 yrs
- 42 days/yr
Risk factors via First Street. Map © Google.
Why this score? — see what drove the B- grade
The composite is a weighted blend of 9 inputs, each scored 0–100. Each bar is that input's sub-score; the figure is the points it added to the 100-point composite (weight × sub-score).
- Cash flow +30.0/30.0
- 1% rule +10.0/10.0
- DSCR +10.0/10.0
- ARV discount +8.6/15.0
- Livability +3.4/5.0
- Rent growth +2.5/5.0
- Condition / age +2.5/5.0
- Schools +2.4/10.0
- Appreciation +0.0/10.0
$79,500
🖨 Deal sheet 📄 Offer letter ✓ Due diligence
Listing remarks
Wonderfully taken care of double wide mobile in El Rio Estates park! Lots of potential for gardening and relaxing with bigger yard. All newer appliances in large kitchen and dining area for hosting. Big master suite with shower and tub. Move in ready! Must have park approval.
Key facts
- Bigger yard
- Newer appliances
- Dining area
Tags
Property features AI
Exterior
- Parking: Attached carport; 1 carport space
- Home design: Manufactured in park (Mobile Home)
- Construction: Wood siding; Pillar/post/pier foundation; Composition roof; Skirted with wood; Model: United States; Located in El Rio Estates (park)
- Exterior features: Deck; Chain link fencing; Level topography; Asphalt road access
Interior
- Kitchen: Dishwasher; Microwave; Range / Oven; Refrigerator
- Flooring: Vinyl flooring; Carpet
- Heating & cooling: Central air; Evaporative cooling; Heating present
- Interior features: Dishwasher; Dryer; Microwave; Range; Refrigerator; Washer; Oven; No fireplace
- Laundry & utility: Washer and Dryer
Neighborhood map
What this means for you Summary
Snapshot
- This is a 2-bed/2.0-bath manufactured listed at $80k.
Deal economics
- At list price, monthly cash flow is $730 ($9k/yr) — positive.
- The deal already cash-flows at list — no discount required.
- Meets the 1% rule at list price ($2k rent vs $80k).
- Recommended offer: $78k (1.5% below list) — sets the bar for market timing.
- Cap rate 18.3% vs local median 3.5% in Anderson — top-decile yield for the area; either an underpriced asset or a hidden risk that comps aren't pricing in. Stress-test before assuming the spread holds.
Location & tenants
- Location reads 68/100 on livability (#277 in CA) — a middle-class / working-renter tenant base. Strengths: commute A+, health & safety A+, housing A-; Watch: employment D, crime F, amenities F.
- Cascade Union Elementary (suburban): math 25% / reading 32% proficiency, ranked #377 of 517 in CA (top 73%) — low school quality limits family demand, transient renter base, plan for 1-2y turnover; 70% free/reduced lunch — lower-income household profile, screen leases tightly.
- Market conditions: 224 active listings in the ZIP; 4 comparable units currently listed for rent nearby; rentals leasing fast (median 14d on market — plan ~1-2 weeks tenant-placement turnaround); 246 units permitted in Shasta County in 2024 (0 in 5+ unit buildings).
- This rent runs 33% of the median local income ($61k/yr) — at the standard rent-burdened threshold; future hikes will face affordability resistance.
Forward outlook
- Local home prices are declining (-3.0%/yr); year-one equity from $550 of loan paydown is wiped out by about $2k of value loss. Plan a longer hold.
- Shasta County population projected to shrink 9% by 2050 — rents likely to lag national; underwrite the cash flow, not the appreciation.
- At projected returns (-3.0% appreciation + 3.0% rent growth), your $22k cash investment doubles in ~3 years — after that, you're playing with house money.
Negotiation context
- It's been on market 28 days — a 2% lower offer ($78k) is reasonable based on typical stale-listing flexibility.
Risks & watch-outs
- Watch-outs: flood insurance adds $66/mo.
- Climate carrying-cost: major flood risk; severe wildfire risk; extreme-heat days projected 5→12/yr by 2055 (HVAC capex compounding) — expect insurance premiums to compound above CPI over the hold.
Questions for the listing agent
- What's the actual annual flood-insurance premium (NFIP or private), and is the property in a SFHA with mandatory coverage?
- Is there a deadline driving the sale (1031 exchange, divorce, estate, relocation)? That informs how much negotiation room exists.
- Crime grade is F in this area — have there been break-ins, vandalism, or insurance claims at this property in the last 3 years? What carrier currently insures it and at what premium?
- What's the average days-on-market for RENTAL listings here right now (not sales)? A rising rental-DOM trend means longer vacancies and softer asking-rent achievability than the comps imply.
- What's the recent tenant-quality profile in this submarket — average credit score on applications, eviction rate, late-payment / NSF rate, and stable-employment percentage? A property-management company in the area should have these aggregated.
- How much new for-sale + rental construction is in the pipeline within 1–3 miles? Heavy new supply typically softens prices + rents 12–24 months out; constrained supply supports both.
Investment metrics
- 1% rule
- 2.14% ✓
- Cap rate
- 18.31%
- Cash-on-cash
- 42.92%
- DSCR
- 2.91
- GRM
- 3.9
CMA / ARV
- ARV (on-the-fly)
- $81,432
- Comps found
- 1
Show comp detail 1 sale within ~0.75 mi
| Address | Dist | Beds/Ba | Sqft | Sold | Price | $/sf | Match |
|---|---|---|---|---|---|---|---|
| 19964 Riverside Ave #58 | 0.00mi | 2/2.0 | 1,368 (-3%) | 16mo | $80,000 | $58 | 82 |
Match score weights: distance 35% · size 25% · config 20% · recency 20%. Top-matched comps best support the ARV.
Projected returns pro-forma
-3.0% appreciation · 3.0% rent growth · sell at horizon
- IRR
- 35.6%
- Equity multiple
- 2.51×
- Total profit
- $33,655
- Equity at exit
- $11,854
- IRR
- 42.4%
- Equity multiple
- 5.02×
- Total profit
- $89,416
- Equity at exit
- $6,874
Cash invested: $22,260 (down + closing). Projections, not guarantees.
Landlord ↔ Tenant lean methodology
- Overall (STATE)
- 18 Strongly Tenant-Friendly
- State California
- 18 Strongly Tenant-Friendly · D+13
- County
- — inherits STATE
- City
- — inherits STATE
ZIP-level market 96007
- Active inventory
- 224
- Price-to-rent
- 3.9×
Monthly cashflow live
- Estimated rent
- $1,703 medium interval (Pro) →
- Mortgage (P&I)
- −$417
- Tax est. 1.5%
- −$99 /mo · $1,192/yr
- Insurance
- −$33
- Flood insurance flood zone
- −$66 /mo · $798/yr
- HOA
- −$0
- Vacancy / Maint / Mgmt
- −$358
- Net cashflow
- $730
Break-even live
UW: 25.0% down · 7.5% · 30yr · 1.5% tax · 5.0% vac · 8.0% maint · 8.0% mgmt
Financing live
Cash to close
- Down payment
- $19,875
- Closing costs
- $2,385
- Reserves months
- —
- Total cash needed
- —
Loan-product check · same deal, 3 products live
Conventional
25% down · 7.5% · 30yr
- Down + closing
- —
- Monthly P&I
- —
- Monthly cashflow
- —
- DSCR
- —
- Eligible?
- —
Personal DTI + credit; lowest rate.
DSCR
20% down · 8.5% · 30yr
- Down + closing
- —
- Monthly P&I
- —
- Monthly cashflow
- —
- DSCR
- —
- Eligible?
- —
No personal income docs; deal must DSCR.
Hard money
10% down · 12.0% · 12mo
- Down + closing
- —
- Monthly P&I
- —
- Monthly cashflow
- —
- DSCR
- —
- Eligible?
- —
Short-term bridge; refi at stabilization.
Rent comps 4 comps
| Address | Beds | Baths | Sqft | Rent | $/sqft | DOM | Units | Dist |
|---|---|---|---|---|---|---|---|---|
| 6656 Churn Creek Rd Unit M-6656 Redding, CA | 2.0 | 2.0 | 966 | $1,625 | $1.68 | 13d | 1 | 0.91mi |
| 3190 Driftstone Dr Anderson, CA | 3.0 | 2.0 | 1750 | $2,200 | $1.26 | 21d | 1 | 1.25mi |
| 2343 Ferry St Anderson, CA | 2.0 | 2.0 | 1080 | $1,500 | $1.39 | 13d | 1 | 1.44mi |
| 2333 Ferry St Anderson, CA | 2.0 | 2.0 | 1100 | $1,500 | $1.36 | 13d | 1 | 1.44mi |
Listing history 9 events
-
2026-06-07statusdays on market $79,500 Pending 28 DOM
-
2026-06-05days on market $79,500 Active 27 DOM
-
2026-06-03days on market $79,500 Active 26 DOM
-
2026-06-02days on market $79,500 Active 25 DOM
-
2026-06-01days on market $79,500 Active 24 DOM
-
2026-05-31days on market $79,500 Active 23 DOM
-
2026-05-30days on market $79,500 Active 22 DOM
-
2026-05-23price $79,500
-
2026-05-08$84,000 Active
ⓘ Source: listings_history table (triggers on properties + properties_extension) + one-shot
backfill from property_details.listing_events for pre-trigger history.
Climate risk First Street
- Flood 7/10 Severe FEMA zone X (shaded) · 76% chance over 30 yrs
- Wildfire 8/10 Severe
- Heat 8/10 Severe 5 d/yr ≥104°F today · 12 d/yr by 30 yrs out
- Wind 1/10 Low
- Air quality 10/10 Extreme 35 unhealthy d/yr today · 42 by 30 yrs out
Nearby sold comps map
Loading sold comps map…
Walkable amenities ~0.75 mi
Loading nearby amenities…
Taxation est. · year 1
- Rental income
- $20,438
- − Mortgage interest
- −$4,453
- − Property taxes
- −$1,192
- − Insurance
- −$1,195
- − Repairs & maintenance
- −$1,635
- − Management
- −$1,635
- − Depreciation
- −$2,313
- Taxable income
- $8,014
- Est. tax owed @ 24.0%
- −$1,923
- After-tax cash flow
- $6,832/yr
For passive investors: Depreciation is non-cash, so a rental often shows a tax loss while cash-flowing — sheltering income. Rental losses are passive: they offset passive income freely, and up to $25,000/yr can offset ordinary (W-2) income if you actively participate and your MAGI is under $100k (phasing out to $0 by $150k); unused losses carry forward. On sale, claimed depreciation is recaptured at up to 25%, and gains may owe capital-gains tax (a 1031 exchange can defer both). Figures are a year-1 estimate at your 24.0% rate — not tax advice; consult a CPA.
Schools (NCES district)
- District
- Cascade Union Elementary
- NCES district ID
- 0607680
- Math proficiency
- 25% ▲ 1.00%
- Reading proficiency
- 32% ▲ 1.00%
- Median HH income
- $35,602
- Composite
- 23.56/100
- National rank
- #7856
- State rank
- #377 of 517 in CA
Livability — Anderson
- Score
- 68/100
- State rank
- #277
- US rank
- #9315
Category grades
Schools grade is shown separately in the Schools card above.
Census & demographics
- County
- Shasta County · 147,641 people
- City population
- 24,768
- Metro
- Redding, CA
- Population (ZIP)
- 24,768
- Household income
- $61,357
- Rent vs Own
- Severe rent burden
- 758.0
Population outlook (Shasta County) Hauer SSP2
- Today (2025)
- 179,231 people
- By 2030
- 176,953 · -1.3%
- By 2040
- 169,982 · -5.2%
- By 2050
- 162,547 · -9.3%
- By 2075
- 145,649 · -18.7%
- By 2100
- 123,025 · -31.4%
Race, ethnicity, and origin ACS 2023
- Neighborhood character
- Predominantly White (74%)
- Race & ethnicity
- White 74% Hispanic / Latino 15% Two or more races 12% Asian 3% Native American 2%
- Hispanic origin (detail)
- Mexican 11%
- Common ancestry
- Italian 6% Portuguese 2% Lithuanian 2%
- Foreign-born
- 6% · Canada, China, Vietnam
- Languages at home
- 90% English-only · Spanish 8% Other Indo-European 1% Chinese 1%
Political lean MEDSL · Shasta
- 2024 margin
- Solid R (+36.5) · D 30.5% · R 67.0% · Other 2.5%
- 2008→2024 swing
- -10.7pp toward R · 2008: -25.8pp · 2024: -36.5pp
- All cycles
- 2024: R+36.5 2020: R+33.1 2016: R+37.4 2012: R+30.3 2008: R+25.8
Not yet ingested
- Civics
- —
Market trends
- HPI YoY
- ▼ -191.70%
- Current HPI
- 179.6613
- Rent YoY
- —
- Metro
- Redding, CA
- State GDP YoY
- ▲ 3.21%
- F500 in state
- 116
Industry mix (Fortune 500 HQ in CA)
| Industry | F500 HQs | Revenue |
|---|---|---|
| Technology | 27 | $1,492B |
|
||
| Financial Services | 3 | $174B |
|
||
| Retail | 3 | $44B |
|
||
| Insurance | 3 | $26B |
|
||
| Media / Entertainment | 2 | $115B |
|
||
| Pharmaceuticals / Biotech | 2 | $62B |
|
||
Price history
-5.4% since first listed2 events — show timeline
- 2026-05-23 Price Changed $79,500 SAOR
- 2026-05-08 Listed $84,000 SAOR
Property tax history
-1.1%/yrLatest (2020): $136 · +2.6% YoY. Source: county tax records.
Cash-flow waterfall
monthlySold comps — $/sqft
last 12 mo · ≤1 miLoading sold comps…