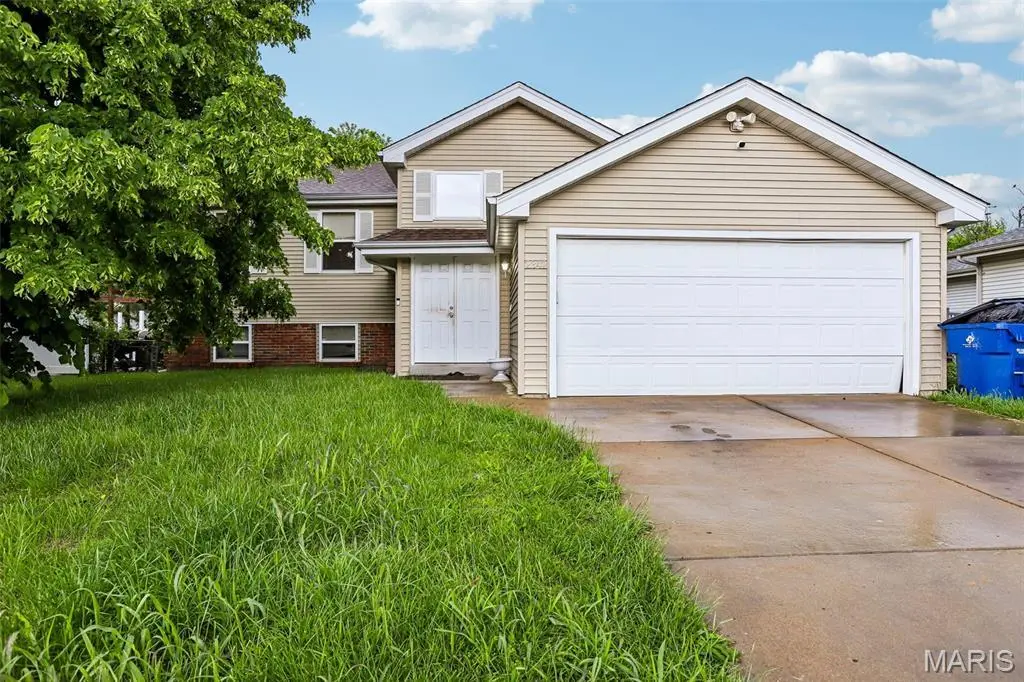
2342 Farnham Ln · Florissant, MO
Flood risk 1/10 · Minimal
- FEMA flood zone
- X (unshaded)
- Chance of flooding over 30 yrs
- 0.0%
- Est. flood insurance / yr
- $473 – $860
Fire risk 1/10 · Minimal
- Est. fire insurance / yr
- $1,054 – $1,958
Heat risk 5/10 · Moderate
- Hot days now (above 105°F)
- 7 days/yr
- Hot days in 30 yrs
- 21 days/yr
Wind risk 2/10 · Minimal
- Chance of severe wind over 30 yrs
- 1.0%
Air-quality risk 3/10 · Minor
- Unhealthy air days now
- 3 days/yr
- Unhealthy air days in 30 yrs
- 5 days/yr
Risk factors via First Street. Map © Google.
Why this score? — see what drove the B grade
The composite is a weighted blend of 9 inputs, each scored 0–100. Each bar is that input's sub-score; the figure is the points it added to the 100-point composite (weight × sub-score).
- Cash flow +23.3/30.0
- ARV discount +15.0/15.0
- Appreciation +10.0/10.0
- DSCR +7.5/10.0
- 1% rule +6.0/10.0
- Rent growth +4.4/5.0
- Livability +3.7/5.0
- Condition / age +2.5/5.0
- Schools +1.2/10.0
$160,000
🖨 Deal sheet (PDF) 📄 Offer letter ✓ Due diligence
Listing remarks MLS
MOTIVATED SELLER says make an offer!!! This move-in ready, 5 bedroom Split Foyer has been beautifully remodeled from top to bottom. Updates since Dec. 2012 include: new roof, new driveway and walkway, new windows, new flooring throughout including ceramic tile, wood veneer and carpeting. Kitchen boasts new cabinets, countertops, sink and stainless steel appliances including, gas range, microwave and dishwasher. Both bathrooms completely remodeled. New lighting, new drywall, 6 panel doors and trim extend throughout the home. Finished, walk-out lower level includes two additional bedrooms and an approximately 700 sq. ft. family room, great for entertaining.
Key facts
- 7,801 sq ft lot
- 2 garage spots
- Built 1976
Property features AI
Exterior
- Parking: Attached 2-car garage
- Utilities: Public water; Public sewer; Electricity (Ameren); Natural gas connected
- Home design: Single-family residence; Multi/split levels; Residential property
- Construction: Vinyl siding
- Exterior features: Back yard; Front yard; Level lot
Interior
- Bedrooms: 5 bedrooms total (3 on the main level, 2 on the lower level)
- Flooring: Carpet; Laminate
- Bathrooms: 2 full bathrooms (both on the main level)
- Heating & cooling: Forced air heating (natural gas); Central air conditioning with ceiling fans; electric
- Interior features: Partially finished full walk-out basement; Carpet and laminate flooring
Neighborhood map
What this means for you Summary
Snapshot
- This is a 3-bed/2.0-bath single-family listed at $160k.
Deal economics
- At list price, monthly cash flow is $294 ($4k/yr) — positive.
- The deal already cash-flows at list — no discount required.
- Meets the 1% rule at list price ($2k rent vs $160k).
- Cap rate 8.5% vs local median 6.3% in Florissant — top-decile yield for the area; either an underpriced asset or a hidden risk that comps aren't pricing in. Stress-test before assuming the spread holds.
Location & tenants
- Location reads 73/100 on livability (#82 in MO) — a middle-class / working-renter tenant base. Strengths: cost of living A+, housing A+, health & safety B+; Watch: crime C-, amenities D+, commute F.
- Ferguson-Florissant R-II (suburban): math 7% / reading 20% proficiency, ranked #311 of 324 in MO (top 96%) — low school quality limits family demand, transient renter base, plan for 1-2y turnover; 70% free/reduced lunch — lower-income household profile, screen leases tightly.
- Zoned schools: Mccluer North High (math 5% / reading 28%, grade F, #487 of 521 statewide, top 93%, 1,136 students, 100% FRL) — zoned schools average 100% FRL vs 70% district-wide (30 pts higher); higher-poverty schools than district average — tighter screening recommended.
- Market conditions: Rents rising fast (+7.5%/yr); 218 active listings in the ZIP; 25 comparable units currently listed for rent nearby; rentals at typical pace (median 16d on market — plan ~3-4 weeks tenant-placement turnaround); 44% of comp listings sitting > 30 days — soft ceiling on asking rent; 920 units permitted in St. Louis County in 2024 (250 in 5+ unit buildings).
- This rent runs 32% of the median local income ($67k/yr) — at the standard rent-burdened threshold; future hikes will face affordability resistance.
Forward outlook
- In year one you build about $17k of equity ($1k loan paydown + $16k appreciation (10.0% local appreciation)).
- At projected returns (10.0% appreciation + 7.5% rent growth), your $45k cash investment doubles in ~3 years — after that, you're playing with house money.
- By year 3, paydown + projected appreciation supports a ~$43k cash-out refi (75% LTV) — recoverable capital for the next deal without selling this one.
Negotiation context
- Only 9 days on market — expect competitive offers; lowballing is unlikely to land.
- 2 sale attempts since 13y ago with the ask held roughly flat each time — persistent listings suggest the price (not the market) is what's stuck; bring a comps-based counter.
- Current owner paid $18k; list at $160k implies a 772% gain — meaningful room to come down on a strong offer.
Risks & watch-outs
- Climate carrying-cost: extreme-heat days projected 7→21/yr by 2055 (HVAC capex compounding) — expect insurance premiums to compound above CPI over the hold.
Questions for the listing agent
- Built in 1976 — when were the roof, HVAC, electrical panel, plumbing, and water heater last replaced?
- Is there a deadline driving the sale (1031 exchange, divorce, estate, relocation)? That informs how much negotiation room exists.
- Schools are D-rated, which usually means shorter tenancies and higher turnover. Who's the typical renter profile here, and what's been the actual vacancy rate?
- What's the average days-on-market for RENTAL listings here right now (not sales)? A rising rental-DOM trend means longer vacancies and softer asking-rent achievability than the comps imply.
- What's the recent tenant-quality profile in this submarket — average credit score on applications, eviction rate, late-payment / NSF rate, and stable-employment percentage? A property-management company in the area should have these aggregated.
- How much new for-sale + rental construction is in the pipeline within 1–3 miles? Heavy new supply typically softens prices + rents 12–24 months out; constrained supply supports both.
Investment metrics
- 1% rule
- 1.10% ✓
- Cap rate
- 8.50%
- Cash-on-cash
- 7.88%
- DSCR
- 1.35
- GRM
- 7.5
CMA / ARV
- ARV (median comp)
- $215,175
- List price
- $160,000
- Delta
- -25.64%
- Verdict
- UNDERPRICED
- Comps
- 20 within 1.0 mi
Show comp detail 12 sales within ~0.75 mi
| Address | Dist | Beds/Ba | Sqft | Sold | Price | $/sf | Match |
|---|---|---|---|---|---|---|---|
| 2940 Dover Dr | 0.25mi | 3/2.0 | 1,402 (+3%) | 1mo | $210,000 | $150 | 83 |
| 2560 Woodsage Dr | 0.39mi | 3/3.0 | 1,390 (+2%) | 1mo | $220,000 | $158 | 73 |
| 4 Cameo Ct | 0.45mi | 3/2.5 | 1,405 (+3%) | 1mo | $150,000 | $107 | 71 |
| 2945 Dover Dr | 0.23mi | 4/2.0 (+1) | 1,470 (+8%) | 2mo | $185,400 | $126 | 69 |
| 1680 Horseshoe Dr | 0.74mi | 3/2.0 | 1,364 (+0%) | 1mo | $191,000 | $140 | 64 |
| 2405 Orleans Ln | 0.55mi | 3/1.5 | 1,424 (+5%) | 2mo | $239,900 | $168 | 63 |
| 2910 Wellington Dr | 0.27mi | 4/2.0 (+1) | 1,517 (+12%) | 2mo | $159,900 | $105 | 62 |
| 8 Winners Cir | 0.63mi | 4/2.0 (+1) | 1,312 (-4%) | 5mo | $249,900 | $190 | 56 |
| 7 Darwin Ct | 0.35mi | 4/2.0 (+1) | 1,560 (+15%) | 0mo | $200,000 | $128 | 54 |
| 9 Darwin Ct | 0.38mi | 3/3.0 | 1,540 (+13%) | 4mo | $235,000 | $153 | 53 |
| 1730 Kay Dr | 0.59mi | 3/1.0 | 1,467 (+8%) | 3mo | $150,000 | $102 | 52 |
| 1585 Pepperhill Dr | 0.64mi | 3/2.0 | 1,204 (-12%) | 2mo | $225,000 | $187 | 49 |
Match score weights: distance 35% · size 25% · config 20% · recency 20%. Top-matched comps best support the ARV.
Projected returns pro-forma
10.0% appreciation · 7.51% rent growth · sell at horizon
- IRR
- 31.9%
- Equity multiple
- 3.55×
- Total profit
- $114,276
- Equity at exit
- $144,141
- IRR
- 29.1%
- Equity multiple
- 8.64×
- Total profit
- $342,209
- Equity at exit
- $310,845
Cash invested: $44,800 (down + closing). Projections, not guarantees.
Landlord ↔ Tenant lean methodology
- Overall (STATE)
- 81 Strongly Landlord-Friendly
- State Missouri
- 81 Strongly Landlord-Friendly · R+10
- County
- — inherits STATE
- City
- — inherits STATE
ZIP-level market 63033
- Home prices YoY
- 2.5%
- Rents YoY
- 7.5%
- Active inventory
- 218
- Price-to-rent
- 7.5×
Monthly cashflow live
- Estimated rent
- $1,766 high interval (Pro) →
- Mortgage (P&I)
- −$839
- Tax from tax record
- −$196 /mo · $2,348/yr
- Insurance
- −$67
- HOA
- −$0
- Vacancy / Maint / Mgmt
- −$371
- Net cashflow
- $294
Break-even live
Sensitivity live
| Price | -10% $385 | -5% $339 | +0% $294 | +5% $249 | +10% $204 |
|---|---|---|---|---|---|
| Rent | -10% $155 | -5% $224 | +0% $294 | +5% $364 | +10% $434 |
| Rate | -1.0pp $375 | -0.5pp $335 | base $294 | +0.5pp $253 | +1.0pp $210 |
UW: 25.0% down · 7.5% · 30yr · 1.5% tax · 5.0% vac · 8.0% maint · 8.0% mgmt
Financing live
Cash to close
- Down payment
- $40,000
- Closing costs
- $4,800
- Reserves months
- —
- Total cash needed
- —
Loan-product check · same deal, 3 products live
Conventional
25% down · 7.5% · 30yr
- Down + closing
- —
- Monthly P&I
- —
- Monthly cashflow
- —
- DSCR
- —
- Eligible?
- —
Personal DTI + credit; lowest rate.
DSCR
20% down · 8.5% · 30yr
- Down + closing
- —
- Monthly P&I
- —
- Monthly cashflow
- —
- DSCR
- —
- Eligible?
- —
No personal income docs; deal must DSCR.
Hard money
10% down · 12.0% · 12mo
- Down + closing
- —
- Monthly P&I
- —
- Monthly cashflow
- —
- DSCR
- —
- Eligible?
- —
Short-term bridge; refi at stabilization.
Rent comps 25 comps
| Address | Beds | Baths | Sqft | Rent | $/sqft | DOM | Units | Dist |
|---|---|---|---|---|---|---|---|---|
| 1983 Greenheath Dr Florissant, MO | 3.0 | 2.0 | 1040 | $1,331 | $1.28 | 3d | 1 | 0.38mi |
| 1785 Trotter Way Florissant, MO | 3.0 | 2.0 | 1297 | $1,806 | $1.39 | 8d | 1 | 0.53mi |
| 13 Cricket Ct Florissant, MO | 4.0 | 3.0 | 1560 | $2,550 | $1.63 | 44d | 1 | 0.56mi |
| 330 Moule Dr Florissant, MO | 3.0 | 1.0 | 1014 | $1,575 | $1.55 | 44d | 1 | 0.56mi |
| 1710 Kay Dr Florissant, MO | 3.0 | 1.0 | 960 | $1,500 | $1.56 | 2d | 1 | 0.63mi |
| 3144 Sunswept Pk Ct Florissant, MO | 1.0–3.0 | 1.0–2.0 | 818 | $1,250 | $1.53 | 2d | 12 | 0.71mi |
| 1740 Deborah Dr Florissant, MO | 3.0 | 2.5 | 1650 | $1,750 | $1.06 | 18d | 1 | 0.71mi |
| 2990 Santiago Dr Florissant, MO | 2.0 | 2.0 | 984 | $1,200 | $1.22 | 44d | 1 | 0.72mi |
| 1600 Horseshoe Dr Florissant, MO | 3.0 | 2.0 | 1314 | $1,550 | $1.18 | 44d | 1 | 0.78mi |
| 9 Saint Celeste Dr Florissant, MO | 3.0 | 1.0 | 992 | $1,450 | $1.46 | 44d | 1 | 0.93mi |
| 3 Cantabrian Ct Florissant, MO | 3.0 | 2.0 | 1436 | $1,881 | $1.31 | 15d | 1 | 0.94mi |
| 3 Champlain Ct Florissant, MO | 3.0 | 1.0 | 1100 | $1,600 | $1.45 | 44d | 1 | 0.95mi |
| 775 Sherwood Dr Florissant, MO | 3.0 | 1.0 | 1023 | $1,690 | $1.65 | 44d | 1 | 1.02mi |
| 470 Hundley Dr Florissant, MO | 3.0 | 2.0 | 962 | $1,595 | $1.66 | 44d | 1 | 1.12mi |
| 945 Paddock Dr Florissant, MO | 4.0 | 2.0 | 1875 | $1,850 | $0.99 | 5d | 1 | 1.17mi |
| 2942 Chance Dr Florissant, MO | 3.0 | 1.0 | 912 | $1,700 | $1.86 | 13d | 1 | 1.17mi |
| 2075 Cordoba Dr Florissant, MO | 3.0 | 2.0 | 1523 | $1,850 | $1.21 | 15d | 1 | 1.19mi |
| 2857 Dawnview Dr Florissant, MO | 3.0 | 1.0 | 890 | $1,325 | $1.49 | 8d | 1 | 1.33mi |
| 4 Sharon Ct Florissant, MO | 3.0 | 2.0 | 1108 | $1,800 | $1.62 | 3d | 1 | 1.36mi |
| 1095 Humes Ln Florissant, MO | 3.0 | 1.5 | 1100 | $1,650 | $1.50 | 5d | 1 | 1.39mi |
| 560 Jamaica Pl Florissant, MO | 3.0 | 2.0 | 1350 | $1,653 | $1.22 | 44d | 1 | 1.41mi |
| 1725 Saint Catherine St Florissant, MO | 3.0 | 1.0 | 1107 | $1,800 | $1.63 | 15d | 1 | 1.45mi |
| 765 Babler Dr Florissant, MO | 3.0 | 2.0 | 888 | $1,700 | $1.91 | 8d | 1 | 1.46mi |
| 3930 Belcroft Dr Florissant, MO | 3.0 | 3.0 | 1408 | $1,935 | $1.37 | 44d | 1 | 1.46mi |
| 855 Daniel Boone Dr Florissant, MO | 3.0 | 1.0 | 964 | $1,400 | $1.45 | 44d | 1 | 1.47mi |
Listing history 6 events
-
2026-05-31status $160,000 Pending 9 DOM
-
2026-05-12historical $160,000 1743-char remark
-
2013-05-08soldstatus 664-char remark
Show marketing remark (664 chars)
MOTIVATED SELLER says make an offer!!! This move-in ready, 5 bedroom Split Foyer has been beautifully remodeled from top to bottom. Updates since Dec. 2012 include: new roof, new driveway and walkway, new windows, new flooring throughout including ceramic tile, wood veneer and carpeting. Kitchen boasts new cabinets, countertops, sink and stainless steel appliances including, gas range, microwave and dishwasher. Both bathrooms completely remodeled. New lighting, new drywall, 6 panel doors and trim extend throughout the home. Finished, walk-out lower level includes two additional bedrooms and an approximately 700 sq. ft. family room, great for entertaining.
-
2013-02-15$110,000 664-char remark
Show marketing remark (664 chars)
MOTIVATED SELLER says make an offer!!! This move-in ready, 5 bedroom Split Foyer has been beautifully remodeled from top to bottom. Updates since Dec. 2012 include: new roof, new driveway and walkway, new windows, new flooring throughout including ceramic tile, wood veneer and carpeting. Kitchen boasts new cabinets, countertops, sink and stainless steel appliances including, gas range, microwave and dishwasher. Both bathrooms completely remodeled. New lighting, new drywall, 6 panel doors and trim extend throughout the home. Finished, walk-out lower level includes two additional bedrooms and an approximately 700 sq. ft. family room, great for entertaining.
-
2012-11-29soldstatus $18,350
-
1980-11-01soldstatus
ⓘ Source: listings_history table (triggers on properties + properties_extension) + one-shot
backfill from property_details.listing_events for pre-trigger history.
Tax reassessment forecast MO · Resets to sale price
- Current annual tax
- $2,348 · $196/mo
- Projected year-2 tax
- $2,348 · $196/mo
- Expected delta
- $0/yr ($0/mo · 0.0%)
ⓘ Screening estimate from a state-policy table — verify with the county assessor before closing.
Climate risk First Street
- Flood 1/10 Low FEMA zone X (unshaded) · 0% chance over 30 yrs
- Wildfire 1/10 Low
- Heat 5/10 Major 7 d/yr ≥105°F today · 21 d/yr by 30 yrs out
- Wind 2/10 Low 100% chance of damaging wind over 30 yrs
- Air quality 3/10 Moderate 3 unhealthy d/yr today · 5 by 30 yrs out
Nearby sold comps map
Loading sold comps map…
Walkable amenities ~0.75 mi
Loading nearby amenities…
Taxation est. · year 1
- Rental income
- $21,198
- − Mortgage interest
- −$8,962
- − Property taxes
- −$2,348
- − Insurance
- −$800
- − Repairs & maintenance
- −$1,696
- − Management
- −$1,696
- − Depreciation
- −$4,655
- Taxable income
- $1,041
- Est. tax owed @ 24.0%
- −$250
- After-tax cash flow
- $3,279/yr
For passive investors: Depreciation is non-cash, so a rental often shows a tax loss while cash-flowing — sheltering income. Rental losses are passive: they offset passive income freely, and up to $25,000/yr can offset ordinary (W-2) income if you actively participate and your MAGI is under $100k (phasing out to $0 by $150k); unused losses carry forward. On sale, claimed depreciation is recaptured at up to 25%, and gains may owe capital-gains tax (a 1031 exchange can defer both). Figures are a year-1 estimate at your 24.0% rate — not tax advice; consult a CPA.
Schools (NCES district)
- District
- Ferguson-Florissant R-II
- NCES district ID
- 2912010
- Math proficiency
- 7% ▼ -9.00%
- Reading proficiency
- 20% ▼ -6.00%
- Median HH income
- $44,610
- Composite
- 11.96/100
- National rank
- #9666
- State rank
- #311 of 324 in MO
Livability — Florissant
- Score
- 73/100
- State rank
- #82
- US rank
- #5406
Category grades
Schools grade is shown separately in the Schools card above.
Census & demographics
- County
- Saint Louis County · 888,823 people
- City population
- 69,104
- Metro
- St. Louis, MO-IL
- Population (ZIP)
- 43,056
- Household income
- $66,776
- Rent vs Own
- Severe rent burden
- 1429.0
Population outlook (St. Louis County) Hauer SSP2
- Today (2025)
- 1,025,227 people
- By 2030
- 1,028,023 · +0.3%
- By 2040
- 1,020,940 · -0.4%
- By 2050
- 1,007,280 · -1.8%
- By 2075
- 987,277 · -3.7%
- By 2100
- 921,984 · -10.1%
Race, ethnicity, and origin ACS 2023
- Neighborhood character
- Predominantly Black (71%)
- Race & ethnicity
- Black 71% White 23% Two or more races 4% Hispanic / Latino 1%
- Common ancestry
- Romanian 1% Lithuanian 1% Italian 1%
- Foreign-born
- 3% · Canada, Vietnam
- Languages at home
- 95% English-only · Spanish 1% French/Haitian/Cajun 1%
Political lean MEDSL · St. Louis
- 2024 margin
- Strong D (+23.4) · D 60.8% · R 37.4% · Other 1.7%
- 2008→2024 swing
- +3.5pp toward D · 2008: 19.9pp · 2024: 23.4pp
- All cycles
- 2024: D+23.4 2020: D+24.0 2016: D+16.2 2012: D+13.7 2008: D+19.9
Not yet ingested
- Civics
- —
Market trends
- HPI YoY
- ▲ 13.78%
- Current HPI
- 570.6
- Rent YoY
- ▲ 7.51%
- Metro
- St. Louis, MO-IL
- State GDP YoY
- ▲ 1.84%
- F500 in state
- 20
Industry mix (Fortune 500 HQ in MO)
| Industry | F500 HQs | Revenue |
|---|---|---|
| Healthcare | 1 | $163B |
|
||
| Insurance | 1 | $21B |
|
||
| Industrial Technology | 1 | $17B |
|
||
| Retail | 1 | $16B |
|
||
| Industrial Distribution | 1 | $10B |
|
||
| Utilities | 1 | $9B |
|
||
Price history
+771.9% since first listed7 events — show timeline
- 2026-05-30 Pending — MARIS as Distributed by MLS Grid
- 2026-05-21 Listed $160,000 MARIS as Distributed by MLS Grid
- 2026-05-12 Coming Soon $160,000 MARIS as Distributed by MLS Grid
- 2013-05-08 Sold (MLS) — MARIS as Distributed by MLS Grid
- 2013-02-15 Listed $110,000 MARIS as Distributed by MLS Grid
- 2012-11-29 Sold (Public Records) $18,350 Public Records
- 1980-11-01 Sold (Public Records) — Public Records
Property tax history
+4.3%/yrLatest (2022): $2,348 · +0.3% YoY. Source: county tax records.
Cash-flow waterfall
monthlySold comps — $/sqft
last 12 mo · ≤1 miLoading sold comps…