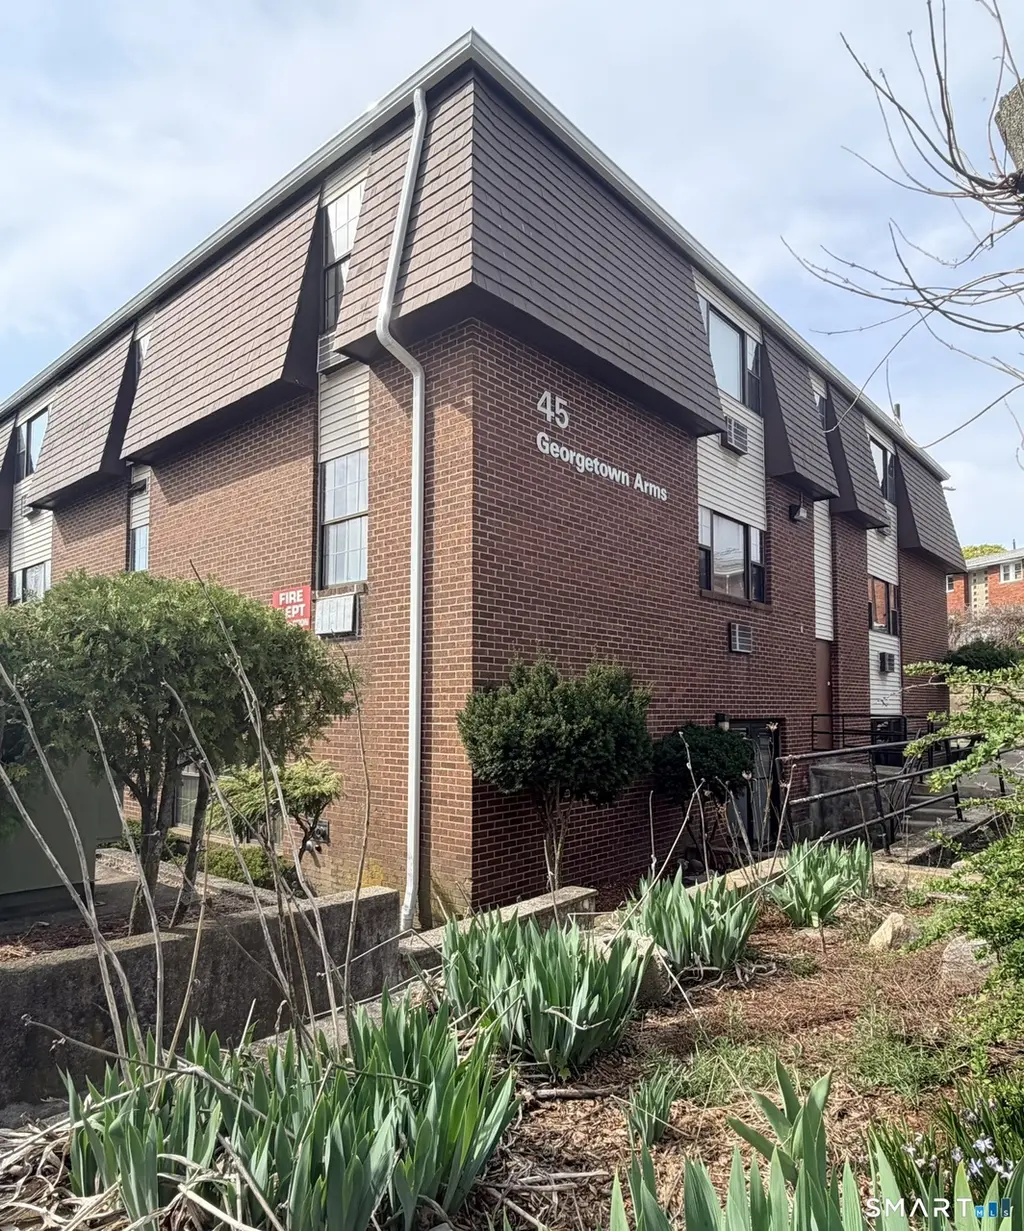
45 Stevens St Unit 1D · Bridgeport, CT
Flood risk 1/10 · Minimal
- FEMA flood zone
- X (unshaded)
- Chance of flooding over 30 yrs
- 0.0%
- Est. flood insurance / yr
- $507 – $1,088
Fire risk 1/10 · Minimal
- Est. fire insurance / yr
- $829 – $1,539
Heat risk 6/10 · Moderate
- Hot days now (above 97°F)
- 7 days/yr
- Hot days in 30 yrs
- 15 days/yr
Wind risk 6/10 · Moderate
- Chance of severe wind over 30 yrs
- 41.0%
Air-quality risk 4/10 · Minor
- Unhealthy air days now
- 5 days/yr
- Unhealthy air days in 30 yrs
- 7 days/yr
Risk factors via First Street. Map © Google.
Why this score? — see what drove the C+ grade
The composite is a weighted blend of 9 inputs, each scored 0–100. Each bar is that input's sub-score; the figure is the points it added to the 100-point composite (weight × sub-score).
- Cash flow +22.3/30.0
- ARV discount +14.7/15.0
- 1% rule +8.7/10.0
- DSCR +7.1/10.0
- Livability +4.0/5.0
- Rent growth +3.3/5.0
- Condition / age +2.5/5.0
- Schools +1.2/10.0
- Appreciation +0.0/10.0
$134,000
🖨 Deal sheet (PDF) 📄 Offer letter ✓ Due diligence
Listing remarks MLS
Well maintained 1 bedroom, 1 bath condo featuring a functional galley kitchen and an open concept living and dining area, perfect for comfortable everyday living and entertaining. The unit offers a spacious bedroom, ample closet space, and great natural light throughout. Ideal for first time buyers, downsizers, or investors. Conveniently located near shopping, dining, and major highways. Don't miss this opportunity!
Key facts
- Open concept living
- Galley kitchen
- Ample closet space
Tags
Neighborhood map
What this means for you Summary
Snapshot
- This is a 1-bed/1.0-bath condo listed at $134k.
Deal economics
- At list price, monthly cash flow is $221 ($3k/yr) — positive.
- The deal already cash-flows at list — no discount required.
- Meets the 1% rule at list price ($2k rent vs $134k).
- Recommended offer: $132k (1.5% below list) — sets the bar for market timing.
- Cap rate 8.3% vs local median 5.0% in Bridgeport — top-decile yield for the area; either an underpriced asset or a hidden risk that comps aren't pricing in. Stress-test before assuming the spread holds.
Location & tenants
- Location reads 81/100 on livability (#15 in CT, #1,374 nationally) — a professional / high-income tenant draw. Strengths: amenities A+, commute A+, health & safety A+; Watch: crime C-, employment D+, schools D-.
- Bridgeport School District (urban): math 9% / reading 19% proficiency, ranked #151 of 153 in CT (top 99%) — low school quality limits family demand, transient renter base, plan for 1-2y turnover; 97% free/reduced lunch — lower-income household profile, screen leases tightly.
- Market conditions: Rents rising (+3.1%/yr); 152 active listings in the ZIP; 13 comparable units currently listed for rent nearby; rentals at typical pace (median 22d on market — plan ~3-4 weeks tenant-placement turnaround); 852 units permitted in Greater Bridgeport Planning Region in 2024 (698 in 5+ unit buildings).
- This rent runs 30% of the median local income ($73k/yr) — at the standard rent-burdened threshold; future hikes will face affordability resistance.
Forward outlook
- Local home prices are declining (-3.0%/yr); year-one equity from $926 of loan paydown is wiped out by about $4k of value loss. Plan a longer hold.
Negotiation context
- It's been on market 22 days — a 2% lower offer ($132k) is reasonable based on typical stale-listing flexibility.
- 2 sale attempts since 20y ago with the ask held roughly flat each time — persistent listings suggest the price (not the market) is what's stuck; bring a comps-based counter.
- Current owner paid $72k; list at $134k implies a 86% gain — meaningful room to come down on a strong offer.
Risks & watch-outs
- Climate carrying-cost: major wind risk, 41% chance of damaging wind over 30y; extreme-heat days projected 7→15/yr by 2055 (HVAC capex compounding) — expect insurance premiums to compound above CPI over the hold.
Questions for the listing agent
- What does the HOA fee cover, when was the last increase, and are there any pending special assessments or reserve-fund shortfalls?
- Any open or pending special assessments — roof, HVAC, plumbing, elevator, façade? What's the per-unit balance and payoff schedule, and is the seller paying it off at close or rolling it to the buyer?
- Is there a deadline driving the sale (1031 exchange, divorce, estate, relocation)? That informs how much negotiation room exists.
- Schools are D-rated, which usually means shorter tenancies and higher turnover. Who's the typical renter profile here, and what's been the actual vacancy rate?
- What's the average days-on-market for RENTAL listings here right now (not sales)? A rising rental-DOM trend means longer vacancies and softer asking-rent achievability than the comps imply.
- What's the recent tenant-quality profile in this submarket — average credit score on applications, eviction rate, late-payment / NSF rate, and stable-employment percentage? A property-management company in the area should have these aggregated.
- How much new apartment / multifamily construction is in the pipeline within 1–3 miles? Heavy new supply (>2% of stock underway) typically softens rents 12–24 months out; light construction supports rent growth.
Investment metrics
- 1% rule
- 1.37% ✓
- Cap rate
- 8.27%
- Cash-on-cash
- 7.06%
- DSCR
- 1.31
- GRM
- 6.1
CMA / ARV
- ARV (median comp)
- $159,335
- List price
- $134,000
- Delta
- -15.90%
- Verdict
- UNDERPRICED
- Comps
- 20 within 1.0 mi
Projected returns pro-forma
-3.0% appreciation · 3.12% rent growth · sell at horizon
- IRR
- -5.1%
- Equity multiple
- 0.81×
- Total profit
- $-7,223
- Equity at exit
- $19,980
- IRR
- 4.9%
- Equity multiple
- 1.36×
- Total profit
- $13,601
- Equity at exit
- $11,586
Cash invested: $37,520 (down + closing). Projections, not guarantees.
Landlord ↔ Tenant lean methodology
- Overall (STATE)
- 27 Tenant-Leaning
- State Connecticut
- 27 Tenant-Leaning · D+7
- County
- — inherits STATE
- City
- — inherits STATE
ZIP-level market 06606
- Rents YoY
- 3.1%
- Active inventory
- 152
- Price-to-rent
- 6.1×
Monthly cashflow live
- Estimated rent
- $1,842 high interval (Pro) →
- Mortgage (P&I)
- −$703
- Tax from tax record
- −$127 /mo · $1,520/yr
- Insurance
- −$56
- HOA
- −$349
- Vacancy / Maint / Mgmt
- −$387
- Net cashflow
- $221
Break-even live
Sensitivity live
| Price | -10% $296 | -5% $259 | +0% $221 | +5% $183 | +10% $145 |
|---|---|---|---|---|---|
| Rent | -10% $75 | -5% $148 | +0% $221 | +5% $293 | +10% $366 |
| Rate | -1.0pp $288 | -0.5pp $255 | base $221 | +0.5pp $186 | +1.0pp $151 |
UW: 25.0% down · 7.5% · 30yr · 1.5% tax · 5.0% vac · 8.0% maint · 8.0% mgmt
Financing live
Cash to close
- Down payment
- $33,500
- Closing costs
- $4,020
- Reserves months
- —
- Total cash needed
- —
Loan-product check · same deal, 3 products live
Conventional
25% down · 7.5% · 30yr
- Down + closing
- —
- Monthly P&I
- —
- Monthly cashflow
- —
- DSCR
- —
- Eligible?
- —
Personal DTI + credit; lowest rate.
DSCR
20% down · 8.5% · 30yr
- Down + closing
- —
- Monthly P&I
- —
- Monthly cashflow
- —
- DSCR
- —
- Eligible?
- —
No personal income docs; deal must DSCR.
Hard money
10% down · 12.0% · 12mo
- Down + closing
- —
- Monthly P&I
- —
- Monthly cashflow
- —
- DSCR
- —
- Eligible?
- —
Short-term bridge; refi at stabilization.
Rent comps 13 comps
| Address | Beds | Baths | Sqft | Rent | $/sqft | DOM | Units | Dist |
|---|---|---|---|---|---|---|---|---|
| 30 Quarry St Bridgeport, CT | 1.0–2.0 | 1.0 | 805 | $1,720 | $2.14 | 24d | 3 | 0.10mi |
| 380 Gurdon St Unit 1 Bridgeport, CT | 1.0 | 1.0 | 744 | $2,000 | $2.69 | 22d | 1 | 0.34mi |
| 614 Earl Ave Bridgeport, CT | 2.0 | 1.0 | 748 | $2,300 | $3.07 | 44d | 1 | 0.37mi |
| 950 Lindley St Bridgeport, CT | 1.0 | 1.0 | 650 | $1,650 | $2.54 | 19d | 1 | 0.41mi |
| 343 Wayne St Unit 1st Bridgeport, CT | 1.0 | 1.0 | 650 | $1,300 | $2.00 | 44d | 1 | 0.50mi |
| 343 Wayne St Unit 1st Bridgeport, CT | 1.0 | 1.0 | 650 | $1,300 | $2.00 | 3d | 1 | 0.50mi |
| 365 Glendale Ave Unit B2 Bridgeport, CT | 1.0 | 1.0 | 661 | $1,600 | $2.42 | 44d | 1 | 0.80mi |
| 66 Dodd Ave Unit 2 Bridgeport, CT | 2.0 | 1.0 | 728 | $2,450 | $3.37 | 12d | 1 | 0.92mi |
| 66 Dodd Ave Bridgeport, CT | 1.0 | 1.0 | 728 | $2,150 | $2.95 | 12d | 1 | 0.92mi |
| 150 Anton St Bridgeport, CT | 1.0 | 1.0–1.5 | 532 | $2,090 | $3.92 | 3d | 4 | 1.05mi |
| 80 Taft Ave Bridgeport, CT | 1.0–2.0 | 1.0 | 645 | $1,750 | $2.71 | 44d | 2 | 1.16mi |
| 120 Morgan Ave Bridgeport, CT | 1.0 | 1.0 | 545 | $1,500 | $2.75 | 24d | 1 | 1.23mi |
| 116 Ogden St Unit 120 Bridgeport, CT | 2.0 | 1.0 | 688 | $2,375 | $3.45 | 3d | 1 | 1.43mi |
HOA detail condo
- Monthly dues
- $349 · $4,188/yr
- Assessments
- None detected in remarks — confirm with the listing agent.
Listing history 5 events
-
2026-05-08status Under Contract 419-char remark
Show marketing remark (419 chars)
Well maintained 1 bedroom, 1 bath condo featuring a functional galley kitchen and an open concept living and dining area, perfect for comfortable everyday living and entertaining. The unit offers a spacious bedroom, ample closet space, and great natural light throughout. Ideal for first time buyers, downsizers, or investors. Conveniently located near shopping, dining, and major highways. Don't miss this opportunity!
-
2026-04-15$134,000 Active 419-char remark
Show marketing remark (419 chars)
Well maintained 1 bedroom, 1 bath condo featuring a functional galley kitchen and an open concept living and dining area, perfect for comfortable everyday living and entertaining. The unit offers a spacious bedroom, ample closet space, and great natural light throughout. Ideal for first time buyers, downsizers, or investors. Conveniently located near shopping, dining, and major highways. Don't miss this opportunity!
-
2006-04-12soldstatus $72,000
-
2006-04-11soldstatus $72,000
-
2006-02-09$79,500
ⓘ Source: listings_history table (triggers on properties + properties_extension) + one-shot
backfill from property_details.listing_events for pre-trigger history.
Tax reassessment forecast CT · Partial reset (capped growth)
- Current annual tax
- $1,520 · $127/mo
- Projected year-2 tax
- $2,194 · $183/mo
- Expected delta
- +$674/yr (+$56/mo · 44.3%)
ⓘ Screening estimate from a state-policy table — verify with the county assessor before closing.
Climate risk First Street
- Flood 1/10 Low FEMA zone X (unshaded) · 0% chance over 30 yrs
- Wildfire 1/10 Low
- Heat 6/10 Major 7 d/yr ≥97°F today · 15 d/yr by 30 yrs out
- Wind 6/10 Major 41% chance of damaging wind over 30 yrs
- Air quality 4/10 Moderate 5 unhealthy d/yr today · 7 by 30 yrs out
Nearby sold comps map
Loading sold comps map…
Walkable amenities ~0.75 mi
Loading nearby amenities…
Taxation est. · year 1
- Rental income
- $22,099
- − Mortgage interest
- −$7,506
- − Property taxes
- −$1,520
- − Insurance
- −$670
- − Repairs & maintenance
- −$1,768
- − Management
- −$1,768
- − HOA
- −$4,188
- − Depreciation
- −$3,898
- Taxable income
- $781
- Est. tax owed @ 24.0%
- −$187
- After-tax cash flow
- $2,460/yr
For passive investors: Depreciation is non-cash, so a rental often shows a tax loss while cash-flowing — sheltering income. Rental losses are passive: they offset passive income freely, and up to $25,000/yr can offset ordinary (W-2) income if you actively participate and your MAGI is under $100k (phasing out to $0 by $150k); unused losses carry forward. On sale, claimed depreciation is recaptured at up to 25%, and gains may owe capital-gains tax (a 1031 exchange can defer both). Figures are a year-1 estimate at your 24.0% rate — not tax advice; consult a CPA.
Schools (NCES district)
- District
- Bridgeport School District
- NCES district ID
- 0900450
- Math proficiency
- 9% ▼ -7.00%
- Reading proficiency
- 19% ▼ -10.00%
- Median HH income
- $41,507
- Composite
- 12.09/100
- National rank
- #9656
- State rank
- #151 of 153 in CT
Livability — Bridgeport
- Score
- 81/100
- State rank
- #15
- US rank
- #1374
Category grades
Schools grade is shown separately in the Schools card above.
Census & demographics
- Census place
- Bridgeport, CT
- County
- Fairfield County · 765,532 people
- City population
- 149,153
- Metro
- Bridgeport-Stamford-Norwalk, CT
- Population (ZIP)
- 49,308
- Household income
- $73,372
- Rent vs Own
- Severe rent burden
- 2163.0
Population outlook (Greater Bridgeport County) Hauer SSP2
- By 2040
- 365,581
Race, ethnicity, and origin ACS 2023
- Neighborhood character
- Highly diverse neighborhood (Simpson 0.73)
- Race & ethnicity
- Hispanic / Latino 37% White 31% Black 19% Two or more races 11% Asian 7%
- Hispanic origin (detail)
- Mexican 5% Puerto Rican 12% Dominican 4%
- Common ancestry
- Estonian 5% Russian 4% Romanian 3%
- Foreign-born
- 37% · Canada, Jamaica, Vietnam
- Languages at home
- 50% English-only · Spanish 27% Other Indo-European 15% French/Haitian/Cajun 2%
Political lean MEDSL · Greater Bridgeport
- 2024 margin
- Strong D (+23.3) · D 60.9% · R 37.6% · Other 1.5%
- All cycles
- 2024: D+23.3
Not yet ingested
- Civics
- —
Market trends
- HPI YoY
- ▼ -270.11%
- Current HPI
- 345.647
- Rent YoY
- ▲ 3.12%
- Metro
- Bridgeport-Stamford-Norwalk, CT
- State GDP YoY
- ▲ 1.06%
- F500 in state
- 38
Industry mix (Fortune 500 HQ in CT)
| Industry | F500 HQs | Revenue |
|---|---|---|
| Industrial Machinery | 4 | $38B |
|
||
| Insurance | 3 | $71B |
|
||
| Financial Services | 2 | $25B |
|
||
| Transportation / Logistics | 2 | $18B |
|
||
| Healthcare | 1 | $247B |
|
||
| Telecommunications | 1 | $55B |
|
||
Price history
+68.6% since first listed5 events — show timeline
- 2026-05-08 Pending — Smart MLS
- 2026-04-15 Listed $134,000 Smart MLS
- 2006-04-12 Sold (Public Records) $72,000 Public Records
- 2006-04-11 Sold (MLS) $72,000 Smart MLS
- 2006-02-09 Listed $79,500 Smart MLS
Property tax history
-4.4%/yrLatest (2023): $1,520 · +0.0% YoY. Source: county tax records.
Cash-flow waterfall
monthlySold comps — $/sqft
last 12 mo · ≤1 miLoading sold comps…