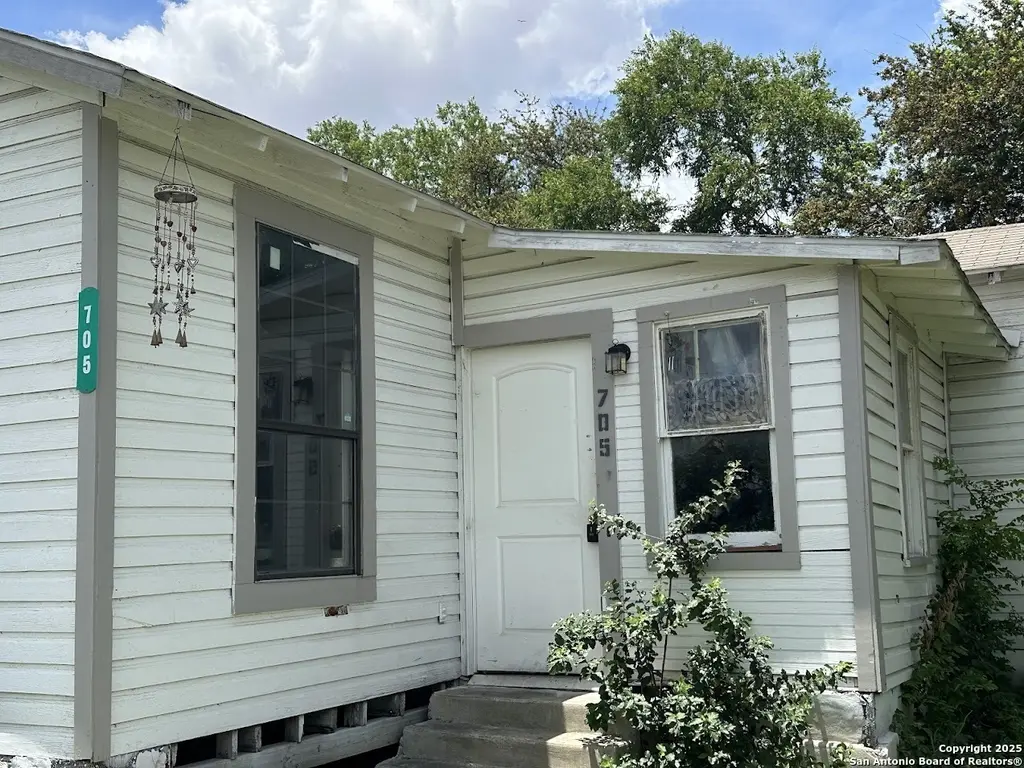
705 Paso Hondo · San Antonio, TX
Flood risk 1/10 · Minimal
- FEMA flood zone
- X (unshaded)
- Chance of flooding over 30 yrs
- 0.0%
- Est. flood insurance / yr
- $507 – $1,088
Fire risk 1/10 · Minimal
- Est. fire insurance / yr
- $1,222 – $2,270
Heat risk 8/10 · Major
- Hot days now (above 108°F)
- 6 days/yr
- Hot days in 30 yrs
- 19 days/yr
Wind risk 8/10 · Major
- Chance of severe wind over 30 yrs
- 80.0%
Air-quality risk 2/10 · Minimal
- Unhealthy air days now
- 1 days/yr
- Unhealthy air days in 30 yrs
- 2 days/yr
Risk factors via First Street. Map © Google.
Why this score? — see what drove the B- grade
The composite is a weighted blend of 9 inputs, each scored 0–100. Each bar is that input's sub-score; the figure is the points it added to the 100-point composite (weight × sub-score).
- Cash flow +21.4/30.0
- ARV discount +12.8/15.0
- Appreciation +10.0/10.0
- DSCR +6.8/10.0
- 1% rule +5.4/10.0
- Rent growth +4.5/5.0
- Livability +4.0/5.0
- Condition / age +2.5/5.0
- Schools +1.4/10.0
$119,999
🖨 Deal sheet 📄 Offer letter ✓ Due diligence
Listing remarks MLS
Home Near Downtown San Antonio Opportunity awaits with this single-family home located in the heart of Bexar County! Featuring 2 bedrooms and 1 bathroom, this property offers great potential for investors, renovators, or first-time buyers ready to make it their own. Nestled just minutes from San Antonio's vibrant downtown, you'll enjoy close proximity to the city's top attractions, restaurants, and cultural landmarks. With the right vision, this home can be transformed into a true gem. Don't miss your chance to invest in one of San Antonio's up-and-coming neighborhoods-schedule your showing today!
Key facts
- Top attractions
- Cultural landmarks
- Single-family home
Tags
Neighborhood map
What this means for you Summary
Snapshot
- This is a 2-bed/1.0-bath single-family listed at $120k.
Deal economics
- At list price, monthly cash flow is $178 ($2k/yr) — positive.
- The deal already cash-flows at list — no discount required.
- Meets the 1% rule at list price ($1k rent vs $120k).
- Recommended offer: $106k (12.0% below list) — sets the bar for market timing.
- Cap rate 8.1% vs local median 3.8% in San Antonio — top-decile yield for the area; either an underpriced asset or a hidden risk that comps aren't pricing in. Stress-test before assuming the spread holds.
Location & tenants
- Location reads 80/100 on livability (#31 in TX, #1,616 nationally) — a professional / high-income tenant draw. Strengths: amenities A+, commute A+, cost of living A+; Watch: schools C-, crime F.
- San Antonio ISD (urban): math 12% / reading 22% proficiency, ranked #805 of 826 in TX (top 98%) — low school quality limits family demand, transient renter base, plan for 1-2y turnover; 80% free/reduced lunch — lower-income household profile, screen leases tightly.
- Market conditions: Rents rising fast (+8.2%/yr); 196 active listings in the ZIP; 40 comparable units currently listed for rent nearby; rentals at typical pace (median 24d on market — plan ~3-4 weeks tenant-placement turnaround); 45% of comp listings sitting > 30 days — soft ceiling on asking rent; 8,308 units permitted in Bexar County in 2024 (2,506 in 5+ unit buildings).
- This rent runs 32% of the median local income ($47k/yr) — at the standard rent-burdened threshold; future hikes will face affordability resistance.
Forward outlook
- In year one you build about $13k of equity ($829 loan paydown + $12k appreciation (10.0% local appreciation)).
- Bexar County population projected at +50% by 2050 — long-run rental-demand tailwind backs the buy-and-hold thesis.
- At projected returns (10.0% appreciation + 8.0% rent growth), your $34k cash investment doubles in ~3 years — after that, you're playing with house money.
- By year 3, paydown + projected appreciation supports a ~$32k cash-out refi (75% LTV) — recoverable capital for the next deal without selling this one.
Negotiation context
- It's been on market 245 days — a 12% lower offer ($106k) is reasonable based on typical stale-listing flexibility.
Risks & watch-outs
- Watch-outs: built in 1929 — expect roof / HVAC / electrical / plumbing capex.
- Climate carrying-cost: severe wind risk, 80% chance of damaging wind over 30y; extreme-heat days projected 6→19/yr by 2055 (HVAC capex compounding) — expect insurance premiums to compound above CPI over the hold.
Questions for the listing agent
- It's been on market 245 days. Have you received any prior offers? Is the seller open to a 12% concession, seller financing, or rate buy-down credit?
- Built in 1929 — when were the roof, HVAC, electrical panel, plumbing, and water heater last replaced?
- Why hasn't it sold? Are there any deal-killer items the seller is aware of (foundation, flood, title, zoning, code violations)?
- Is there a deadline driving the sale (1031 exchange, divorce, estate, relocation)? That informs how much negotiation room exists.
- Crime grade is F in this area — have there been break-ins, vandalism, or insurance claims at this property in the last 3 years? What carrier currently insures it and at what premium?
- What's the average days-on-market for RENTAL listings here right now (not sales)? A rising rental-DOM trend means longer vacancies and softer asking-rent achievability than the comps imply.
- What's the recent tenant-quality profile in this submarket — average credit score on applications, eviction rate, late-payment / NSF rate, and stable-employment percentage? A property-management company in the area should have these aggregated.
- How much new for-sale + rental construction is in the pipeline within 1–3 miles? Heavy new supply typically softens prices + rents 12–24 months out; constrained supply supports both.
Investment metrics
- 1% rule
- 1.04% ✓
- Cap rate
- 8.08%
- Cash-on-cash
- 6.36%
- DSCR
- 1.28
- GRM
- 8.0
CMA / ARV
- ARV (median comp)
- $136,180
- List price
- $119,999
- Delta
- -11.88%
- Verdict
- UNDERPRICED
- Comps
- 20 within 1.0 mi
Show comp detail 12 sales within ~0.75 mi
| Address | Dist | Beds/Ba | Sqft | Sold | Price | $/sf | Match |
|---|---|---|---|---|---|---|---|
| 151 Canton | 0.23mi | 2/1.0 | 744 (-6%) | 2mo | $130,000 | $175 | 78 |
| 401 Canton | 0.43mi | 2/1.0 | 808 (+2%) | 8mo | $65,000 | $80 | 69 |
| 121 Boston | 0.42mi | 2/1.0 | 752 (-5%) | 7mo | $89,000 | $118 | 67 |
| 219 Dashiell St St | 0.62mi | 2/1.0 | 808 (+2%) | 2mo | $99,950 | $124 | 65 |
| 143 Paul | 0.46mi | 2/2.0 | 864 (+10%) | 1mo | $155,000 | $179 | 58 |
| 122 Belmont | 0.30mi | 3/1.0 (+1) | 902 (+14%) | 6mo | $95,000 | $105 | 52 |
| 1042 Paso Hondo | 0.34mi | 2/1.0 | 900 (+14%) | 11mo | $174,990 | $194 | 51 |
| 310 N Gevers | 0.51mi | 2/1.0 | 876 (+11%) | 10mo | $85,000 | $97 | 49 |
| 228 Spruce | 0.64mi | 2/1.0 | 708 (-10%) | 9mo | $149,000 | $210 | 46 |
| 325 Montana | 0.63mi | 2/2.0 | 840 (+7%) | 13mo | $310,000 | $369 | 44 |
| 431 Blue Bonnet | 0.75mi | 2/1.0 | 876 (+11%) | 10mo | $139,500 | $159 | 38 |
| 623 Blaine | 0.73mi | 3/1.0 (+1) | 869 (+10%) | 12mo | $130,000 | $150 | 34 |
Match score weights: distance 35% · size 25% · config 20% · recency 20%. Top-matched comps best support the ARV.
Projected returns pro-forma
10.0% appreciation · 8.0% rent growth · sell at horizon
- IRR
- 30.9%
- Equity multiple
- 3.48×
- Total profit
- $83,333
- Equity at exit
- $108,105
- IRR
- 28.4%
- Equity multiple
- 8.53×
- Total profit
- $252,895
- Equity at exit
- $233,132
Cash invested: $33,600 (down + closing). Projections, not guarantees.
Landlord ↔ Tenant lean methodology
- Overall (STATE)
- 87 Strongly Landlord-Friendly
- State Texas
- 87 Strongly Landlord-Friendly · R+5
- County
- — inherits STATE
- City
- — inherits STATE
ZIP-level market 78202
- Home prices YoY
- 27.0%
- Rents YoY
- 8.2%
- Active inventory
- 196
- Price-to-rent
- 8.0×
Monthly cashflow live
- Estimated rent
- $1,253 high interval (Pro) →
- Mortgage (P&I)
- −$629
- Tax from tax record
- −$132 /mo · $1,586/yr
- Insurance
- −$50
- HOA
- −$0
- Vacancy / Maint / Mgmt
- −$263
- Net cashflow
- $178
Break-even live
UW: 25.0% down · 7.5% · 30yr · 1.5% tax · 5.0% vac · 8.0% maint · 8.0% mgmt
Financing live
Cash to close
- Down payment
- $30,000
- Closing costs
- $3,600
- Reserves months
- —
- Total cash needed
- —
Loan-product check · same deal, 3 products live
Conventional
25% down · 7.5% · 30yr
- Down + closing
- —
- Monthly P&I
- —
- Monthly cashflow
- —
- DSCR
- —
- Eligible?
- —
Personal DTI + credit; lowest rate.
DSCR
20% down · 8.5% · 30yr
- Down + closing
- —
- Monthly P&I
- —
- Monthly cashflow
- —
- DSCR
- —
- Eligible?
- —
No personal income docs; deal must DSCR.
Hard money
10% down · 12.0% · 12mo
- Down + closing
- —
- Monthly P&I
- —
- Monthly cashflow
- —
- DSCR
- —
- Eligible?
- —
Short-term bridge; refi at stabilization.
Rent comps 40 comps
| Address | Beds | Baths | Sqft | Rent | $/sqft | DOM | Units | Dist |
|---|---|---|---|---|---|---|---|---|
| 2023 Beaver Ln San Antonio, TX | 1.0 | 1.0 | 600 | $960 | $1.60 | 43d | 1 | 0.16mi |
| 620 Potomac San Antonio, TX | 2.0 | 1.0 | 900 | $1,050 | $1.17 | 21d | 1 | 0.16mi |
| 622 Potomac St San Antonio, TX | 1.0 | 1.0 | 700 | $975 | $1.39 | 43d | 1 | 0.17mi |
| 210 Piedmont Ave Unit 101 San Antonio, TX | 2.0 | 2.5 | 1050 | $1,395 | $1.33 | 43d | 1 | 0.23mi |
| 721 Potomac San Antonio, TX | 1.0 | 1.0 | 914 | $1,100 | $1.20 | 23d | 1 | 0.24mi |
| 155 Canton San Antonio, TX | 2.0 | 2.0 | 1078 | $1,250 | $1.16 | 23d | 1 | 0.25mi |
| 313 Toledo San Antonio, TX | 2.0 | 1.0 | 924 | $1,400 | $1.52 | 10d | 1 | 0.31mi |
| 1617 E Commerce St San Antonio, TX | 1.0 | 1.0 | 844 | $814 | $0.96 | 43d | 1 | 0.34mi |
| 1101 Gibbs San Antonio, TX | 3.0 | 1.0 | 1100 | $1,345 | $1.22 | 14d | 1 | 0.37mi |
| 1101 Gibbs San Antonio, TX | 3.0 | 1.0 | 1100 | $1,345 | $1.22 | 23d | 1 | 0.37mi |
| 630 Montana St Unit 202 San Antonio, TX | 1.0 | 1.0 | 969 | $1,950 | $2.01 | 23d | 1 | 0.38mi |
| 630 Montana St Unit 201 San Antonio, TX | 1.0 | 1.5 | 1060 | $1,950 | $1.84 | 43d | 1 | 0.38mi |
| 103 Saint Charles Unit NA San Antonio, TX | 2.0 | 2.0 | 995 | $1,300 | $1.31 | 43d | 1 | 0.38mi |
| 1205 Wyoming St San Antonio, TX | 2.0 | 2.0 | 1114 | $2,300 | $2.06 | 43d | 1 | 0.39mi |
| 1218 Wyoming St Unit 1 San Antonio, TX | 1.0 | 1.0 | 744 | $1,299 | $1.75 | 43d | 1 | 0.40mi |
| 103 Saint John San Antonio, TX | 2.0 | 1.0 | 943 | $1,245 | $1.32 | 43d | 1 | 0.41mi |
| 203 Gorman San Antonio, TX | 1.0 | 1.0 | 578 | $745 | $1.29 | 43d | 1 | 0.47mi |
| 1615 Nolan St Unit A San Antonio, TX | 2.0 | 1.0 | 1066 | $1,400 | $1.31 | 10d | 1 | 0.52mi |
| 1615 Nolan St San Antonio, TX | 1.0 | 1.0 | 978 | $1,200 | $1.23 | 10d | 1 | 0.52mi |
| 1619 Nolan St Unit B San Antonio, TX | 2.0 | 1.0 | 600 | $1,050 | $1.75 | 23d | 1 | 0.52mi |
| 308 Belmont San Antonio, TX | 1.0 | 1.0 | 700 | $850 | $1.21 | 23d | 1 | 0.54mi |
| 438 Gulf St San Antonio, TX | 2.0 | 1.0 | 799 | $975 | $1.22 | 14d | 1 | 0.56mi |
| 325 S Hackberry St San Antonio, TX | 2.0 | 1.0 | 621 | $1,200 | $1.93 | 12d | 1 | 0.56mi |
| 118 Glorietta San Antonio, TX | 1.0 | 1.0 | 913 | $1,600 | $1.75 | 4d | 1 | 0.58mi |
| 109 Gravel St San Antonio, TX | 3.0 | 1.0 | 900 | $1,250 | $1.39 | 23d | 1 | 0.62mi |
| 325 Montana St San Antonio, TX | 2.0 | 2.0 | 840 | $2,475 | $2.95 | 43d | 1 | 0.63mi |
| 231 Cactus St San Antonio, TX | 2.0 | 1.0 | 876 | $1,195 | $1.36 | 23d | 1 | 0.70mi |
| 146 Eross San Antonio, TX | 2.0 | 1.0 | 696 | $900 | $1.29 | 16d | 1 | 0.73mi |
| 803 Piedmont Ave San Antonio, TX | 3.0 | 1.0 | 1000 | $1,350 | $1.35 | 43d | 1 | 0.73mi |
| 803 Piedmont Ave San Antonio, TX | 3.0 | 1.0 | 860 | $1,450 | $1.69 | 23d | 1 | 0.73mi |
| 732 Lamar St Unit 1 San Antonio, TX | 1.0 | 1.0 | 1100 | $1,550 | $1.41 | 43d | 1 | 0.74mi |
| 721 S Pine St San Antonio, TX | 2.0 | 1.0 | 1016 | $1,245 | $1.23 | 23d | 1 | 0.76mi |
| 639 Canton San Antonio, TX | 2.0 | 1.0 | 1008 | $1,295 | $1.28 | 43d | 1 | 0.76mi |
| 136 Nelson Ave San Antonio, TX | 3.0 | 1.0 | 1092 | $1,316 | $1.21 | 43d | 1 | 0.77mi |
| 707 S Olive St Unit A San Antonio, TX | 2.0 | 2.0 | 740 | $1,300 | $1.76 | 23d | 1 | 0.77mi |
| 1810 Burnet St San Antonio, TX | 2.0 | 1.0 | 620 | $1,045 | $1.69 | 14d | 1 | 0.77mi |
| 1323 Lamar St #1 San Antonio, TX | 2.0 | 1.0 | 900 | $999 | $1.11 | 43d | 1 | 0.79mi |
| 706 Canton San Antonio, TX | 2.0 | 1.0 | 994 | $1,545 | $1.55 | 23d | 1 | 0.81mi |
| 710 Virginia Blvd San Antonio, TX | 2.0 | 1.0 | 700 | $1,100 | $1.57 | 43d | 1 | 0.81mi |
| 1411 Lamar St San Antonio, TX | 2.0 | 1.0 | 700 | $1,125 | $1.61 | 43d | 1 | 0.81mi |
Listing history 14 events
-
2026-06-18days on market $119,999 Active 245 DOM
-
2026-06-17days on market $119,999 Active 244 DOM
-
2026-06-16days on market $119,999 Active 243 DOM
-
2026-06-15days on market $119,999 Active 242 DOM
-
2026-06-13days on market $119,999 Active 240 DOM
-
2026-06-09days on market $119,999 Active 236 DOM
-
2026-06-08days on market $119,999 Active 235 DOM
-
2026-06-07days on market $119,999 Active 234 DOM
-
2026-06-04days on market $119,999 Active 231 DOM
-
2026-06-03days on market $119,999 Active 230 DOM
-
2026-06-02days on market $119,999 Active 229 DOM
-
2026-06-01days on market $119,999 Active 228 DOM
-
2026-05-31days on market $119,999 Active 227 DOM
-
2025-10-16$119,999 New 613-char remark
Show marketing remark (613 chars)
Home Near Downtown San Antonio Opportunity awaits with this single-family home located in the heart of Bexar County! Featuring 2 bedrooms and 1 bathroom, this property offers great potential for investors, renovators, or first-time buyers ready to make it their own. Nestled just minutes from San Antonio's vibrant downtown, you'll enjoy close proximity to the city's top attractions, restaurants, and cultural landmarks. With the right vision, this home can be transformed into a true gem. Don't miss your chance to invest in one of San Antonio's up-and-coming neighborhoods-schedule your showing today!
ⓘ Source: listings_history table (triggers on properties + properties_extension) + one-shot
backfill from property_details.listing_events for pre-trigger history.
Tax reassessment forecast TX · Resets to sale price
- Current annual tax
- $1,586 · $132/mo
- Projected year-2 tax
- $2,196 · $183/mo
- Expected delta
- +$610/yr (+$51/mo · 38.4%)
ⓘ Screening estimate from a state-policy table — verify with the county assessor before closing.
Climate risk First Street
- Flood 1/10 Low FEMA zone X (unshaded) · 0% chance over 30 yrs
- Wildfire 1/10 Low
- Heat 8/10 Severe 6 d/yr ≥108°F today · 19 d/yr by 30 yrs out
- Wind 8/10 Severe 80% chance of damaging wind over 30 yrs
- Air quality 2/10 Low 1 unhealthy d/yr today · 2 by 30 yrs out
Nearby sold comps map
Loading sold comps map…
Walkable amenities ~0.75 mi
Loading nearby amenities…
Taxation est. · year 1
- Rental income
- $15,033
- − Mortgage interest
- −$6,722
- − Property taxes
- −$1,586
- − Insurance
- −$600
- − Repairs & maintenance
- −$1,203
- − Management
- −$1,203
- − Depreciation
- −$3,491
- Taxable income
- $229
- Est. tax owed @ 24.0%
- −$55
- After-tax cash flow
- $2,084/yr
For passive investors: Depreciation is non-cash, so a rental often shows a tax loss while cash-flowing — sheltering income. Rental losses are passive: they offset passive income freely, and up to $25,000/yr can offset ordinary (W-2) income if you actively participate and your MAGI is under $100k (phasing out to $0 by $150k); unused losses carry forward. On sale, claimed depreciation is recaptured at up to 25%, and gains may owe capital-gains tax (a 1031 exchange can defer both). Figures are a year-1 estimate at your 24.0% rate — not tax advice; consult a CPA.
Schools (NCES district)
- District
- San Antonio ISD
- NCES district ID
- 4838730
- Math proficiency
- 12% ▼ -21.00%
- Reading proficiency
- 22% ▼ -7.00%
- Median HH income
- $30,952
- Composite
- 13.57/100
- National rank
- #9512
- State rank
- #805 of 826 in TX
Livability — San Antonio
- Score
- 80/100
- State rank
- #31
- US rank
- #1616
Category grades
Schools grade is shown separately in the Schools card above.
Census & demographics
- Census place
- San Antonio, TX
- County
- Bexar County · 1,990,555 people
- City population
- 1,806,925
- Metro
- San Antonio-New Braunfels, TX
- Population (ZIP)
- 10,224
- Household income
- $47,478
- Rent vs Own
- Severe rent burden
- 543.0
Population outlook (Bexar County) Hauer SSP2
- Today (2025)
- 2,336,851 people
- By 2030
- 2,560,728 · +9.6%
- By 2040
- 3,020,569 · +29.3%
- By 2050
- 3,493,522 · +49.5%
- By 2075
- 4,668,459 · +99.8%
- By 2100
- 5,533,242 · +136.8%
Race, ethnicity, and origin ACS 2023
- Neighborhood character
- Predominantly Hispanic (66%)
- Race & ethnicity
- Hispanic / Latino 66% Two or more races 28% White 17% Black 16% Native American 1%
- Hispanic origin (detail)
- Mexican 57% Puerto Rican 1% Cuban 1%
- Common ancestry
- Italian 2% Slovak 1%
- Foreign-born
- 14% · Canada
- Languages at home
- 59% English-only · Spanish 41%
Political lean MEDSL · Bexar
- 2024 margin
- Lean D (+9.8) · D 54.3% · R 44.6% · Other 1.1%
- 2008→2024 swing
- +4.2pp toward D · 2008: 5.6pp · 2024: 9.8pp
- All cycles
- 2024: D+9.8 2020: D+18.2 2016: D+13.5 2012: D+4.6 2008: D+5.6
Not yet ingested
- Civics
- —
Market trends
- HPI YoY
- ▲ 53.82%
- Current HPI
- 253.3196
- Rent YoY
- ▲ 8.20%
- Metro
- San Antonio-New Braunfels, TX
- State GDP YoY
- ▲ 3.95%
- F500 in state
- 110
Industry mix (Fortune 500 HQ in TX)
| Industry | F500 HQs | Revenue |
|---|---|---|
| Energy | 16 | $1,198B |
|
||
| Technology | 5 | $198B |
|
||
| Engineering / Construction | 4 | $72B |
|
||
| Energy Services | 3 | $60B |
|
||
| Utilities | 3 | $41B |
|
||
| Healthcare | 2 | $330B |
|
||
Price history
1 event — show timeline
- 2025-10-16 Listed $119,999 LERA
Property tax history
+5.0%/yrLatest (2025): $1,586 · -60.2% YoY. Source: county tax records.
Cash-flow waterfall
monthlySold comps — $/sqft
last 12 mo · ≤1 miLoading sold comps…