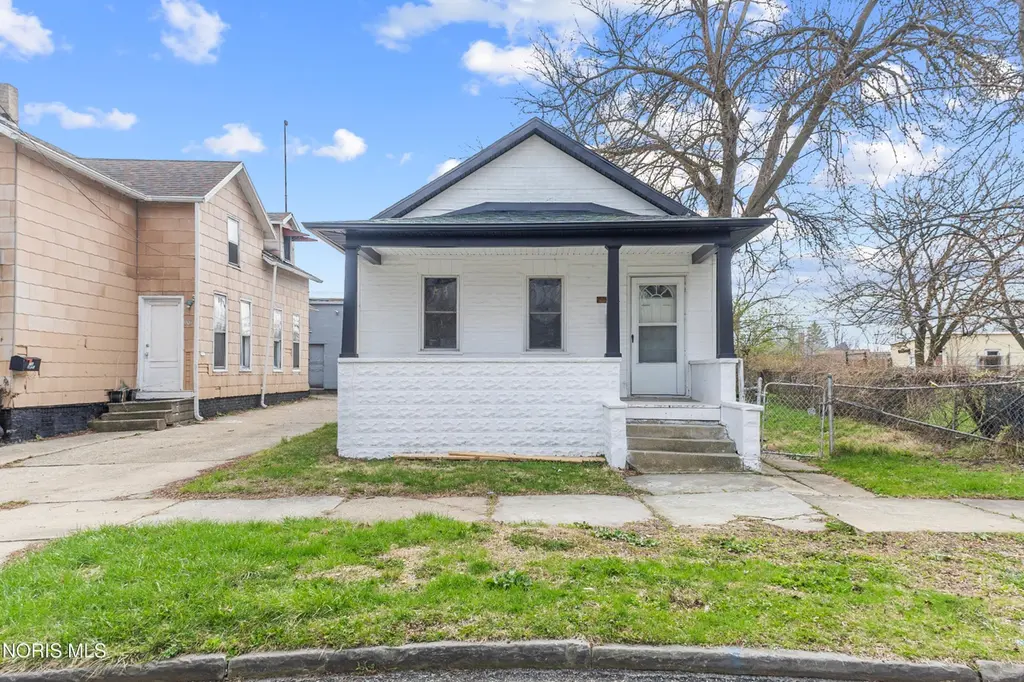
911 Vinton St · Toledo, OH
Flood risk 1/10 · Minimal
- FEMA flood zone
- X (unshaded)
- Chance of flooding over 30 yrs
- 0.0%
- Est. flood insurance / yr
- $507 – $1,088
Fire risk 1/10 · Minimal
- Est. fire insurance / yr
- $713 – $1,323
Heat risk 3/10 · Minor
- Hot days now (above 100°F)
- 7 days/yr
- Hot days in 30 yrs
- 16 days/yr
Wind risk 2/10 · Minimal
- Chance of severe wind over 30 yrs
- —
Air-quality risk 2/10 · Minimal
- Unhealthy air days now
- 1 days/yr
- Unhealthy air days in 30 yrs
- 2 days/yr
Risk factors via First Street. Map © Google.
Why this score? — see what drove the B grade
The composite is a weighted blend of 9 inputs, each scored 0–100. Each bar is that input's sub-score; the figure is the points it added to the 100-point composite (weight × sub-score).
- Cash flow +30.0/30.0
- DSCR +10.0/10.0
- 1% rule +9.0/10.0
- ARV discount +7.5/15.0
- Appreciation +5.4/10.0
- Rent growth +4.5/5.0
- Livability +3.3/5.0
- Condition / age +2.5/5.0
- Schools +1.6/10.0
$79,000
🖨 Deal sheet 📄 Offer letter ✓ Due diligence
Listing remarks MLS
Great investment opportunity featuring a 2-bedroom, 1-bath home with strong rental potential. The property offers functional living space and is ideal for investors looking to expand their portfolio. Can be purchased individually or bundled with 2313 Waterworks Drive and 1045 Orchard Street. for a package deal opportunity. No seller financing or creative financing options available.
Key facts
- 5,700 sq ft lot
- Parking
- Built 1887
Neighborhood map
What this means for you Summary
Snapshot
- This is a 2-bed/1.0-bath single-family listed at $79k.
Deal economics
- At list price, monthly cash flow is $374 ($4k/yr) — positive.
- The deal already cash-flows at list — no discount required.
- Meets the 1% rule at list price ($1k rent vs $79k).
- Recommended offer: $74k (6.0% below list) — sets the bar for market timing.
- Cap rate 12.0% vs local median 7.6% in Toledo — top-decile yield for the area; either an underpriced asset or a hidden risk that comps aren't pricing in. Stress-test before assuming the spread holds.
Location & tenants
- Location reads 66/100 on livability (#645 in OH) — a middle-class / working-renter tenant base. Strengths: cost of living A+, housing A+, health & safety A+; Watch: amenities C-, schools D-, crime F.
- Toledo City (urban): math 15% / reading 24% proficiency, ranked #634 of 656 in OH (top 97%) — low school quality limits family demand, transient renter base, plan for 1-2y turnover; 72% free/reduced lunch — lower-income household profile, screen leases tightly.
- Market conditions: Rents rising fast (+7.8%/yr); 99 active listings in the ZIP; 31 comparable units currently listed for rent nearby; rentals lingering (median 44d on market — plan ~5-8 weeks vacancy on turnover, expect pricing pressure); 52% of comp listings sitting > 30 days — soft ceiling on asking rent; lower-income renter base — watch delinquency; 415 units permitted in Lucas County in 2024 (122 in 5+ unit buildings).
- This rent runs 31% of the median local income ($42k/yr) — at the standard rent-burdened threshold; future hikes will face affordability resistance.
Forward outlook
- In year one you build about $1k of equity ($546 loan paydown + $592 appreciation (0.8% local appreciation)).
- Lucas County population projected at -16% by 2050 — secular population decline; favor cash flow + early exit over multi-decade hold.
- At projected returns (0.8% appreciation + 7.8% rent growth), your $22k cash investment doubles in ~4 years — after that, you're playing with house money.
Negotiation context
- It's been on market 66 days — a 6% lower offer ($74k) is reasonable based on typical stale-listing flexibility.
- 2 sale attempts since 2y ago with the ask held roughly flat each time — persistent listings suggest the price (not the market) is what's stuck; bring a comps-based counter.
- Current owner paid $38k; list at $79k implies a 108% gain — meaningful room to come down on a strong offer.
Risks & watch-outs
- Watch-outs: built in 1887 — expect roof / HVAC / electrical / plumbing capex.
Questions for the listing agent
- It's been on market 66 days. Have you received any prior offers? Is the seller open to a 6% concession, seller financing, or rate buy-down credit?
- Built in 1887 — when were the roof, HVAC, electrical panel, plumbing, and water heater last replaced?
- Why hasn't it sold? Are there any deal-killer items the seller is aware of (foundation, flood, title, zoning, code violations)?
- Is there a deadline driving the sale (1031 exchange, divorce, estate, relocation)? That informs how much negotiation room exists.
- Schools are D-rated, which usually means shorter tenancies and higher turnover. Who's the typical renter profile here, and what's been the actual vacancy rate?
- Crime grade is F in this area — have there been break-ins, vandalism, or insurance claims at this property in the last 3 years? What carrier currently insures it and at what premium?
- What's the average days-on-market for RENTAL listings here right now (not sales)? A rising rental-DOM trend means longer vacancies and softer asking-rent achievability than the comps imply.
- What's the recent tenant-quality profile in this submarket — average credit score on applications, eviction rate, late-payment / NSF rate, and stable-employment percentage? A property-management company in the area should have these aggregated.
- How much new for-sale + rental construction is in the pipeline within 1–3 miles? Heavy new supply typically softens prices + rents 12–24 months out; constrained supply supports both.
Investment metrics
- 1% rule
- 1.40% ✓
- Cap rate
- 11.98%
- Cash-on-cash
- 20.30%
- DSCR
- 1.90
- GRM
- 5.9
CMA / ARV
- ARV (median comp)
- $49,633
- List price
- $79,000
- Delta
- 59.17%
- Verdict
- OVERPRICED
- Comps
- 20 within 1.0 mi
Show comp detail 12 sales within ~0.75 mi
| Address | Dist | Beds/Ba | Sqft | Sold | Price | $/sf | Match |
|---|---|---|---|---|---|---|---|
| 356 Sumner St | 0.60mi | 2/1.0 | 910 (-1%) | 8mo | $24,900 | $27 | 65 |
| 58 City Park | 0.21mi | 3/1.0 (+1) | 1,008 (+10%) | 7mo | $45,000 | $45 | 63 |
| 517 Knower St | 0.52mi | 3/1.0 (+1) | 966 (+6%) | 1mo | $65,000 | $67 | 61 |
| 267 Leland Ave | 0.53mi | 2/1.0 | 969 (+6%) | 9mo | $87,000 | $90 | 58 |
| 710 Western Ave | 0.33mi | 2/1.0 | 1,028 (+12%) | 8mo | $72,500 | $71 | 57 |
| 109 Wellington St | 0.71mi | 2/1.0 | 859 (-6%) | 3mo | $4,500 | $5 | 54 |
| 442 Knower St | 0.51mi | 2/1.0 | 950 (+4%) | 20mo | $65,500 | $69 | 53 |
| 315 Sumner St | 0.57mi | 2/1.0 | 860 (-6%) | 15mo | $27,000 | $31 | 51 |
| 616 Pleasant Pl | 0.74mi | 3/1.5 (+1) | 941 (+3%) | 6mo | $45,000 | $48 | 49 |
| 570 Orchard St | 0.75mi | 2/1.5 | 836 (-9%) | 7mo | $40,000 | $48 | 43 |
| 638 Knower St | 0.49mi | 3/1.0 (+1) | 1,035 (+13%) | 16mo | $12,100 | $12 | 38 |
| 1041 Whittier St | 0.73mi | 3/1.0 (+1) | 968 (+6%) | 21mo | $55,000 | $57 | 34 |
Match score weights: distance 35% · size 25% · config 20% · recency 20%. Top-matched comps best support the ARV.
Projected returns pro-forma
0.75% appreciation · 7.8% rent growth · sell at horizon
- IRR
- 25.7%
- Equity multiple
- 2.35×
- Total profit
- $29,947
- Equity at exit
- $25,944
- IRR
- 31.4%
- Equity multiple
- 5.33×
- Total profit
- $95,827
- Equity at exit
- $33,698
Cash invested: $22,120 (down + closing). Projections, not guarantees.
Landlord ↔ Tenant lean methodology
- Overall (STATE)
- 73 Landlord-Friendly
- State Ohio
- 73 Landlord-Friendly · R+6
- County
- — inherits STATE
- City
- — inherits STATE
ZIP-level market 43609
- Home prices YoY
- 0.3%
- Rents YoY
- 7.8%
- Active inventory
- 99
- Price-to-rent
- 5.9×
Monthly cashflow live
- Estimated rent
- $1,109 high interval (Pro) →
- Mortgage (P&I)
- −$414
- Tax from tax record
- −$55 /mo · $656/yr
- Insurance
- −$33
- HOA
- −$0
- Vacancy / Maint / Mgmt
- −$233
- Net cashflow
- $374
Break-even live
UW: 25.0% down · 7.5% · 30yr · 1.5% tax · 5.0% vac · 8.0% maint · 8.0% mgmt
Financing live
Cash to close
- Down payment
- $19,750
- Closing costs
- $2,370
- Reserves months
- —
- Total cash needed
- —
Loan-product check · same deal, 3 products live
Conventional
25% down · 7.5% · 30yr
- Down + closing
- —
- Monthly P&I
- —
- Monthly cashflow
- —
- DSCR
- —
- Eligible?
- —
Personal DTI + credit; lowest rate.
DSCR
20% down · 8.5% · 30yr
- Down + closing
- —
- Monthly P&I
- —
- Monthly cashflow
- —
- DSCR
- —
- Eligible?
- —
No personal income docs; deal must DSCR.
Hard money
10% down · 12.0% · 12mo
- Down + closing
- —
- Monthly P&I
- —
- Monthly cashflow
- —
- DSCR
- —
- Eligible?
- —
Short-term bridge; refi at stabilization.
Rent comps 31 comps
| Address | Beds | Baths | Sqft | Rent | $/sqft | DOM | Units | Dist |
|---|---|---|---|---|---|---|---|---|
| 223 Charles St Toledo, OH | 2.0 | 1.0 | 612 | $875 | $1.43 | 43d | 1 | 0.40mi |
| 416 Maumee Ave Unit D Toledo, OH | 1.0 | 1.0 | 622 | $475 | $0.76 | 43d | 1 | 0.51mi |
| 400 Nebraska Ave Toledo, OH | 1.0 | 1.0 | 664 | $1,129 | $1.70 | 13d | 1 | 0.57mi |
| 244 Knower St Toledo, OH | 3.0 | 1.0 | 1120 | $995 | $0.89 | 13d | 1 | 0.61mi |
| 827 Colburn St Toledo, OH | 2.0 | 1.0 | 1092 | $750 | $0.69 | 43d | 1 | 0.73mi |
| 34 S Erie St Unit 409 Toledo, OH | 1.0 | 1.0 | 930 | $1,375 | $1.48 | 43d | 1 | 0.83mi |
| 34 S Erie St Apt 602 Toledo, OH | 1.0 | 1.0 | 894 | $1,315 | $1.47 | 43d | 1 | 0.83mi |
| 34 S Erie St Unit 107 Toledo, OH | 1.0 | 1.0 | 1103 | $1,300 | $1.18 | 23d | 1 | 0.83mi |
| 34 S Erie St Unit 202 Toledo, OH | 1.0 | 1.0 | 894 | $1,275 | $1.43 | 23d | 1 | 0.83mi |
| 34 S Erie St Unit 611 Toledo, OH | 1.0 | 1.0 | 990 | $1,300 | $1.31 | 43d | 1 | 0.83mi |
| 34 S Erie St Unit 209 Toledo, OH | 1.0 | 1.0 | 930 | $1,375 | $1.48 | 23d | 1 | 0.83mi |
| 771 Orchard St Unit 7715 Toledo, OH | 2.0 | 1.0 | 1086 | $645 | $0.59 | 23d | 1 | 0.84mi |
| 15 S Ontario St Apt 409 Toledo, OH | 1.0 | 1.0 | 984 | $1,695 | $1.72 | 43d | 1 | 0.86mi |
| 1 S Erie St Toledo, OH | 1.0 | 1.0 | 846 | $1,410 | $1.67 | 13d | 1 | 0.90mi |
| 23 N Summit St Toledo, OH | 1.0 | 1.0 | 838 | $1,475 | $1.76 | 13d | 2 | 1.04mi |
| 1037 Orchard St Toledo, OH | 2.0 | 1.0 | 696 | $820 | $1.18 | 21d | 1 | 1.05mi |
| 1321 Gordon St Toledo, OH | 3.0 | 1.0 | 1121 | $1,050 | $0.94 | 43d | 1 | 1.11mi |
| 123 Water St Unit 307 Toledo, OH | 1.0 | 1.0 | 914 | $1,445 | $1.58 | 43d | 1 | 1.14mi |
| 123 Water St Unit 411 Toledo, OH | 1.0 | 1.0 | 747 | $1,380 | $1.85 | 23d | 1 | 1.14mi |
| 200 N St Clair St Toledo, OH | 2.0 | 1.0–2.0 | 835 | $2,550 | $3.05 | 13d | 15 | 1.20mi |
| 322 14th St Apt 203 Toledo, OH | 3.0 | 1.5 | 1065 | $1,000 | $0.94 | 13d | 1 | 1.29mi |
| 332 14th St Unit 303 Toledo, OH | 3.0 | 1.5 | 1040 | $1,000 | $0.96 | 43d | 1 | 1.29mi |
| 1418 Colburn St Toledo, OH | 3.0 | 1.0 | 992 | $1,200 | $1.21 | 13d | 1 | 1.31mi |
| 142 23rd St Toledo, OH | 1.0 | 1.0–1.5 | 508 | $1,395 | $2.75 | 43d | 1 | 1.32mi |
| 513 Adams St Toledo, OH | 1.0–2.0 | 1.0 | 1175 | $1,424 | $1.21 | 13d | 11 | 1.32mi |
| 1825 Collingwood Blvd Toledo, OH | 1.0 | 1.0 | 710 | $850 | $1.20 | 13d | 1 | 1.33mi |
| 1521 Emma St Unit LABS 1521 Emma St, B 43051619729 Toledo, OH | 1.0 | 1.0 | 975 | $900 | $0.92 | 43d | 1 | 1.36mi |
| 1026 Oakwood Ave Toledo, OH | 2.0 | 1.0 | 1100 | $850 | $0.77 | 43d | 1 | 1.43mi |
| 834 Oak St Toledo, OH | 3.0 | 1.0 | 1064 | $900 | $0.85 | 43d | 1 | 1.45mi |
| 950 Oak St Unit 1 Toledo, OH | 2.0 | 1.0 | 725 | $700 | $0.97 | 43d | 1 | 1.50mi |
| 537 Potter St Toledo, OH | 1.0 | 1.0 | 1000 | $600 | $0.60 | 43d | 1 | 1.50mi |
Listing history 24 events
-
2026-06-18days on market $79,000 Active 66 DOM
-
2026-06-17days on market $79,000 Active 65 DOM
-
2026-06-16days on market $79,000 Active 64 DOM
-
2026-06-15days on market $79,000 Active 63 DOM
-
2026-06-14days on market $79,000 Active 61 DOM
-
2026-06-10days on market $79,000 Active 58 DOM
-
2026-06-09days on market $79,000 Active 57 DOM
-
2026-06-08days on market $79,000 Active 56 DOM
-
2026-06-07days on market $79,000 Active 55 DOM
-
2026-06-05days on market $79,000 Active 52 DOM
-
2026-06-03days on market $79,000 Active 51 DOM
-
2026-06-02days on market $79,000 Active 50 DOM
-
2026-06-01days on market $79,000 Active 49 DOM
-
2026-05-31days on market $79,000 Active 48 DOM
-
2026-05-30days on market $79,000 Active 47 DOM
-
2026-04-13$79,000 Active 385-char remark
Show marketing remark (385 chars)
Great investment opportunity featuring a 2-bedroom, 1-bath home with strong rental potential. The property offers functional living space and is ideal for investors looking to expand their portfolio. Can be purchased individually or bundled with 2313 Waterworks Drive and 1045 Orchard Street. for a package deal opportunity. No seller financing or creative financing options available.
-
2026-04-13historical $79,000 385-char remark
Show marketing remark (385 chars)
Great investment opportunity featuring a 2-bedroom, 1-bath home with strong rental potential. The property offers functional living space and is ideal for investors looking to expand their portfolio. Can be purchased individually or bundled with 2313 Waterworks Drive and 1045 Orchard Street. for a package deal opportunity. No seller financing or creative financing options available.
-
2025-10-14price $38,000 293-char remark
Show marketing remark (293 chars)
Don't miss out on this incredible chance to own a well-maintained property in the historic south end. This 2 bedroom 1 bath home has a solid rental history and low maintenance costs, this property is a fantastic opportunity for both seasoned and new investors alike. More pictures coming soon.
-
2024-11-06soldstatus $38,000
-
2024-10-30soldstatus $38,000 Closed 293-char remark
Show marketing remark (293 chars)
Don't miss out on this incredible chance to own a well-maintained property in the historic south end. This 2 bedroom 1 bath home has a solid rental history and low maintenance costs, this property is a fantastic opportunity for both seasoned and new investors alike. More pictures coming soon.
-
2024-10-15status Pending 293-char remark
Show marketing remark (293 chars)
Don't miss out on this incredible chance to own a well-maintained property in the historic south end. This 2 bedroom 1 bath home has a solid rental history and low maintenance costs, this property is a fantastic opportunity for both seasoned and new investors alike. More pictures coming soon.
-
2024-10-03historical Contingent 293-char remark
Show marketing remark (293 chars)
Don't miss out on this incredible chance to own a well-maintained property in the historic south end. This 2 bedroom 1 bath home has a solid rental history and low maintenance costs, this property is a fantastic opportunity for both seasoned and new investors alike. More pictures coming soon.
-
2024-10-01$45,000 Active 293-char remark
Show marketing remark (293 chars)
Don't miss out on this incredible chance to own a well-maintained property in the historic south end. This 2 bedroom 1 bath home has a solid rental history and low maintenance costs, this property is a fantastic opportunity for both seasoned and new investors alike. More pictures coming soon.
-
2004-05-17soldstatus $16,000
ⓘ Source: listings_history table (triggers on properties + properties_extension) + one-shot
backfill from property_details.listing_events for pre-trigger history.
Tax reassessment forecast OH · Partial reset (capped growth)
- Current annual tax
- $656 · $55/mo
- Projected year-2 tax
- $944 · $79/mo
- Expected delta
- +$288/yr (+$24/mo · 44.0%)
ⓘ Screening estimate from a state-policy table — verify with the county assessor before closing.
Climate risk First Street
- Flood 1/10 Low FEMA zone X (unshaded) · 0% chance over 30 yrs
- Wildfire 1/10 Low
- Heat 3/10 Moderate 7 d/yr ≥100°F today · 16 d/yr by 30 yrs out
- Wind 2/10 Low
- Air quality 2/10 Low 1 unhealthy d/yr today · 2 by 30 yrs out
Nearby sold comps map
Loading sold comps map…
Walkable amenities ~0.75 mi
Loading nearby amenities…
Taxation est. · year 1
- Rental income
- $13,306
- − Mortgage interest
- −$4,425
- − Property taxes
- −$656
- − Insurance
- −$395
- − Repairs & maintenance
- −$1,064
- − Management
- −$1,064
- − Depreciation
- −$2,298
- Taxable income
- $3,403
- Est. tax owed @ 24.0%
- −$817
- After-tax cash flow
- $3,673/yr
For passive investors: Depreciation is non-cash, so a rental often shows a tax loss while cash-flowing — sheltering income. Rental losses are passive: they offset passive income freely, and up to $25,000/yr can offset ordinary (W-2) income if you actively participate and your MAGI is under $100k (phasing out to $0 by $150k); unused losses carry forward. On sale, claimed depreciation is recaptured at up to 25%, and gains may owe capital-gains tax (a 1031 exchange can defer both). Figures are a year-1 estimate at your 24.0% rate — not tax advice; consult a CPA.
Schools (NCES district)
- District
- Toledo City
- NCES district ID
- 3904490
- Math proficiency
- 15% ▼ -16.00%
- Reading proficiency
- 24% ▼ -13.00%
- Median HH income
- $32,137
- Composite
- 15.76/100
- National rank
- #9276
- State rank
- #634 of 656 in OH
Livability — Toledo
- Score
- 66/100
- State rank
- #645
- US rank
- #11442
Category grades
Schools grade is shown separately in the Schools card above.
Census & demographics
- Census place
- Toledo, OH
- County
- Lucas County · 380,724 people
- City population
- 280,811
- Metro
- Toledo, OH
- Population (ZIP)
- 21,404
- Household income
- $42,313
- Rent vs Own
- Severe rent burden
- 1603.0
Population outlook (Lucas County) Hauer SSP2
- Today (2025)
- 420,751 people
- By 2030
- 410,187 · -2.5%
- By 2040
- 384,019 · -8.7%
- By 2050
- 355,125 · -15.6%
- By 2075
- 291,683 · -30.7%
- By 2100
- 233,670 · -44.5%
Race, ethnicity, and origin ACS 2023
- Neighborhood character
- Diverse neighborhood (Simpson 0.66)
- Race & ethnicity
- White 47% Black 29% Hispanic / Latino 17% Two or more races 9%
- Hispanic origin (detail)
- Mexican 15%
- Common ancestry
- Romanian 5% Lithuanian 2% Italian 1%
- Foreign-born
- 4% · Canada, China
- Languages at home
- 92% English-only · Spanish 5% Arabic 1% French/Haitian/Cajun 1%
Political lean MEDSL · Lucas
- 2024 margin
- D (+12.6) · D 55.8% · R 43.2%
- 2008→2024 swing
- -18.9pp toward R · 2008: 31.4pp · 2024: 12.6pp
- All cycles
- 2024: D+12.6 2020: D+16.8 2016: D+17.4 2012: D+30.4 2008: D+31.4
Not yet ingested
- Civics
- —
Market trends
- HPI YoY
- ▲ 0.75%
- Current HPI
- 235.2515
- Rent YoY
- ▲ 7.80%
- Metro
- Toledo, OH
- State GDP YoY
- ▲ 1.98%
- F500 in state
- 48
Industry mix (Fortune 500 HQ in OH)
| Industry | F500 HQs | Revenue |
|---|---|---|
| Insurance | 3 | $145B |
|
||
| Industrial Machinery | 3 | $49B |
|
||
| Financial Services | 3 | $24B |
|
||
| Consumer Goods | 2 | $93B |
|
||
| Aerospace / Defense | 2 | $47B |
|
||
| Utilities | 2 | $33B |
|
||
Price history
+393.8% since first listed9 events — show timeline
- 2026-04-13 Listed $79,000 NORIS
- 2026-04-13 Coming Soon $79,000 NORIS
- 2025-10-14 Price Changed $38,000 NORIS
- 2024-11-06 Sold (Public Records) $38,000 Public Records
- 2024-10-30 Sold (MLS) $38,000 NORIS
- 2024-10-15 Pending — NORIS
- 2024-10-03 Contingent — NORIS
- 2024-10-01 Listed $45,000 NORIS
- 2004-05-17 Sold (Public Records) $16,000 Public Records
Property tax history
+2.9%/yrLatest (2025): $656 · +32.9% YoY. Source: county tax records.
Cash-flow waterfall
monthlySold comps — $/sqft
last 12 mo · ≤1 miLoading sold comps…