 5-Plex
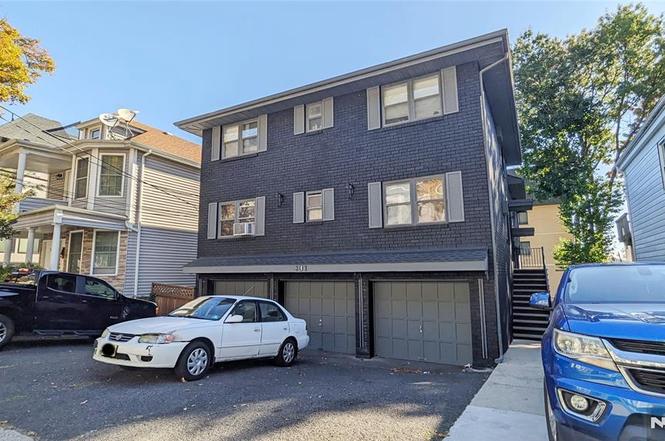
401 Undercliff Ave · Edgewater, NJ
Flood risk 1/10 · Minimal
- FEMA flood zone
- X (unshaded)
- Chance of flooding over 30 yrs
- 0.0%
- Est. flood insurance / yr
- $507 – $1,088
Fire risk 1/10 · Minimal
- Est. fire insurance / yr
- $526 – $976
Heat risk 7/10 · Major
- Hot days now (above 99°F)
- 7 days/yr
- Hot days in 30 yrs
- 15 days/yr
Wind risk 6/10 · Moderate
- Chance of severe wind over 30 yrs
- 27.0%
Air-quality risk 4/10 · Minor
- Unhealthy air days now
- 5 days/yr
- Unhealthy air days in 30 yrs
- 6 days/yr
Risk factors via First Street. Map © Google.
Why this score? — see what drove the C- grade
The composite is a weighted blend of 9 inputs, each scored 0–100. Each bar is that input's sub-score; the figure is the points it added to the 100-point composite (weight × sub-score).
- Cash flow +14.5/30.0
- Appreciation +8.6/10.0
- ARV discount +7.5/15.0
- Schools +5.3/10.0
- DSCR +4.4/10.0
- Livability +4.0/5.0
- 1% rule +3.6/10.0
- Rent growth +3.5/5.0
- Condition / age +2.5/5.0
$2,099,000
🖨 Deal sheet 📄 Offer letter ✓ Due diligence
Multi-family units
County records classify this as Multi-Family (5+ Unit). Listing-text estimate: 5 units. confirmed
5+ unit building — per-unit beds/baths from public records are typically unavailable; the breakdown below (if shown) is an estimate from the listing text.
Listing remarks MLS
Five family, excellent condition, eat in kitchens, new appliances and flooring. .. laundry room. .. Great location on Undercliff Avenue. .. includes 5 off street parking spaces. .. plus 4 garages. .. back yard. .. minutes to ferry Bridge and all transportation.
Key facts
- Updated exterior
- Eat in kitchen
- Heart of edgewater
Tags
Neighborhood map
What this means for you Summary
Snapshot
- This is a 5 × 2-bed/?-bath units multifamily listed at $2.10M.
Deal economics
- At list price, monthly cash flow is $458 ($6k/yr) — positive. Per door: $92/mo.
- The deal already cash-flows at list — no discount required.
- To meet the 1% rule (rent ≥ 1% of price), the offer needs to be $1.80M (14.3% below list).
- Recommended offer: $1.80M (14.3% below list) — sets the bar for 1% rule.
- Cap rate 6.6% vs local median 1.6% in Edgewater — top-decile yield for the area; either an underpriced asset or a hidden risk that comps aren't pricing in. Stress-test before assuming the spread holds.
Location & tenants
- Location reads 80/100 on livability (#74 in NJ, #1,774 nationally) — a professional / high-income tenant draw. Strengths: crime A+, amenities A+, employment A+; Watch: cost of living F.
- Edgewater School District (suburban): math 51% / reading 58% proficiency, ranked #276 of 612 in NJ (top 45%) — acceptable for families but not a draw, mixed tenant base, ~2y average lease; only 13% free/reduced lunch — higher-income household profile.
- Market conditions: Rents rising fast (+4.0%/yr); 90 active listings in the ZIP; 40 comparable units currently listed for rent nearby; rentals at typical pace (median 25d on market — plan ~3-4 weeks tenant-placement turnaround); high-income renter base; 3,488 units permitted in Bergen County in 2024 (1,610 in 5+ unit buildings).
- At $17,996/mo this rent would consume 174% of the median local household income ($124k/yr) (locally 1039% of renters already pay >50% of income on rent) — very limited rent-growth headroom before tenants either downsize or default.
Forward outlook
- In year one you build about $164k of equity ($15k loan paydown + $150k appreciation (7.1% local appreciation)).
- Bergen County population projected at +20% by 2050 — long-run rental-demand tailwind backs the buy-and-hold thesis.
- At projected returns (7.1% appreciation + 4.0% rent growth), your $588k cash investment doubles in ~4 years — after that, you're playing with house money.
- By year 2, paydown + projected appreciation supports a ~$262k cash-out refi (75% LTV) — recoverable capital for the next deal without selling this one.
Negotiation context
- It's been on market 135 days — a 12% lower offer ($1.85M) is reasonable based on typical stale-listing flexibility.
- 3 sale attempts since 2y ago with the ask held roughly flat each time — persistent listings suggest the price (not the market) is what's stuck; bring a comps-based counter.
Risks & watch-outs
- Climate carrying-cost: major wind risk, 27% chance of damaging wind over 30y; extreme-heat days projected 7→15/yr by 2055 (HVAC capex compounding) — expect insurance premiums to compound above CPI over the hold.
Questions for the listing agent
- It's been on market 135 days. Have you received any prior offers? Is the seller open to a 14% concession, seller financing, or rate buy-down credit?
- Can we see the unit-by-unit rent roll, current vacancy, and any below-market leases? What's the average tenancy length?
- What capital expenditures (roof, boiler, parking lot, exteriors) have been made in the last 5 years, and what's planned in the next 2?
- Why hasn't it sold? Are there any deal-killer items the seller is aware of (foundation, flood, title, zoning, code violations)?
- Is there a deadline driving the sale (1031 exchange, divorce, estate, relocation)? That informs how much negotiation room exists.
- Schools are A-rated — typically a magnet for longer-tenancy family renters. What's the average tenant stay here, and is there a school-zone premium baked into asking?
- What's the average days-on-market for RENTAL listings here right now (not sales)? A rising rental-DOM trend means longer vacancies and softer asking-rent achievability than the comps imply.
- What's the recent tenant-quality profile in this submarket — average credit score on applications, eviction rate, late-payment / NSF rate, and stable-employment percentage? A property-management company in the area should have these aggregated.
- How much new apartment / multifamily construction is in the pipeline within 1–3 miles? Heavy new supply (>2% of stock underway) typically softens rents 12–24 months out; light construction supports rent growth.
Investment metrics
- 1% rule
- 0.86% ✗
- Cap rate
- 6.56%
- Cash-on-cash
- 0.94%
- DSCR
- 1.04
- GRM
- 9.7
CMA / ARV
No comps found within radius.
Show comp detail 12 sales within ~0.75 mi
| Address | Dist | Beds/Ba | Sqft | Sold | Price | $/sf | Match |
|---|---|---|---|---|---|---|---|
| 403 Undercliff Ave | 0.01mi | 5/3.0 | — | 6mo | $999,000 | — | 82 |
| 46 GARDEN Pl | 0.21mi | 6/3.0 | — | 4mo | $1,200,000 | — | 75 |
| 65 Knox Ave | 0.26mi | 4/4.0 | — | 2mo | $1,395,000 | — | 74 |
| 251 Grant Ave | 0.42mi | 4/2.0 | — | 1mo | $685,000 | — | 67 |
| 32 Hudson Ter | 0.34mi | 6/3.0 | — | 8mo | $1,380,000 | — | 65 |
| 266 Wayne Ave | 0.47mi | 3/3.5 | — | 7mo | $1,150,000 | — | 60 |
| 16 Oakdene Ave | 0.54mi | 4/3.5 | — | 9mo | $930,000 | — | 55 |
| 768 Florence Pl | 0.67mi | 5/3.0 | — | 6mo | $989,000 | — | 51 |
| 582A Undercliff Ave | 0.62mi | 5/5.5 | — | 10mo | $3,100,000 | — | 50 |
| 582B Undercliff Ave | 0.62mi | 4/5.5 | — | 11mo | $2,850,000 | — | 50 |
| 376-378 Columbia Ave | 0.66mi | 8/4.0 | — | 9mo | $1,111,000 | — | 49 |
| 400 Nelson Ave | 0.72mi | 3/3.0 | — | 9mo | $950,000 | — | 47 |
Match score weights: distance 35% · size 25% · config 20% · recency 20%. Top-matched comps best support the ARV.
Projected returns pro-forma
7.12% appreciation · 4.02% rent growth · sell at horizon
- IRR
- 19.1%
- Equity multiple
- 2.36×
- Total profit
- $796,507
- Equity at exit
- $1,471,442
- IRR
- 18.5%
- Equity multiple
- 4.97×
- Total profit
- $2,331,614
- Equity at exit
- $2,810,509
Cash invested: $587,720 (down + closing). Projections, not guarantees.
Landlord ↔ Tenant lean methodology
- Overall (STATE)
- 21 Tenant-Leaning
- State New Jersey
- 21 Tenant-Leaning · D+6
- County
- — inherits STATE
- City
- — inherits STATE
ZIP-level market 07020
- Home prices YoY
- 2.5%
- Rents YoY
- 4.0%
- Active inventory
- 90
- Price-to-rent
- 48.6×
Monthly cashflow live
- Estimated rent
- $17,996 high interval (Pro) →
- Mortgage (P&I)
- −$11,007
- Tax from tax record
- −$1,876 /mo · $22,517/yr
- Insurance
- −$875
- HOA
- −$0
- Vacancy / Maint / Mgmt
- −$3,779
- Net cashflow
- $458
Break-even live
5-unit breakdown (identical units grouped — click to expand)
| Units | Beds | Baths | Est. rent |
|---|---|---|---|
| 5× units | 2 | — | $17,995 |
| #1 | 2 | — | $3,599 |
| #2 | 2 | — | $3,599 |
| #3 | 2 | — | $3,599 |
| #4 | 2 | — | $3,599 |
| #5 | 2 | — | $3,599 |
| Total (5 units) | $17,996 | ||
UW: 25.0% down · 7.5% · 30yr · 1.5% tax · 5.0% vac · 8.0% maint · 8.0% mgmt
Financing live
Cash to close
- Down payment
- $524,750
- Closing costs
- $62,970
- Reserves months
- —
- Total cash needed
- —
Loan-product check · same deal, 3 products live
Conventional
25% down · 7.5% · 30yr
- Down + closing
- —
- Monthly P&I
- —
- Monthly cashflow
- —
- DSCR
- —
- Eligible?
- —
Personal DTI + credit; lowest rate.
DSCR
20% down · 8.5% · 30yr
- Down + closing
- —
- Monthly P&I
- —
- Monthly cashflow
- —
- DSCR
- —
- Eligible?
- —
No personal income docs; deal must DSCR.
Hard money
10% down · 12.0% · 12mo
- Down + closing
- —
- Monthly P&I
- —
- Monthly cashflow
- —
- DSCR
- —
- Eligible?
- —
Short-term bridge; refi at stabilization.
Rent comps 40 comps
| Address | Beds | Baths | Sqft | Rent | $/sqft | DOM | Units | Dist |
|---|---|---|---|---|---|---|---|---|
| 2 Columbia Ter Edgewater, NJ | 1.0 | 1.0 | 500 | $1,650 | $3.30 | 15d | 1 | 0.08mi |
| 10 Hilliard Ave Unit 5 Edgewater, NJ | 2.0 | 1.0 | — | $2,200 | — | 24d | 1 | 0.10mi |
| 10 Hilliard Ave Unit 4 Edgewater, NJ | 3.0 | 1.0 | — | $2,550 | — | 24d | 1 | 0.10mi |
| 100 Carlyle Dr Unit 16ES Cliffside Park, NJ | 2.0 | 2.5 | — | $4,850 | — | 24d | 1 | 0.10mi |
| 144 Panorama Dr Edgewater, NJ | 2.0 | 2.5 | — | $4,500 | — | 24d | 1 | 0.15mi |
| 100 Carlyle Dr Unit 17B-N Cliffside Park, NJ | 1.0 | 1.5 | — | $3,300 | — | 24d | 1 | 0.15mi |
| 100 Carlyle Dr Unit 11J-N Cliffside Park, NJ | 2.0 | 2.5 | — | $4,750 | — | 24d | 1 | 0.15mi |
| 119 Panorama Dr #119 Edgewater, NJ | 3.0 | 2.5 | — | $6,000 | — | 19d | 1 | 0.15mi |
| 35A Edgewater Pl Edgewater, NJ | 3.0 | 2.0 | — | $3,500 | — | 24d | 1 | 0.16mi |
| 905 River Rd Unit 327 Edgewater, NJ | 1.0 | 1.0 | — | $2,700 | — | 24d | 1 | 0.17mi |
| 200 Winston Dr Unit 1006 Cliffside Park, NJ | 1.0 | 1.0 | — | $3,150 | — | 2d | 1 | 0.18mi |
| 200 Winston Dr Unit 3018 Cliffside Park, NJ | 2.0 | 2.0 | — | $3,700 | — | 24d | 1 | 0.18mi |
| 200 Winston Dr #2907 Cliffside Park, NJ | 2.0 | 2.0 | — | $4,000 | — | 24d | 1 | 0.18mi |
| 200 Winston Dr #3011 Cliffside Park, NJ | 1.0 | 1.0 | — | $2,850 | — | 22d | 1 | 0.18mi |
| 46 Hudson Ave Unit B Edgewater, NJ | 3.0 | 2.0 | — | $4,000 | — | 20d | 1 | 0.18mi |
| 46 Hudson Ave Unit C Edgewater, NJ | 2.0 | 1.0 | — | $3,000 | — | 20d | 1 | 0.18mi |
| 100 Tower Dr Edgewater, NJ | 1.0–3.0 | 1.0–2.5 | 1290 | $5,617 | $4.35 | 1d | 9 | 0.20mi |
| 30 Lafayette Ave Cliffside Park, NJ | 3.0 | 3.5 | — | $8,100 | — | 4d | 1 | 0.20mi |
| 300 Winston Dr Unit L5 Cliffside Park, NJ | 3.0 | 2.0 | — | $4,300 | — | 24d | 1 | 0.22mi |
| 11 Beverly Pl Edgewater, NJ | 2.0 | 1.0 | — | $3,000 | — | 24d | 1 | 0.22mi |
| 300 Winston Dr #2118 Cliffside Park, NJ | 2.0 | 2.0 | — | $3,600 | — | 24d | 1 | 0.23mi |
| 30 Knox Ave Cliffside Park, NJ | 3.0 | 1.5 | — | $4,000 | — | 24d | 1 | 0.24mi |
| 300 Winston Dr Unit 1020 Cliffside Park, NJ | 2.0 | 1.5 | — | $3,000 | — | 2d | 1 | 0.24mi |
| 300 Winston Dr Unit 318 Cliffside Park, NJ | 2.0 | 2.0 | — | $3,400 | — | 24d | 1 | 0.24mi |
| 300 Winston Dr Unit 2112 Cliffside Park, NJ | 2.0 | 2.0 | — | $3,350 | — | 24d | 1 | 0.24mi |
| 46 Garden Pl Unit 2 Edgewater, NJ | 3.0 | 1.0 | — | $3,800 | — | 17d | 1 | 0.24mi |
| 68 Lafayette Ave Cliffside Park, NJ | 2.0 | 1.0 | — | $2,500 | — | 24d | 1 | 0.25mi |
| 28 Garden Pl #163 Edgewater, NJ | 2.0 | 2.0 | — | $3,500 | — | 10d | 1 | 0.26mi |
| 100 Grand Cove Way Unit 5A Edgewater, NJ | 2.0 | 2.0 | — | $3,950 | — | 12d | 1 | 0.27mi |
| 21 Valley Pl Unit 3 Edgewater, NJ | 1.0 | 1.0 | — | $2,200 | — | 22d | 1 | 0.28mi |
| 23 Valley Pl Edgewater, NJ | 3.0 | 1.0 | — | $3,700 | — | 24d | 1 | 0.28mi |
| 400 Crown Ct #561 Edgewater, NJ | 2.0 | 2.0 | — | $3,275 | — | 13d | 1 | 0.29mi |
| 1055 River Rd Edgewater, NJ | 1.0 | 1.5 | — | $2,775 | — | 6d | 2 | 0.30mi |
| 300 Crown Ct #523 Edgewater, NJ | 2.0 | 2.0 | — | $3,200 | — | 20d | 1 | 0.30mi |
| 825 Palisade Ave Unit C2 Fort Lee, NJ | 2.0 | 2.0 | — | $2,800 | — | 24d | 1 | 0.31mi |
| 30 Hudson Ter Unit C Edgewater, NJ | 1.0 | 1.0 | — | $2,000 | — | 24d | 1 | 0.31mi |
| 32 Hudson Ter Unit 2 Edgewater, NJ | 3.0 | 2.0 | — | $3,800 | — | 6d | 1 | 0.31mi |
| 32 Hudson Ter Unit 2 Edgewater, NJ | 3.0 | 2.0 | — | $3,850 | — | 24d | 1 | 0.31mi |
| 20 Lawton Ave Cliffside Park, NJ | 1.0 | 1.0 | — | $1,750 | — | 24d | 1 | 0.32mi |
| 553 Undercliff Ave #5 Edgewater, NJ | 1.0 | 1.0 | — | $2,295 | — | 24d | 1 | 0.33mi |
Listing history 21 events
-
2026-06-18days on market $2,099,000 Active 135 DOM
-
2026-06-17days on market $2,099,000 Active 134 DOM
-
2026-06-16days on market $2,099,000 Active 133 DOM
-
2026-06-15days on market $2,099,000 Active 132 DOM
-
2026-06-13days on market $2,099,000 Active 130 DOM
-
2026-06-13days on market $2,099,000 Active 129 DOM
-
2026-06-09days on market $2,099,000 Active 126 DOM
-
2026-06-08days on market $2,099,000 Active 125 DOM
-
2026-06-07days on market $2,099,000 Active 124 DOM
-
2026-06-04days on market $2,099,000 Active 121 DOM
-
2026-06-03days on market $2,099,000 Active 120 DOM
-
2026-06-02days on market $2,099,000 Active 119 DOM
-
2026-06-01days on market $2,099,000 Active 118 DOM
-
2026-05-31days on market $2,099,000 Active 117 DOM
-
2026-03-24price $2,099,000
-
2026-02-03$2,195,000 Active
-
2024-08-20soldstatus $1,950,000 Sold 261-char remark
Show marketing remark (261 chars)
Five family, excellent condition, eat in kitchens, new appliances and flooring. .. laundry room. .. Great location on Undercliff Avenue. .. includes 5 off street parking spaces. .. plus 4 garages. .. back yard. .. minutes to ferry Bridge and all transportation.
-
2024-07-08historical Under Contract - Attorney Review 261-char remark
Show marketing remark (261 chars)
Five family, excellent condition, eat in kitchens, new appliances and flooring. .. laundry room. .. Great location on Undercliff Avenue. .. includes 5 off street parking spaces. .. plus 4 garages. .. back yard. .. minutes to ferry Bridge and all transportation.
-
2024-01-25historical
Show marketing remark (261 chars)
Five family, excellent condition, eat in kitchens, new appliances and flooring. .. laundry room. .. Great location on Undercliff Avenue. .. includes 5 off street parking spaces. .. plus 4 garages. .. back yard. .. minutes to ferry Bridge and all transportation.
-
2024-01-25$2,300,000 Active 261-char remark
Show marketing remark (261 chars)
Five family, excellent condition, eat in kitchens, new appliances and flooring. .. laundry room. .. Great location on Undercliff Avenue. .. includes 5 off street parking spaces. .. plus 4 garages. .. back yard. .. minutes to ferry Bridge and all transportation.
-
2024-01-24$2,300,000 Active
ⓘ Source: listings_history table (triggers on properties + properties_extension) + one-shot
backfill from property_details.listing_events for pre-trigger history.
Tax reassessment forecast NJ · Partial reset (capped growth)
- Current annual tax
- $22,517 · $1,876/mo
- Projected year-2 tax
- $37,391 · $3,116/mo
- Expected delta
- +$14,874/yr (+$1,240/mo · 66.1%)
ⓘ Screening estimate from a state-policy table — verify with the county assessor before closing.
Climate risk First Street
- Flood 1/10 Low FEMA zone X (unshaded) · 0% chance over 30 yrs
- Wildfire 1/10 Low
- Heat 7/10 Severe 7 d/yr ≥99°F today · 15 d/yr by 30 yrs out
- Wind 6/10 Major 27% chance of damaging wind over 30 yrs
- Air quality 4/10 Moderate 5 unhealthy d/yr today · 6 by 30 yrs out
Nearby sold comps map
Loading sold comps map…
Walkable amenities ~0.75 mi
Loading nearby amenities…
Taxation est. · year 1
- Rental income
- $215,952
- − Mortgage interest
- −$117,577
- − Property taxes
- −$22,517
- − Insurance
- −$10,495
- − Repairs & maintenance
- −$17,276
- − Management
- −$17,276
- − Depreciation
- −$61,062
- Taxable loss
- −$30,251
- Est. tax savings @ 24.0%
- +$7,260
- After-tax cash flow
- $12,762/yr
For passive investors: Depreciation is non-cash, so a rental often shows a tax loss while cash-flowing — sheltering income. Rental losses are passive: they offset passive income freely, and up to $25,000/yr can offset ordinary (W-2) income if you actively participate and your MAGI is under $100k (phasing out to $0 by $150k); unused losses carry forward. On sale, claimed depreciation is recaptured at up to 25%, and gains may owe capital-gains tax (a 1031 exchange can defer both). Figures are a year-1 estimate at your 24.0% rate — not tax advice; consult a CPA.
Schools (NCES district)
- District
- Edgewater School District
- NCES district ID
- 3404440
- Math proficiency
- 51% ▲ 2.00%
- Reading proficiency
- 58% ▼ -3.00%
- Median HH income
- $95,596
- Composite
- 52.69/100
- National rank
- #3328
- State rank
- #276 of 612 in NJ
Livability — Edgewater
- Score
- 80/100
- State rank
- #74
- US rank
- #1774
Category grades
Schools grade is shown separately in the Schools card above.
Census & demographics
- Census place
- Edgewater, NJ
- County
- Bergen County · 586,961 people
- City population
- 14,759
- Metro
- New York-Newark-Jersey City, NY-NJ-PA
- Population (ZIP)
- 14,759
- Household income
- $124,050
- Rent vs Own
- Severe rent burden
- 1039.0
Population outlook (Bergen County) Hauer SSP2
- Today (2025)
- 1,021,896 people
- By 2030
- 1,063,119 · +4.0%
- By 2040
- 1,146,566 · +12.2%
- By 2050
- 1,229,132 · +20.3%
- By 2075
- 1,429,694 · +39.9%
- By 2100
- 1,547,614 · +51.4%
Race, ethnicity, and origin ACS 2023
- Neighborhood character
- Diverse neighborhood (Simpson 0.66)
- Race & ethnicity
- Asian 42% White 38% Hispanic / Latino 12% Two or more races 10% Black 3%
- Hispanic origin (detail)
- Puerto Rican 4% Cuban 2% Dominican 1%
- Common ancestry
- Scotch-Irish 3% Romanian 2% Lithuanian 2%
- Foreign-born
- 53% · South Korea, China, Canada
- Languages at home
- 43% English-only · Korean 15% Spanish 10% Chinese 9%
Political lean MEDSL · Bergen
- 2024 margin
- Toss-up / Even · D 50.7% · R 47.3% · Other 2.0%
- 2008→2024 swing
- -6.1pp toward R · 2008: 9.5pp · 2024: 3.4pp
- All cycles
- 2024: D+3.4 2020: D+16.4 2016: D+12.0 2012: D+10.8 2008: D+9.5
Not yet ingested
- Civics
- —
Market trends
- HPI YoY
- ▲ 7.12%
- Current HPI
- 296.478
- Rent YoY
- ▲ 4.02%
- Metro
- New York-Newark-Jersey City, NY-NJ-PA
- State GDP YoY
- ▲ 2.05%
- F500 in state
- 34
Industry mix (Fortune 500 HQ in NJ)
| Industry | F500 HQs | Revenue |
|---|---|---|
| Consumer Goods | 3 | $31B |
|
||
| Pharmaceuticals | 2 | $153B |
|
||
| Technology | 2 | $21B |
|
||
| Insurance | 2 | $20B |
|
||
| Healthcare | 2 | $19B |
|
||
| Financial Services | 1 | $70B |
|
||
Price history
-8.7% since first listed7 events — show timeline
- 2026-03-24 Price Changed $2,099,000 NJMLS
- 2026-02-03 Listed $2,195,000 NJMLS
- 2024-08-20 Sold (MLS) $1,950,000 NJMLS
- 2024-07-08 Contingent — NJMLS
- 2024-01-25 Delisted — NJMLS
- 2024-01-25 Listed $2,300,000 NJMLS
- 2024-01-24 Listed $2,300,000 NJMLS
Property tax history
+6.4%/yrLatest (2025): $22,517 · +33.0% YoY. Source: county tax records.
Cash-flow waterfall
monthlySold comps — $/sqft
last 12 mo · ≤1 miLoading sold comps…