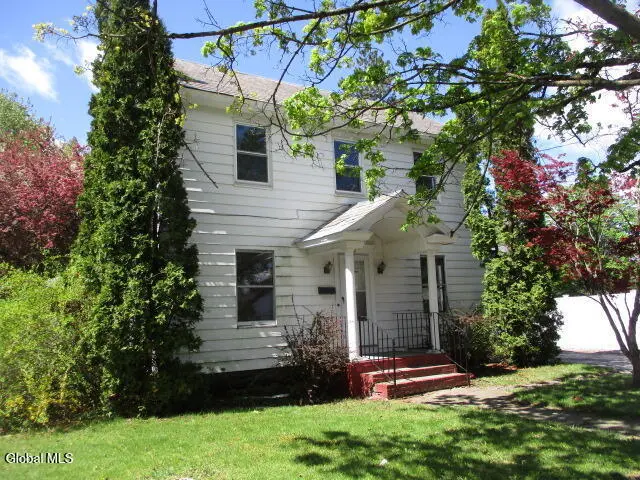
42 Garfield St · Glens Falls, NY
Flood risk 1/10 · Minimal
- FEMA flood zone
- X
- Chance of flooding over 30 yrs
- 0.0%
- Est. flood insurance / yr
- $473 – $860
Fire risk 1/10 · Minimal
- Est. fire insurance / yr
- $691 – $1,283
Heat risk 3/10 · Minor
- Hot days now (above 96°F)
- 7 days/yr
- Hot days in 30 yrs
- 16 days/yr
Wind risk 2/10 · Minimal
- Chance of severe wind over 30 yrs
- 3.0%
Air-quality risk 1/10 · Minimal
- Unhealthy air days now
- 0 days/yr
- Unhealthy air days in 30 yrs
- 0 days/yr
Risk factors via First Street. Map © Google.
Why this score? — see what drove the D+ grade
The composite is a weighted blend of 9 inputs, each scored 0–100. Each bar is that input's sub-score; the figure is the points it added to the 100-point composite (weight × sub-score).
- ARV discount +15.0/15.0
- Cash flow +11.4/30.0
- 1% rule +5.3/10.0
- Livability +4.2/5.0
- Schools +4.1/10.0
- DSCR +3.3/10.0
- Rent growth +2.5/5.0
- Condition / age +2.5/5.0
- Appreciation +0.0/10.0
$180,000
🖨 Deal sheet (PDF) 📄 Offer letter ✓ Due diligence
Listing remarks
Nice colonial close to school and downtown. Garage, Large yard, Full dry basement, Fireplace , Hardwood floors. Great screened in rear porch.
Key facts
- Large yard
- Full dry basement
- Fireplace
Tags
Property features AI
Exterior
- Parking: Attached garage (1-car); Total 2 parking spaces; Driveway parking
- Utilities: Public water; Public sewer
- Home design: Single family residence; 1,313 living area
- Construction: Aluminum siding; Wood siding; Shingle roof; Slate roof
- Exterior features: Rear enclosed porch; Porch; Paved driveway
Interior
- Kitchen: Kitchen on first floor; Appliances: Other
- Bedrooms: Three bedrooms on the second floor
- Flooring: Vinyl; Hardwood; Linoleum
- Bathrooms: One full bathroom
- Heating & cooling: Baseboard heating; Natural gas heating
- Interior features: Seven total rooms; Full basement with interior entry; Living room fireplace
Neighborhood map
What this means for you Summary
Snapshot
- This is a 3-bed/1.5-bath single-family listed at $180k.
Deal economics
- At list price, monthly cash flow is $-63 ($-752/yr) — negative.
- To cash-flow at today's rent, offer at most $169k (6.1% below list).
- Meets the 1% rule at list price ($2k rent vs $180k).
- Recommended offer: $169k (6.1% below list) — sets the bar for cash-flow.
- Cap rate 5.9% vs local median 4.8% in Glens Falls — meaningfully above typical; check what's discounted (condition, days-on-market, listing class) to confirm the premium yield is real.
Location & tenants
- Location reads 83/100 on livability (#60 in NY, #894 nationally) — a professional / high-income tenant draw. Strengths: crime A+, amenities A+, housing A+.
- Glens Falls City School District (urban): math 44% / reading 53% proficiency, ranked #416 of 590 in NY (top 70%) — families likely to look elsewhere, expect single-tenant / working-renter base with shorter leases.
- Zoned schools: Kensington Road School (math 77% / reading 82%, grade A, #188 of 2,108 statewide, top 11%, 280 students, 22% FRL); Glens Falls Middle School (math 25% / reading 46%, grade F, #473 of 729 statewide, top 66%, 588 students, 46% FRL); Glens Falls Senior High School (math 98% / reading 64%, grade A, #485 of 1,100 statewide, top 45%, 601 students, 41% FRL) — zoned schools at 36% FRL track the district average.
- Zoned-school proficiency averages 65% at this address vs 48% district-wide (+17 pts) — the actual schools serving this property are materially stronger than the Glens Falls City School District average implies; a family-tenant draw the district grade alone would hide.
- Market conditions: 58 active listings in the ZIP; 4 comparable units currently listed for rent nearby; rentals at typical pace (median 23d on market — plan ~3-4 weeks tenant-placement turnaround); 180 units permitted in Warren County in 2024 (40 in 5+ unit buildings).
- This rent runs 33% of the median local income ($68k/yr) — at the standard rent-burdened threshold; future hikes will face affordability resistance.
Forward outlook
- Local home prices are declining (-3.0%/yr); year-one equity from $1k of loan paydown is wiped out by about $5k of value loss. Plan a longer hold.
- Warren County population projected at -19% by 2050 — secular population decline; favor cash flow + early exit over multi-decade hold.
Negotiation context
- Only 12 days on market — expect competitive offers; lowballing is unlikely to land.
Risks & watch-outs
- Watch-outs: property tax is 3.4% of price; built in 1936 — expect roof / HVAC / electrical / plumbing capex.
Questions for the listing agent
- What do current leases actually rent for vs. the listed asking? Can we see a recent rent roll and the last 12 months of T-12 income?
- Built in 1936 — when were the roof, HVAC, electrical panel, plumbing, and water heater last replaced?
- Property tax is high relative to price — has the assessment been appealed recently, and will the sale trigger a re-assessment?
- Is there a deadline driving the sale (1031 exchange, divorce, estate, relocation)? That informs how much negotiation room exists.
- The area grade is low — what's the realistic commute time and amenity access for the typical tenant pool here? Any planned neighborhood developments (good or bad) we should know about?
- What's the average days-on-market for RENTAL listings here right now (not sales)? A rising rental-DOM trend means longer vacancies and softer asking-rent achievability than the comps imply.
- What's the recent tenant-quality profile in this submarket — average credit score on applications, eviction rate, late-payment / NSF rate, and stable-employment percentage? A property-management company in the area should have these aggregated.
- How much new for-sale + rental construction is in the pipeline within 1–3 miles? Heavy new supply typically softens prices + rents 12–24 months out; constrained supply supports both.
Investment metrics
- 1% rule
- 1.03% ✓
- Cap rate
- 5.88%
- Cash-on-cash
- -1.49%
- DSCR
- 0.93
- GRM
- 8.1
CMA / ARV
- ARV (on-the-fly)
- $235,312
- Comps found
- 12
Show comp detail 12 sales within ~0.75 mi
| Address | Dist | Beds/Ba | Sqft | Sold | Price | $/sf | Match |
|---|---|---|---|---|---|---|---|
| 5 Quade St | 0.28mi | 3/1.0 | 1,237 (+0%) | 8mo | $234,000 | $189 | 77 |
| 24 Goodwin Ave | 0.47mi | 4/1.5 (+1) | 1,257 (+2%) | 5mo | $240,000 | $191 | 66 |
| 68 1st St | 0.72mi | 3/1.0 | 1,266 (+3%) | 1mo | $252,000 | $199 | 59 |
| 59 First St | 0.70mi | 3/1.5 | 1,249 (+1%) | 8mo | $90,000 | $72 | 59 |
| 174 Upper Sherman Ave | 0.52mi | 3/2.5 | 1,298 (+5%) | 8mo | $270,000 | $208 | 57 |
| 17 Columbia Ave | 0.71mi | 2/2.0 (-1) | 1,232 (0%) | 4mo | $289,000 | $235 | 56 |
| 8 Sarella St | 0.68mi | 3/2.0 | 1,129 (-8%) | 2mo | $178,000 | $158 | 51 |
| 25 Thomson Ave | 0.43mi | 3/1.5 | 1,078 (-12%) | 10mo | $259,900 | $241 | 51 |
| 15 Holden Ave | 0.64mi | 2/1.0 (-1) | 1,158 (-6%) | 5mo | $200,000 | $173 | 49 |
| 27 Webster Ave | 0.61mi | 2/1.0 (-1) | 1,150 (-7%) | 10mo | $221,000 | $192 | 45 |
| 40 Orville St | 0.45mi | 3/2.5 | 1,406 (+14%) | 10mo | $230,000 | $164 | 44 |
| 2 New St | 0.74mi | 3/1.5 | 1,059 (-14%) | 1mo | $195,000 | $184 | 41 |
Match score weights: distance 35% · size 25% · config 20% · recency 20%. Top-matched comps best support the ARV.
Projected returns pro-forma
-3.0% appreciation · 3.0% rent growth · sell at horizon
- IRR
- -18.6%
- Equity multiple
- 0.35×
- Total profit
- $-32,958
- Equity at exit
- $26,839
- IRR
- -10.8%
- Equity multiple
- 0.34×
- Total profit
- $-33,029
- Equity at exit
- $15,563
Cash invested: $50,400 (down + closing). Projections, not guarantees.
Landlord ↔ Tenant lean methodology
- Overall (STATE)
- 15 Strongly Tenant-Friendly
- State New York
- 15 Strongly Tenant-Friendly · D+10
- County
- — inherits STATE
- City
- — inherits STATE
ZIP-level market 12801
- Home prices YoY
- -13.7%
- Active inventory
- 58
- Price-to-rent
- 8.1×
Monthly cashflow live
- Estimated rent
- $1,848 medium interval (Pro) →
- Mortgage (P&I)
- −$944
- Tax from tax record
- −$503 /mo · $6,040/yr
- Insurance
- −$75
- HOA
- −$0
- Vacancy / Maint / Mgmt
- −$388
- Net cashflow
- $-63
Break-even live
Sensitivity live
| Price | -10% $39 | -5% $-12 | +0% $-63 | +5% $-114 | +10% $-165 |
|---|---|---|---|---|---|
| Rent | -10% $-209 | -5% $-136 | +0% $-63 | +5% $10 | +10% $83 |
| Rate | -1.0pp $28 | -0.5pp $-17 | base $-63 | +0.5pp $-109 | +1.0pp $-157 |
UW: 25.0% down · 7.5% · 30yr · 1.5% tax · 5.0% vac · 8.0% maint · 8.0% mgmt
Financing live
Cash to close
- Down payment
- $45,000
- Closing costs
- $5,400
- Reserves months
- —
- Total cash needed
- —
Loan-product check · same deal, 3 products live
Conventional
25% down · 7.5% · 30yr
- Down + closing
- —
- Monthly P&I
- —
- Monthly cashflow
- —
- DSCR
- —
- Eligible?
- —
Personal DTI + credit; lowest rate.
DSCR
20% down · 8.5% · 30yr
- Down + closing
- —
- Monthly P&I
- —
- Monthly cashflow
- —
- DSCR
- —
- Eligible?
- —
No personal income docs; deal must DSCR.
Hard money
10% down · 12.0% · 12mo
- Down + closing
- —
- Monthly P&I
- —
- Monthly cashflow
- —
- DSCR
- —
- Eligible?
- —
Short-term bridge; refi at stabilization.
Rent comps 4 comps
| Address | Beds | Baths | Sqft | Rent | $/sqft | DOM | Units | Dist |
|---|---|---|---|---|---|---|---|---|
| 11 Hunter St Glens Falls, NY | 2.0 | 1.0 | 1465 | $2,200 | $1.50 | 23d | 1 | 0.63mi |
| 173 Bay St Glens Falls, NY | 3.0 | 1.0 | 1200 | $1,795 | $1.50 | 45d | 1 | 0.64mi |
| 26 Grand St Glens Falls, NY | 2.0 | 1.0 | 792 | $1,600 | $2.02 | 16d | 1 | 0.68mi |
| 60-62 Lawrence St Glens Falls, NY | 2.0 | 1.0 | 1000 | $1,650 | $1.65 | 16d | 1 | 1.05mi |
Listing history 2 events
-
2026-06-07days on market $180,000 Pending 12 DOM
-
2026-05-19$180,000 Active
ⓘ Source: listings_history table (triggers on properties + properties_extension) + one-shot
backfill from property_details.listing_events for pre-trigger history.
Tax reassessment forecast NY · Partial reset (capped growth)
- Current annual tax
- $6,040 · $503/mo
- Projected year-2 tax
- $6,040 · $503/mo
- Expected delta
- $0/yr ($0/mo · 0.0%)
ⓘ Screening estimate from a state-policy table — verify with the county assessor before closing.
Climate risk First Street
- Flood 1/10 Low FEMA zone X · 0% chance over 30 yrs
- Wildfire 1/10 Low
- Heat 3/10 Moderate 7 d/yr ≥96°F today · 16 d/yr by 30 yrs out
- Wind 2/10 Low 3% chance of damaging wind over 30 yrs
- Air quality 1/10 Low 0 unhealthy d/yr today · 0 by 30 yrs out
Nearby sold comps map
Loading sold comps map…
Walkable amenities ~0.75 mi
Loading nearby amenities…
Taxation est. · year 1
- Rental income
- $22,171
- − Mortgage interest
- −$10,083
- − Property taxes
- −$6,040
- − Insurance
- −$900
- − Repairs & maintenance
- −$1,774
- − Management
- −$1,774
- − Depreciation
- −$5,236
- Taxable loss
- −$3,635
- Est. tax savings @ 24.0%
- +$872
- After-tax cash flow
- $121/yr
For passive investors: Depreciation is non-cash, so a rental often shows a tax loss while cash-flowing — sheltering income. Rental losses are passive: they offset passive income freely, and up to $25,000/yr can offset ordinary (W-2) income if you actively participate and your MAGI is under $100k (phasing out to $0 by $150k); unused losses carry forward. On sale, claimed depreciation is recaptured at up to 25%, and gains may owe capital-gains tax (a 1031 exchange can defer both). Figures are a year-1 estimate at your 24.0% rate — not tax advice; consult a CPA.
Schools (NCES district)
- District
- Glens Falls City School District
- NCES district ID
- 3612240
- Math proficiency
- 44% ▼ -8.00%
- Reading proficiency
- 53% ▲ 6.00%
- Median HH income
- $48,216
- Composite
- 41.34/100
- National rank
- #3499
- State rank
- #416 of 590 in NY
Livability — Glens Falls
- Score
- 83/100
- State rank
- #60
- US rank
- #894
Category grades
Schools grade is shown separately in the Schools card above.
Census & demographics
- Census place
- Glens Falls, NY
- County
- Warren County · 14,628 people
- City population
- 14,628
- Metro
- Glens Falls, NY
- Population (ZIP)
- 14,628
- Household income
- $67,577
- Rent vs Own
- Severe rent burden
- 866.0
Population outlook (Warren County) Hauer SSP2
- Today (2025)
- 62,372 people
- By 2030
- 60,491 · -3.0%
- By 2040
- 55,616 · -10.8%
- By 2050
- 50,437 · -19.1%
- By 2075
- 40,843 · -34.5%
- By 2100
- 31,159 · -50.0%
Race, ethnicity, and origin ACS 2023
- Neighborhood character
- Predominantly White (90%)
- Race & ethnicity
- White 90% Two or more races 6% Hispanic / Latino 3% Black 2%
- Common ancestry
- Lithuanian 9% Romanian 5% Slovak 5%
- Foreign-born
- 3% · Canada, Dominican Republic
- Languages at home
- 97% English-only · Spanish 1% German/W. Germanic 1%
Political lean MEDSL · Warren
- 2024 margin
- Toss-up / Even · D 47.9% · R 52.1%
- 2008→2024 swing
- -6.9pp toward R · 2008: 2.6pp · 2024: -4.2pp
- All cycles
- 2024: R+4.2 2020: R+0.2 2016: R+10.6 2012: D+2.1 2008: D+2.6
Not yet ingested
- Civics
- —
Market trends
- HPI YoY
- ▼ -52.28%
- Current HPI
- 330.581
- Rent YoY
- —
- Metro
- Glens Falls, NY
- State GDP YoY
- ▲ 2.60%
- F500 in state
- 92
Industry mix (Fortune 500 HQ in NY)
| Industry | F500 HQs | Revenue |
|---|---|---|
| Financial Services | 10 | $950B |
|
||
| Consumer Goods | 9 | $162B |
|
||
| Insurance | 4 | $225B |
|
||
| Telecommunications | 2 | $144B |
|
||
| Pharmaceuticals | 2 | $112B |
|
||
| Media / Entertainment | 2 | $69B |
|
||
Price history
1 event — show timeline
- 2026-05-19 Listed $180,000 Global MLS
Property tax history
+33.5%/yrLatest (2025): $6,040 · +31.3% YoY. Source: county tax records.
Cash-flow waterfall
monthlySold comps — $/sqft
last 12 mo · ≤1 miLoading sold comps…