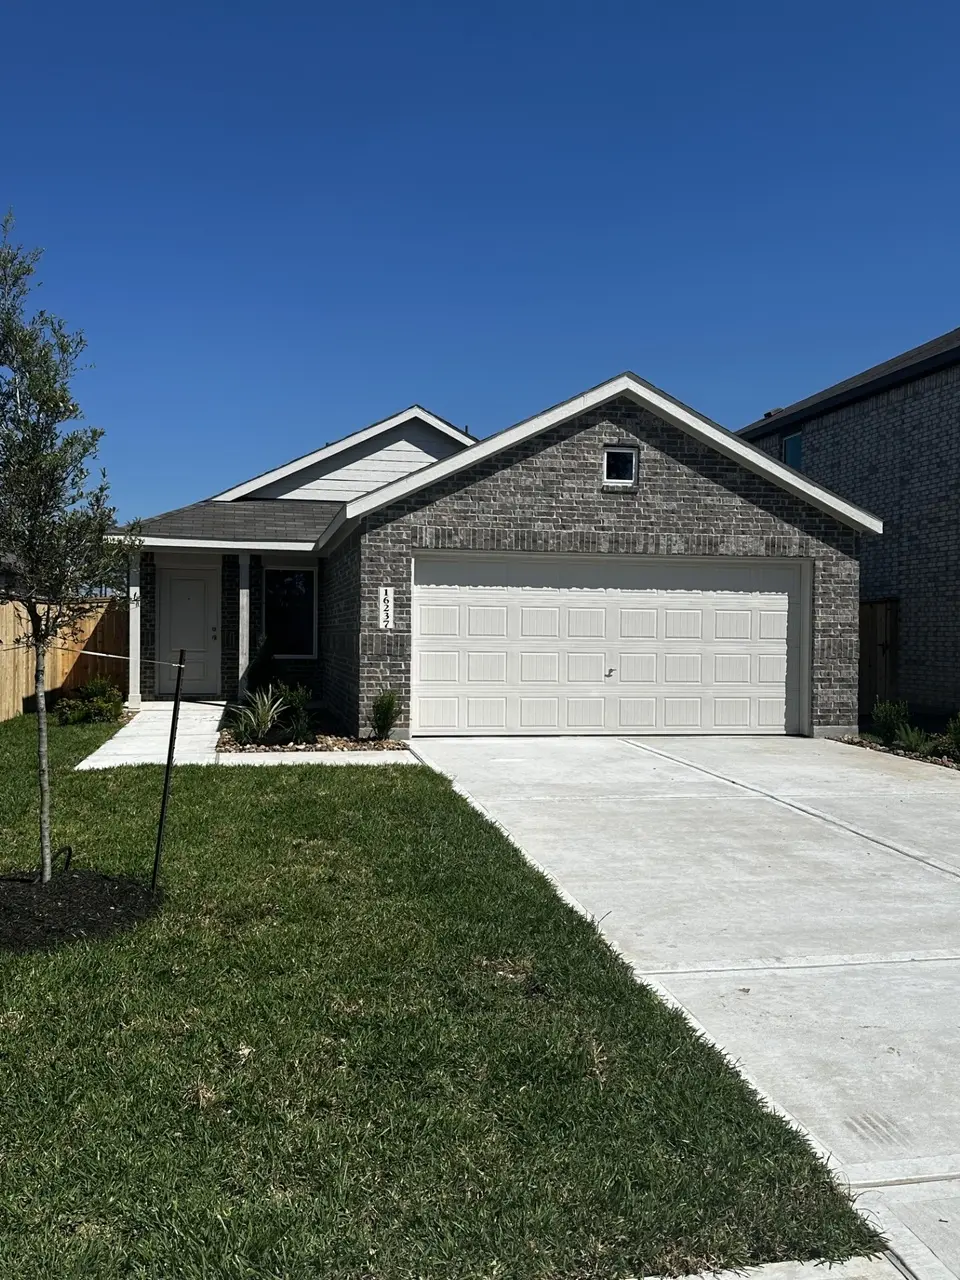
16237 Bergara Bend Dr · Cleveland, TX
Flood risk No data
- FEMA flood zone
- —
- Chance of flooding over 30 yrs
- —
- Est. flood insurance / yr
- —
Fire risk No data
- Est. fire insurance / yr
- —
Heat risk No data
- Hot days now (above threshold)
- —
- Hot days in 30 yrs
- —
Wind risk No data
- Chance of severe wind over 30 yrs
- —
Air-quality risk No data
- Unhealthy air days now
- —
- Unhealthy air days in 30 yrs
- —
Risk factors via First Street. Map © Google.
Why this score? — see what drove the C- grade
The composite is a weighted blend of 9 inputs, each scored 0–100. Each bar is that input's sub-score; the figure is the points it added to the 100-point composite (weight × sub-score).
- ARV discount +15.0/15.0
- Cash flow +12.7/30.0
- 1% rule +4.9/10.0
- Condition / age +4.8/5.0
- DSCR +3.8/10.0
- Rent growth +3.5/5.0
- Livability +3.1/5.0
- Schools +2.5/10.0
- Appreciation +0.0/10.0
$192,990
🖨 Deal sheet (PDF) 📄 Offer letter ✓ Due diligence
Listing remarks
NEW! Lennar Cottage Collection in Timbers Edge! The Oakridge plan with Elevation "J3" reveals a spacious single story showcasing an open floorplan shared between the kitchen, dining area and family room for easy entertaining during gatherings. An owner’s suite enjoys a private location in a rear corner of the home, complemented by an en-suite bathroom and walk-in closet. There are two secondary bedrooms along the side of the home, which are ideal for household members and hosting overnight guests.
Key facts
- 2 garage spots
- Built 2026
- Listed 25 days
Property features AI
Finance
- HOA & community: Timbers Edge Community Association; Annual association fee of $2,300
Exterior
- Parking: Attached garage with 2 spaces
- Utilities: Public water; Public sewer
- Home design: Residential property; Single-story (entry level on first floor); Slab foundation
- Construction: Built in 2026; Brick and cement siding exterior; New construction
- Exterior features: Subdivision lot setting; Composition roof
Interior
- Kitchen: Kitchen on the first floor
- Bedrooms: Primary bedroom on the first floor (14 x 13); Two additional first-floor bedrooms (each 11 x 10) — total 3 bedrooms possible
- Bathrooms: 2 full bathrooms
- Heating & cooling: Central heating (gas); Central electric air conditioning
- Interior features: 6 total rooms; Under construction (new construction by Lennar)
Neighborhood map
What this means for you Summary
Snapshot
- This is a 3-bed/2.0-bath single-family listed at $193k. Condition is rated excellent.
Deal economics
- At list price, monthly cash flow is $-21 ($-251/yr) — negative.
- To cash-flow at today's rent, offer at most $190k (1.6% below list).
- To meet the 1% rule (rent ≥ 1% of price), the offer needs to be $190k (1.3% below list).
- Recommended offer: $190k (1.6% below list) — sets the bar for cash-flow.
- Cap rate 6.2% vs local median 4.7% in Cleveland — top-decile yield for the area; either an underpriced asset or a hidden risk that comps aren't pricing in. Stress-test before assuming the spread holds.
Location & tenants
- Location reads 61/100 on livability (#1,013 in TX) — a middle-class / working-renter tenant base. Strengths: cost of living A+, housing A+; Watch: schools F, crime D-, amenities F.
- Splendora ISD (rural): math 25% / reading 31% proficiency, ranked #648 of 826 in TX (top 78%) — low school quality limits family demand, transient renter base, plan for 1-2y turnover.
- Market conditions: Rents rising fast (+4.0%/yr); 1574 active listings in the ZIP; 2 comparable units currently listed for rent nearby; 13,259 units permitted in Montgomery County in 2024 (1,402 in 5+ unit buildings).
- This rent runs 37% of the median local income ($62k/yr) — at the standard rent-burdened threshold; future hikes will face affordability resistance.
Forward outlook
- Local home prices are declining (-3.0%/yr); year-one equity from $1k of loan paydown is wiped out by about $6k of value loss. Plan a longer hold.
- Montgomery County population projected at +65% by 2050 — long-run rental-demand tailwind backs the buy-and-hold thesis.
Negotiation context
- It's been on market 25 days — a 2% lower offer ($190k) is reasonable based on typical stale-listing flexibility.
Questions for the listing agent
- What do current leases actually rent for vs. the listed asking? Can we see a recent rent roll and the last 12 months of T-12 income?
- What does the HOA fee cover, when was the last increase, and are there any pending special assessments or reserve-fund shortfalls?
- Is there a deadline driving the sale (1031 exchange, divorce, estate, relocation)? That informs how much negotiation room exists.
- Schools are F-rated, which usually means shorter tenancies and higher turnover. Who's the typical renter profile here, and what's been the actual vacancy rate?
- Crime grade is D in this area — have there been break-ins, vandalism, or insurance claims at this property in the last 3 years? What carrier currently insures it and at what premium?
- What's the average days-on-market for RENTAL listings here right now (not sales)? A rising rental-DOM trend means longer vacancies and softer asking-rent achievability than the comps imply.
- What's the recent tenant-quality profile in this submarket — average credit score on applications, eviction rate, late-payment / NSF rate, and stable-employment percentage? A property-management company in the area should have these aggregated.
- How much new for-sale + rental construction is in the pipeline within 1–3 miles? Heavy new supply typically softens prices + rents 12–24 months out; constrained supply supports both.
Investment metrics
- 1% rule
- 0.99% ✗
- Cap rate
- 6.16%
- Cash-on-cash
- -0.46%
- DSCR
- 0.98
- GRM
- 8.4
CMA / ARV
- ARV (median comp)
- $243,521
- List price
- $192,990
- Delta
- -20.75%
- Verdict
- UNDERPRICED
- Comps
- 20 within 1.0 mi
Show comp detail 12 sales within ~0.75 mi
| Address | Dist | Beds/Ba | Sqft | Sold | Price | $/sf | Match |
|---|---|---|---|---|---|---|---|
| 16246 Bergara Bend Dr | 0.04mi | 3/2.0 | 1,311 (0%) | 0mo | $231,990 | $177 | 98 |
| 16206 Bergara Bend Dr | 0.04mi | 3/2.0 | 1,311 (0%) | 1mo | $231,990 | $177 | 97 |
| 16218 Bergara Bend Dr | 0.04mi | 3/2.0 | 1,409 (+8%) | 1mo | $235,990 | $167 | 85 |
| 16226 Bergara Bend Dr | 0.04mi | 3/2.0 | 1,418 (+8%) | 1mo | $243,990 | $172 | 84 |
| 16229 Bergara Bend Dr | 0.04mi | 3/2.0 | 1,451 (+11%) | 1mo | $235,990 | $163 | 80 |
| 21344 Pine Mill Dr | 0.41mi | 3/2.0 | 1,412 (+8%) | 3mo | $222,000 | $157 | 65 |
| 20807 Olive Leaf St | 0.39mi | 3/2.0 | 1,444 (+10%) | 4mo | $225,000 | $156 | 62 |
| 15332 Timber Preserve Ln | 0.27mi | 3/2.0 | 1,448 (+10%) | 11mo | $225,000 | $155 | 61 |
| 21328 Pine Mill Dr | 0.44mi | 3/2.0 | 1,479 (+13%) | 4mo | $195,960 | $132 | 55 |
| 14996 Timber Pines Dr | 0.62mi | 3/2.0 | 1,415 (+8%) | 13mo | $238,990 | $169 | 47 |
| 15215 Mayflower St | 0.65mi | 3/2.0 | 1,415 (+8%) | 12mo | $252,990 | $179 | 46 |
| 20723 Southern Woods Dr | 0.69mi | 3/2.0 | 1,506 (+15%) | 4mo | $215,000 | $143 | 40 |
Match score weights: distance 35% · size 25% · config 20% · recency 20%. Top-matched comps best support the ARV.
Projected returns pro-forma
-3.0% appreciation · 4.0% rent growth · sell at horizon
- IRR
- -15.7%
- Equity multiple
- 0.44×
- Total profit
- $-30,522
- Equity at exit
- $28,775
- IRR
- -5.3%
- Equity multiple
- 0.64×
- Total profit
- $-19,591
- Equity at exit
- $16,686
Cash invested: $54,037 (down + closing). Projections, not guarantees.
Landlord ↔ Tenant lean methodology
- Overall (STATE)
- 87 Strongly Landlord-Friendly
- State Texas
- 87 Strongly Landlord-Friendly · R+5
- County
- — inherits STATE
- City
- — inherits STATE
ZIP-level market 77327
- Home prices YoY
- -5.2%
- Rents YoY
- 4.0%
- Active inventory
- 1574
- Price-to-rent
- 8.4×
Monthly cashflow live
- Estimated rent
- $1,905 medium interval (Pro) →
- Mortgage (P&I)
- −$1,012
- Tax est. 1.5%
- −$241 /mo · $2,895/yr
- Insurance
- −$80
- HOA
- −$192
- Vacancy / Maint / Mgmt
- −$400
- Net cashflow
- $-21
Break-even live
Sensitivity live
| Price | -10% $112 | -5% $46 | +0% $-21 | +5% $-88 | +10% $-154 |
|---|---|---|---|---|---|
| Rent | -10% $-171 | -5% $-96 | +0% $-21 | +5% $54 | +10% $130 |
| Rate | -1.0pp $76 | -0.5pp $28 | base $-21 | +0.5pp $-71 | +1.0pp $-122 |
UW: 25.0% down · 7.5% · 30yr · 1.5% tax · 5.0% vac · 8.0% maint · 8.0% mgmt
Financing live
Cash to close
- Down payment
- $48,248
- Closing costs
- $5,790
- Reserves months
- —
- Total cash needed
- —
Loan-product check · same deal, 3 products live
Conventional
25% down · 7.5% · 30yr
- Down + closing
- —
- Monthly P&I
- —
- Monthly cashflow
- —
- DSCR
- —
- Eligible?
- —
Personal DTI + credit; lowest rate.
DSCR
20% down · 8.5% · 30yr
- Down + closing
- —
- Monthly P&I
- —
- Monthly cashflow
- —
- DSCR
- —
- Eligible?
- —
No personal income docs; deal must DSCR.
Hard money
10% down · 12.0% · 12mo
- Down + closing
- —
- Monthly P&I
- —
- Monthly cashflow
- —
- DSCR
- —
- Eligible?
- —
Short-term bridge; refi at stabilization.
Rent comps 2 comps
| Address | Beds | Baths | Sqft | Rent | $/sqft | DOM | Units | Dist |
|---|---|---|---|---|---|---|---|---|
| 15019 Ashton Meadows Dr New Caney, TX | 3.0 | 2.0 | 1501 | $1,790 | $1.19 | 25d | 1 | 0.71mi |
| 14255 Timber Fields Way New Caney, TX | 3.0–4.0 | 2.0–2.5 | 1797 | $1,622 | $0.90 | 6d | 57 | 1.19mi |
HOA detail
- Monthly dues
- $192 · $2,304/yr
Listing history 5 events
-
2026-06-02days on market $192,990 Active 25 DOM
-
2026-06-01days on market $192,990 Active 24 DOM
-
2026-05-31days on market $192,990 Active 23 DOM
-
2026-05-08price $196,240 520-char remark
-
2026-05-08$232,990 Active 520-char remark
ⓘ Source: listings_history table (triggers on properties + properties_extension) + one-shot
backfill from property_details.listing_events for pre-trigger history.
Nearby sold comps map
Loading sold comps map…
Walkable amenities ~0.75 mi
Loading nearby amenities…
Taxation est. · year 1
- Rental income
- $22,858
- − Mortgage interest
- −$10,810
- − Property taxes
- −$2,895
- − Insurance
- −$965
- − Repairs & maintenance
- −$1,829
- − Management
- −$1,829
- − HOA
- −$2,304
- − Depreciation
- −$5,614
- Taxable loss
- −$3,388
- Est. tax savings @ 24.0%
- +$813
- After-tax cash flow
- $562/yr
For passive investors: Depreciation is non-cash, so a rental often shows a tax loss while cash-flowing — sheltering income. Rental losses are passive: they offset passive income freely, and up to $25,000/yr can offset ordinary (W-2) income if you actively participate and your MAGI is under $100k (phasing out to $0 by $150k); unused losses carry forward. On sale, claimed depreciation is recaptured at up to 25%, and gains may owe capital-gains tax (a 1031 exchange can defer both). Figures are a year-1 estimate at your 24.0% rate — not tax advice; consult a CPA.
Condition & rehab AI · 27 photos
This home is in excellent condition with a modern and well-maintained interior and exterior. It is move-in ready and would benefit from minor updates to enhance its curb appeal and smart home features.
Value-add opportunities
- Resale Painting the exterior brick facade — Enhances curb appeal and can increase the home's value.
- Resale Landscaping the front yard — Improves curb appeal and can increase the home's value.
- Both Installing smart home features — Enhances convenience and can increase both resale and rental value.
- Resale Upgrading the kitchen appliances — Modernizes the kitchen and can increase the home's value.
- Rental Adding a smart thermostat — Improves energy efficiency and can attract renters looking for smart home features.
Renovation cost estimate screening
Value-add ROI direction
- Resale Painting the exterior brick facade — Enhances curb appeal and can increase the home's value. ↑
- Resale Landscaping the front yard — Improves curb appeal and can increase the home's value. ↑
- Both Installing smart home features — Enhances convenience and can increase both resale and rental value. ↑
- Resale Upgrading the kitchen appliances — Modernizes the kitchen and can increase the home's value. ↑
- Rental Adding a smart thermostat — Improves energy efficiency and can attract renters looking for smart home features. ↑
ⓘ Cost ranges are severity-bucket heuristics (US national rule-of-thumb). Get contractor quotes + a written scope before underwriting a rehab budget.
Schools (NCES district)
- District
- Splendora ISD
- NCES district ID
- 4841070
- Math proficiency
- 25% ▼ -8.00%
- Reading proficiency
- 31% ▼ -1.00%
- Median HH income
- $54,166
- Composite
- 24.92/100
- National rank
- #7572
- State rank
- #648 of 826 in TX
Livability — Cleveland
- Score
- 61/100
- State rank
- #1013
- US rank
- #17943
Category grades
Schools grade is shown separately in the Schools card above.
Census & demographics
- County
- Liberty County · 82,189 people
- City population
- 17,208
- Metro
- Houston-The Woodlands-Sugar Land, TX
- Population (ZIP)
- 42,685
- Household income
- $62,219
- Rent vs Own
- Severe rent burden
- 437.0
Population outlook (Montgomery County) Hauer SSP2
- Today (2025)
- 713,896 people
- By 2030
- 805,263 · +12.8%
- By 2040
- 992,708 · +39.1%
- By 2050
- 1,179,590 · +65.2%
- By 2075
- 1,628,084 · +128.1%
- By 2100
- 1,937,880 · +171.5%
Race, ethnicity, and origin ACS 2023
- Neighborhood character
- Diverse neighborhood (Simpson 0.57)
- Race & ethnicity
- Hispanic / Latino 54% White 36% Two or more races 18% Black 8% Native American 2%
- Hispanic origin (detail)
- Mexican 42%
- Common ancestry
- Lithuanian 2% Serbian 1% Slovak 0%
- Foreign-born
- 22% · Canada
- Languages at home
- 51% English-only · Spanish 48%
Political lean MEDSL · Montgomery
- 2024 margin
- Solid R (+45.5) · D 26.8% · R 72.3%
- 2008→2024 swing
- +7.2pp toward D · 2008: -52.7pp · 2024: -45.5pp
- All cycles
- 2024: R+45.5 2020: R+43.8 2016: R+51.4 2012: R+60.7 2008: R+52.7
Not yet ingested
- Civics
- —
Market trends
- HPI YoY
- ▼ -12.39%
- Current HPI
- 224.9222
- Rent YoY
- ▲ 4.00%
- Metro
- Houston-The Woodlands-Sugar Land, TX
- State GDP YoY
- ▲ 3.95%
- F500 in state
- 110
Industry mix (Fortune 500 HQ in TX)
| Industry | F500 HQs | Revenue |
|---|---|---|
| Energy | 16 | $1,198B |
|
||
| Technology | 5 | $198B |
|
||
| Engineering / Construction | 4 | $72B |
|
||
| Energy Services | 3 | $60B |
|
||
| Utilities | 3 | $41B |
|
||
| Healthcare | 2 | $330B |
|
||
Price history
-17.2% since first listed4 events — show timeline
- 2026-06-02 Listing Removed — HARMLS
- 2026-05-28 Price Changed $192,990 HARMLS
- 2026-05-08 Price Changed $196,240 HARMLS
- 2026-05-08 Listed $232,990 HARMLS
Cash-flow waterfall
monthlySold comps — $/sqft
last 12 mo · ≤1 miLoading sold comps…