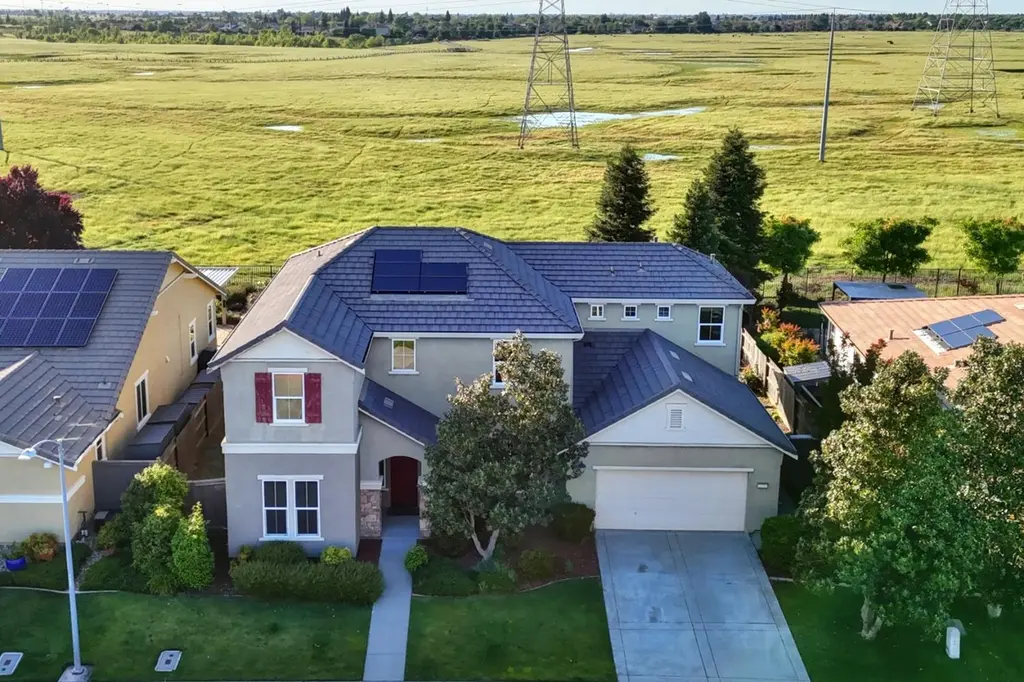
12011 Quail Falls Way · Rancho Cordova, CA
Flood risk 1/10 · Minimal
- FEMA flood zone
- X (unshaded)
- Chance of flooding over 30 yrs
- 0.0%
- Est. flood insurance / yr
- $507 – $1,088
Fire risk 7/10 · Major
- Est. fire insurance / yr
- $659 – $1,223
Heat risk 8/10 · Major
- Hot days now (above 102°F)
- 7 days/yr
- Hot days in 30 yrs
- 16 days/yr
Wind risk 1/10 · Minimal
- Chance of severe wind over 30 yrs
- —
Air-quality risk 10/10 · Severe
- Unhealthy air days now
- 32 days/yr
- Unhealthy air days in 30 yrs
- 36 days/yr
Risk factors via First Street. Map © Google.
Why this score? — see what drove the D- grade
The composite is a weighted blend of 9 inputs, each scored 0–100. Each bar is that input's sub-score; the figure is the points it added to the 100-point composite (weight × sub-score).
- ARV discount +11.9/15.0
- Appreciation +10.0/10.0
- Schools +4.1/10.0
- Cash flow +4.0/30.0
- Livability +3.4/5.0
- Rent growth +3.0/5.0
- Condition / age +2.5/5.0
- 1% rule +0.0/10.0
- DSCR +0.0/10.0
$675,000
🖨 Deal sheet 📄 Offer letter ✓ Due diligence
Listing remarks
Greenbelt-backed gem in sought-after Kavala Ranch with OWNED SOLAR! POSSIBLY VA loan assumption at 2.75% (~$400,000)This well-maintained 4 bedroom, 3 bath home offers nearly 3,000 sq ft of thoughtfully designed living space on a generous 9,147 sq ft lot. A desirable downstairs bedroom and full bath provide the perfect setup for guests, in-laws, or multigenerational living no stairs required. The open-concept floor plan creates seamless flow between the kitchen, dining, and living areas, while a versatile upstairs loft adds flexible space perfect for a home office, playroom, or media room. The kitchen opens directly to the main living space, maximizing functionality and natural light throu
Key facts
- Full bath
- Large covered patio
- Downstairs bedroom
Tags
Neighborhood map
What this means for you Summary
Snapshot
- This is a 4-bed/3.0-bath single-family listed at $675k.
Deal economics
- At list price, monthly cash flow is $-2k ($-23k/yr) — negative.
- To cash-flow at today's rent, offer at most $339k (49.7% below list).
- To meet the 1% rule (rent ≥ 1% of price), the offer needs to be $330k (51.1% below list).
- Recommended offer: $330k (51.1% below list) — sets the bar for 1% rule.
Location & tenants
- Location reads 68/100 on livability (#268 in CA) — a middle-class / working-renter tenant base. Strengths: housing A+, employment B; Watch: schools C-, commute C-, crime D.
- Elk Grove Unified (suburban): math 40% / reading 51% proficiency, ranked #165 of 517 in CA (top 32%) — families likely to look elsewhere, expect single-tenant / working-renter base with shorter leases.
- Market conditions: Rents rising (+2.1%/yr); 466 active listings in the ZIP; 6 comparable units currently listed for rent nearby; rentals lingering (median 44d on market — plan ~5-8 weeks vacancy on turnover, expect pricing pressure); 50% of comp listings sitting > 30 days — soft ceiling on asking rent; high-income renter base; 6,825 units permitted in Sacramento County in 2024 (1,752 in 5+ unit buildings).
Forward outlook
- In year one you build about $72k of equity ($5k loan paydown + $68k appreciation (10.0% local appreciation)).
- Sacramento County population projected at +17% by 2050 — long-run rental-demand tailwind backs the buy-and-hold thesis.
- By year 2, paydown + projected appreciation supports a ~$116k cash-out refi (75% LTV) — recoverable capital for the next deal without selling this one.
Negotiation context
- It's been on market 29 days — a 2% lower offer ($665k) is reasonable based on typical stale-listing flexibility.
Risks & watch-outs
- Climate carrying-cost: major wildfire risk; extreme-heat days projected 7→16/yr by 2055 (HVAC capex compounding) — expect insurance premiums to compound above CPI over the hold.
Questions for the listing agent
- What do current leases actually rent for vs. the listed asking? Can we see a recent rent roll and the last 12 months of T-12 income?
- Is there a deadline driving the sale (1031 exchange, divorce, estate, relocation)? That informs how much negotiation room exists.
- Crime grade is D in this area — have there been break-ins, vandalism, or insurance claims at this property in the last 3 years? What carrier currently insures it and at what premium?
- The area grade is low — what's the realistic commute time and amenity access for the typical tenant pool here? Any planned neighborhood developments (good or bad) we should know about?
- What's the average days-on-market for RENTAL listings here right now (not sales)? A rising rental-DOM trend means longer vacancies and softer asking-rent achievability than the comps imply.
- What's the recent tenant-quality profile in this submarket — average credit score on applications, eviction rate, late-payment / NSF rate, and stable-employment percentage? A property-management company in the area should have these aggregated.
- How much new for-sale + rental construction is in the pipeline within 1–3 miles? Heavy new supply typically softens prices + rents 12–24 months out; constrained supply supports both.
Investment metrics
- 1% rule
- 0.49% ✗
- Cap rate
- 2.91%
- Cash-on-cash
- -12.07%
- DSCR
- 0.46
- GRM
- 17.0
CMA / ARV
- ARV (median comp)
- $747,251
- List price
- $675,000
- Delta
- -9.67%
- Verdict
- FAIR
- Comps
- 20 within 1.0 mi
Show comp detail 12 sales within ~0.75 mi
| Address | Dist | Beds/Ba | Sqft | Sold | Price | $/sf | Match |
|---|---|---|---|---|---|---|---|
| 4821 Heather Ranch Way | 0.14mi | 5/3.0 (+1) | 2,935 (-2%) | 1mo | $785,000 | $267 | 85 |
| 5010 Heather Ranch Way | 0.15mi | 5/3.0 (+1) | 2,935 (-2%) | 5mo | $685,000 | $233 | 82 |
| 5021 Birch Valley Way | 0.24mi | 4/3.0 | 2,885 (-3%) | 5mo | $635,888 | $220 | 79 |
| 12054 Quail Falls Way | 0.13mi | 4/2.5 | 2,768 (-7%) | 13mo | $640,000 | $231 | 69 |
| 5228 Mossy Stone Way | 0.38mi | 4/2.5 | 2,817 (-6%) | 6mo | $640,000 | $227 | 66 |
| 5501 Jade Springs Way | 0.55mi | 5/4.0 (+1) | 2,980 (-0%) | 0mo | $725,000 | $243 | 65 |
| 5394 Otter Pond Way | 0.36mi | 5/3.0 (+1) | 3,105 (+4%) | 9mo | $760,000 | $245 | 64 |
| 5345 Dusty Rose Way | 0.35mi | 5/2.5 (+1) | 2,785 (-7%) | 4mo | $629,900 | $226 | 63 |
| 5557 Copper Sunset Way | 0.48mi | 5/4.0 (+1) | 2,980 (-0%) | 11mo | $672,500 | $226 | 59 |
| 12088 Runswick Ct | 0.47mi | 3/2.5 (-1) | 2,817 (-6%) | 4mo | $700,000 | $248 | 59 |
| 5204 Azalea Park Way | 0.36mi | 4/3.0 | 2,650 (-11%) | 11mo | $724,000 | $273 | 56 |
| 4811 Copper Sunset Way | 0.24mi | 5/3.0 (+1) | 2,567 (-14%) | 10mo | $620,000 | $242 | 52 |
Match score weights: distance 35% · size 25% · config 20% · recency 20%. Top-matched comps best support the ARV.
Projected returns pro-forma
10.0% appreciation · 2.08% rent growth · sell at horizon
- IRR
- 15.7%
- Equity multiple
- 2.29×
- Total profit
- $243,480
- Equity at exit
- $608,093
- IRR
- 15.0%
- Equity multiple
- 5.27×
- Total profit
- $806,206
- Equity at exit
- $1,311,377
Cash invested: $189,000 (down + closing). Projections, not guarantees.
Landlord ↔ Tenant lean methodology
- Overall (STATE)
- 18 Strongly Tenant-Friendly
- State California
- 18 Strongly Tenant-Friendly · D+13
- County
- — inherits STATE
- City
- — inherits STATE
ZIP-level market 95742
- Home prices YoY
- 28.3%
- Rents YoY
- 2.1%
- Active inventory
- 466
- Price-to-rent
- 17.0×
Monthly cashflow live
- Estimated rent
- $3,302 high interval (Pro) →
- Mortgage (P&I)
- −$3,540
- Tax from tax record
- −$689 /mo · $8,263/yr
- Insurance
- −$281
- HOA
- −$0
- Vacancy / Maint / Mgmt
- −$693
- Net cashflow
- $-1,901
Break-even live
UW: 25.0% down · 7.5% · 30yr · 1.5% tax · 5.0% vac · 8.0% maint · 8.0% mgmt
Financing live
Cash to close
- Down payment
- $168,750
- Closing costs
- $20,250
- Reserves months
- —
- Total cash needed
- —
Loan-product check · same deal, 3 products live
Conventional
25% down · 7.5% · 30yr
- Down + closing
- —
- Monthly P&I
- —
- Monthly cashflow
- —
- DSCR
- —
- Eligible?
- —
Personal DTI + credit; lowest rate.
DSCR
20% down · 8.5% · 30yr
- Down + closing
- —
- Monthly P&I
- —
- Monthly cashflow
- —
- DSCR
- —
- Eligible?
- —
No personal income docs; deal must DSCR.
Hard money
10% down · 12.0% · 12mo
- Down + closing
- —
- Monthly P&I
- —
- Monthly cashflow
- —
- DSCR
- —
- Eligible?
- —
Short-term bridge; refi at stabilization.
Rent comps 6 comps
| Address | Beds | Baths | Sqft | Rent | $/sqft | DOM | Units | Dist |
|---|---|---|---|---|---|---|---|---|
| 11965 Pericles Dr Rancho Cordova, CA | 4.0 | 3.0 | 2580 | $2,900 | $1.12 | 43d | 1 | 0.78mi |
| 11832 Stoney Ridge Way Rancho Cordova, CA | 4.0 | 2.5 | 2019 | $2,695 | $1.33 | 10d | 1 | 0.93mi |
| 4223 Anatolia Dr Rancho Cordova, CA | 5.0 | 3.5 | 2876 | $2,500 | $0.87 | 23d | 1 | 1.21mi |
| 4221 Anatolia Dr Rancho Cordova, CA | 5.0 | 3.5 | 2763 | $3,195 | $1.16 | 7d | 1 | 1.22mi |
| 11925 Cobblebrook Dr Rancho Cordova, CA | 4.0 | 3.0 | 2786 | $3,595 | $1.29 | 43d | 1 | 1.39mi |
| 4480 Arctic Tern Way Rancho Cordova, CA | 4.0 | 2.5 | 2550 | $3,000 | $1.18 | 43d | 1 | 1.47mi |
Listing history 3 events
-
2026-02-05Active
-
2010-12-30soldstatus $2,441,000
-
2009-11-30soldstatus $1,952,500
ⓘ Source: listings_history table (triggers on properties + properties_extension) + one-shot
backfill from property_details.listing_events for pre-trigger history.
Tax reassessment forecast CA · Resets to sale price
- Current annual tax
- $8,263 · $689/mo
- Projected year-2 tax
- $8,263 · $689/mo
- Expected delta
- $0/yr ($0/mo · 0.0%)
ⓘ Screening estimate from a state-policy table — verify with the county assessor before closing.
Climate risk First Street
- Flood 1/10 Low FEMA zone X (unshaded) · 0% chance over 30 yrs
- Wildfire 7/10 Severe
- Heat 8/10 Severe 7 d/yr ≥102°F today · 16 d/yr by 30 yrs out
- Wind 1/10 Low
- Air quality 10/10 Extreme 32 unhealthy d/yr today · 36 by 30 yrs out
Nearby sold comps map
Loading sold comps map…
Walkable amenities ~0.75 mi
Loading nearby amenities…
Taxation est. · year 1
- Rental income
- $39,626
- − Mortgage interest
- −$37,810
- − Property taxes
- −$8,263
- − Insurance
- −$3,375
- − Repairs & maintenance
- −$3,170
- − Management
- −$3,170
- − Depreciation
- −$19,636
- Taxable loss
- −$35,799
- Est. tax savings @ 24.0%
- +$8,592
- After-tax cash flow
- $-14,219/yr
For passive investors: Depreciation is non-cash, so a rental often shows a tax loss while cash-flowing — sheltering income. Rental losses are passive: they offset passive income freely, and up to $25,000/yr can offset ordinary (W-2) income if you actively participate and your MAGI is under $100k (phasing out to $0 by $150k); unused losses carry forward. On sale, claimed depreciation is recaptured at up to 25%, and gains may owe capital-gains tax (a 1031 exchange can defer both). Figures are a year-1 estimate at your 24.0% rate — not tax advice; consult a CPA.
Schools (NCES district)
- District
- Elk Grove Unified
- NCES district ID
- 0612330
- Math proficiency
- 40% ▼ -5.00%
- Reading proficiency
- 51% ▼ -5.00%
- Median HH income
- $67,860
- Composite
- 40.72/100
- National rank
- #3658
- State rank
- #165 of 517 in CA
Livability — Rancho Cordova
- Score
- 68/100
- State rank
- #268
- US rank
- #9126
Category grades
Schools grade is shown separately in the Schools card above.
Census & demographics
- Census place
- Rancho Cordova, CA
- County
- Sacramento County · 1,539,646 people
- City population
- 98,329
- Metro
- Sacramento-Roseville-Folsom, CA
- Population (ZIP)
- 17,768
- Household income
- $155,855
- Rent vs Own
- Severe rent burden
- 172.0
Population outlook (Sacramento County) Hauer SSP2
- Today (2025)
- 1,660,763 people
- By 2030
- 1,732,990 · +4.3%
- By 2040
- 1,855,755 · +11.7%
- By 2050
- 1,941,335 · +16.9%
- By 2075
- 2,046,162 · +23.2%
- By 2100
- 1,961,444 · +18.1%
Race, ethnicity, and origin ACS 2023
- Neighborhood character
- Highly diverse neighborhood (Simpson 0.72)
- Race & ethnicity
- White 42% Asian 28% Hispanic / Latino 15% Two or more races 13% Black 7%
- Hispanic origin (detail)
- Mexican 11% Puerto Rican 1%
- Common ancestry
- Italian 3% Slovak 2% Subsaharan African 2%
- Foreign-born
- 25% · China, South Korea, Canada
- Languages at home
- 67% English-only · Other Asian/Pacific 7% Other Indo-European 7% Tagalog/Filipino 5%
Political lean MEDSL · Sacramento
- 2024 margin
- D (+19.7) · D 58.1% · R 38.4% · Other 3.5%
- 2008→2024 swing
- +0.7pp no change · 2008: 19.0pp · 2024: 19.7pp
- All cycles
- 2024: D+19.7 2020: D+25.3 2016: D+23.7 2012: D+16.3 2008: D+19.0
Not yet ingested
- Civics
- —
Market trends
- HPI YoY
- ▲ 52.05%
- Current HPI
- 236.1388
- Rent YoY
- ▲ 2.08%
- Metro
- Sacramento-Roseville-Folsom, CA
- State GDP YoY
- ▲ 3.21%
- F500 in state
- 116
Industry mix (Fortune 500 HQ in CA)
| Industry | F500 HQs | Revenue |
|---|---|---|
| Technology | 27 | $1,492B |
|
||
| Financial Services | 3 | $174B |
|
||
| Retail | 3 | $44B |
|
||
| Insurance | 3 | $26B |
|
||
| Media / Entertainment | 2 | $115B |
|
||
| Pharmaceuticals / Biotech | 2 | $62B |
|
||
Price history
+25.0% since first listed3 events — show timeline
- 2026-02-05 Listed — TheMLS
- 2010-12-30 Sold (Public Records) $2,441,000 Public Records
- 2009-11-30 Sold (Public Records) $1,952,500 Public Records
Property tax history
+6.4%/yrLatest (2025): $8,263 · +1.8% YoY. Source: county tax records.
Cash-flow waterfall
monthlySold comps — $/sqft
last 12 mo · ≤1 miLoading sold comps…