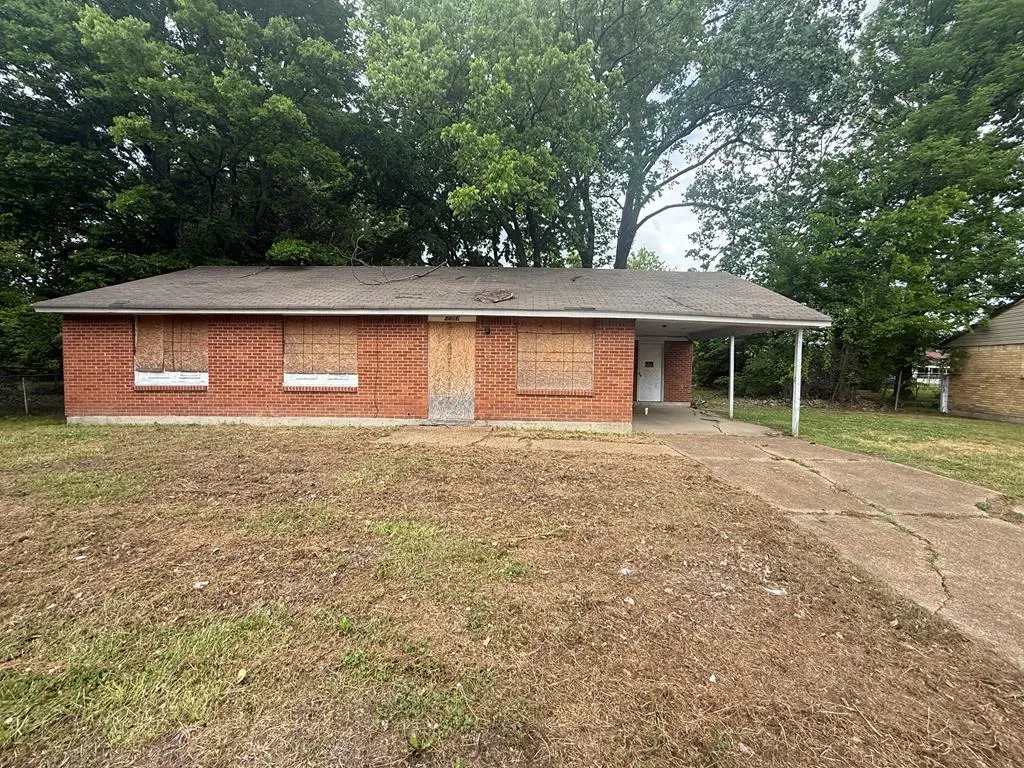
2406 N Gathings Dr · West Memphis, AR
Flood risk No data
- FEMA flood zone
- —
- Chance of flooding over 30 yrs
- —
- Est. flood insurance / yr
- —
Fire risk No data
- Est. fire insurance / yr
- —
Heat risk No data
- Hot days now (above threshold)
- —
- Hot days in 30 yrs
- —
Wind risk No data
- Chance of severe wind over 30 yrs
- —
Air-quality risk No data
- Unhealthy air days now
- —
- Unhealthy air days in 30 yrs
- —
Risk factors via First Street. Map © Google.
Why this score? — see what drove the B- grade
The composite is a weighted blend of 9 inputs, each scored 0–100. Each bar is that input's sub-score; the figure is the points it added to the 100-point composite (weight × sub-score).
- Cash flow +30.0/30.0
- 1% rule +10.0/10.0
- DSCR +10.0/10.0
- ARV discount +7.5/15.0
- Livability +2.8/5.0
- Rent growth +2.5/5.0
- Condition / age +2.5/5.0
- Schools +1.2/10.0
- Appreciation +0.0/10.0
$45,900
🖨 Deal sheet 📄 Offer letter ✓ Due diligence
Listing remarks
investor special --3 Bedroom 1.5 bath great investment property
Key facts
- 0.35 acre lot
- Garage
- Built 1961
Property features AI
Exterior
- Parking: 1 parking space total; 1 covered space; Attached carport; Has garage (1 garage space); Has carport (1 carport space)
- Utilities: Public water; Public sewer
- Home design: Residential property; One story; Fixer condition
- Construction: Brick construction; Slab foundation; Built with composition roofing
- Exterior features: Composition roof; No listed exterior amenities; No listed patio or porch features
Interior
- Flooring: Hardwood
- Bathrooms: 1 full bathroom; 1 half bathroom
- Heating & cooling: No heating; No cooling
- Interior features: Gas water heater; Hardwood floors; No basement
Neighborhood map
What this means for you Summary
Snapshot
- This is a 3-bed/1.5-bath single-family listed at $46k.
Deal economics
- At list price, monthly cash flow is $710 ($9k/yr) — positive.
- The deal already cash-flows at list — no discount required.
- Meets the 1% rule at list price ($1k rent vs $46k).
- Recommended offer: $45k (1.5% below list) — sets the bar for market timing.
- Cap rate 24.8% vs local median 7.0% in West Memphis — top-decile yield for the area; either an underpriced asset or a hidden risk that comps aren't pricing in. Stress-test before assuming the spread holds.
Location & tenants
- Location reads 55/100 on livability (#413 in AR) — a working-class tenant base; expect higher turnover. Strengths: cost of living A+, housing A; Watch: schools D-, crime F, amenities F.
- West Memphis School District (suburban): math 16% / reading 15% proficiency, ranked #224 of 238 in AR (top 94%) — low school quality limits family demand, transient renter base, plan for 1-2y turnover; 96% free/reduced lunch — lower-income household profile, screen leases tightly.
- Market conditions: 108 active listings in the ZIP; 12 comparable units currently listed for rent nearby; rentals at typical pace (median 16d on market — plan ~3-4 weeks tenant-placement turnaround); 42% of comp listings sitting > 30 days — soft ceiling on asking rent; 69 units permitted in Crittenden County in 2024 (0 in 5+ unit buildings).
Forward outlook
- Local home prices are declining (-3.0%/yr); year-one equity from $317 of loan paydown is wiped out by about $1k of value loss. Plan a longer hold.
- Crittenden County population projected at -26% by 2050 — secular population decline; favor cash flow + early exit over multi-decade hold.
- At projected returns (-3.0% appreciation + 3.0% rent growth), your $13k cash investment doubles in ~2 years — after that, you're playing with house money.
Negotiation context
- It's been on market 22 days — a 2% lower offer ($45k) is reasonable based on typical stale-listing flexibility.
Questions for the listing agent
- Built in 1961 — when were the roof, HVAC, electrical panel, plumbing, and water heater last replaced?
- Is there a deadline driving the sale (1031 exchange, divorce, estate, relocation)? That informs how much negotiation room exists.
- Schools are D-rated, which usually means shorter tenancies and higher turnover. Who's the typical renter profile here, and what's been the actual vacancy rate?
- Crime grade is F in this area — have there been break-ins, vandalism, or insurance claims at this property in the last 3 years? What carrier currently insures it and at what premium?
- What's the average days-on-market for RENTAL listings here right now (not sales)? A rising rental-DOM trend means longer vacancies and softer asking-rent achievability than the comps imply.
- What's the recent tenant-quality profile in this submarket — average credit score on applications, eviction rate, late-payment / NSF rate, and stable-employment percentage? A property-management company in the area should have these aggregated.
- How much new for-sale + rental construction is in the pipeline within 1–3 miles? Heavy new supply typically softens prices + rents 12–24 months out; constrained supply supports both.
Investment metrics
- 1% rule
- 2.73% ✓
- Cap rate
- 24.84%
- Cash-on-cash
- 66.25%
- DSCR
- 3.95
- GRM
- 3.1
CMA / ARV
- ARV (median comp)
- $94,790
- List price
- $45,900
- Delta
- -51.58%
- Verdict
- UNDERPRICED
- Comps
- 20 within 1.0 mi
Show comp detail 12 sales within ~0.75 mi
| Address | Dist | Beds/Ba | Sqft | Sold | Price | $/sf | Match |
|---|---|---|---|---|---|---|---|
| 2413 Gathings Dr | 0.11mi | 3/1.0 | 1,040 (-3%) | 4mo | $27,000 | $26 | 84 |
| 2692 Beatty St | 0.23mi | 3/1.0 | 1,053 (-2%) | 3mo | $137,000 | $130 | 82 |
| 2904 Beatty St | 0.36mi | 3/1.5 | 1,000 (-7%) | 6mo | $136,000 | $136 | 67 |
| — | 0.28mi | 3/1.0 | 1,153 (+7%) | 10mo | $8,000 | $7 | 65 |
| 516 N 28th St | 0.31mi | 3/1.0 | 1,014 (-6%) | 11mo | $39,000 | $38 | 65 |
| 518 N 16th St | 0.60mi | 3/2.0 | 1,092 (+2%) | 4mo | $55,000 | $50 | 64 |
| 601 N 28th St | 0.35mi | 3/1.0 | 951 (-12%) | 4mo | $125,000 | $131 | 59 |
| 601 Ingram Blvd | 0.20mi | 3/2.0 | 1,215 (+13%) | 14mo | $150,000 | $123 | 55 |
| 1909 Sula Ln | 0.42mi | 3/1.0 | 1,200 (+12%) | 9mo | $52,000 | $43 | 52 |
| 2919 Beatty St | 0.45mi | 3/1.0 | 936 (-13%) | 5mo | $16,000 | $17 | 51 |
| 1823 Goodwin Ave | 0.53mi | 4/2.0 (+1) | 1,187 (+10%) | 4mo | $150,000 | $126 | 48 |
| 3407 Beatty St | 0.72mi | 3/1.0 | 1,040 (-3%) | 15mo | $80,000 | $77 | 47 |
Match score weights: distance 35% · size 25% · config 20% · recency 20%. Top-matched comps best support the ARV.
Projected returns pro-forma
-3.0% appreciation · 3.0% rent growth · sell at horizon
- IRR
- 65.5%
- Equity multiple
- 3.94×
- Total profit
- $37,746
- Equity at exit
- $6,844
- IRR
- 69.8%
- Equity multiple
- 8.08×
- Total profit
- $91,037
- Equity at exit
- $3,969
Cash invested: $12,852 (down + closing). Projections, not guarantees.
Landlord ↔ Tenant lean methodology
- Overall (STATE)
- 92 Strongly Landlord-Friendly
- State Arkansas
- 92 Strongly Landlord-Friendly · R+14
- County
- — inherits STATE
- City
- — inherits STATE
ZIP-level market 72364
- Home prices YoY
- -13.3%
- Active inventory
- 108
- Price-to-rent
- 3.1×
Monthly cashflow live
- Estimated rent
- $1,251 high interval (Pro) →
- Mortgage (P&I)
- −$241
- Tax from tax record
- −$19 /mo · $228/yr
- Insurance
- −$19
- HOA
- −$0
- Vacancy / Maint / Mgmt
- −$263
- Net cashflow
- $710
Break-even live
UW: 25.0% down · 7.5% · 30yr · 1.5% tax · 5.0% vac · 8.0% maint · 8.0% mgmt
Financing live
Cash to close
- Down payment
- $11,475
- Closing costs
- $1,377
- Reserves months
- —
- Total cash needed
- —
Loan-product check · same deal, 3 products live
Conventional
25% down · 7.5% · 30yr
- Down + closing
- —
- Monthly P&I
- —
- Monthly cashflow
- —
- DSCR
- —
- Eligible?
- —
Personal DTI + credit; lowest rate.
DSCR
20% down · 8.5% · 30yr
- Down + closing
- —
- Monthly P&I
- —
- Monthly cashflow
- —
- DSCR
- —
- Eligible?
- —
No personal income docs; deal must DSCR.
Hard money
10% down · 12.0% · 12mo
- Down + closing
- —
- Monthly P&I
- —
- Monthly cashflow
- —
- DSCR
- —
- Eligible?
- —
Short-term bridge; refi at stabilization.
Rent comps 12 comps
| Address | Beds | Baths | Sqft | Rent | $/sqft | DOM | Units | Dist |
|---|---|---|---|---|---|---|---|---|
| 2400 Goodwin Ave West Memphis, AR | 2.0 | 1.5 | 1100 | $775 | $0.70 | 43d | 1 | 0.25mi |
| 2401 Wheeler Ave West Memphis, AR | 2.0 | 1.0 | 1000 | $750 | $0.75 | 43d | 1 | 0.31mi |
| 2504 Tyler Cir West Memphis, AR | 3.0 | 2.0 | 1250 | $1,450 | $1.16 | 1d | 1 | 0.47mi |
| 741 N 18th St West Memphis, AR | 2.0 | 1.0 | 814 | $940 | $1.15 | 4d | 1 | 0.52mi |
| 2502 E Tyler Ave West Memphis, AR | 3.0 | 2.0 | 1250 | $1,550 | $1.24 | 43d | 1 | 0.53mi |
| 2506 E Tyler Ave West Memphis, AR | 3.0 | 2.0 | 1250 | $1,450 | $1.16 | 16d | 1 | 0.53mi |
| 307 Westree St West Memphis, AR | 3.0 | 2.0 | 1220 | $1,550 | $1.27 | 10d | 1 | 0.56mi |
| 2501 E Tyler Ave West Memphis, AR | 3.0 | 2.0 | 1220 | $1,500 | $1.23 | 43d | 1 | 0.56mi |
| 309 Westree St West Memphis, AR | 3.0 | 2.0 | 1220 | $1,550 | $1.27 | 1d | 1 | 0.56mi |
| 310 Chestnut St West Memphis, AR | 3.0 | 2.0 | 1250 | $1,350 | $1.08 | 1d | 1 | 0.60mi |
| 316 Chestnut St West Memphis, AR | 3.0 | 2.0 | 1250 | $1,450 | $1.16 | 43d | 1 | 0.63mi |
| 1398 E Barton Ave West Memphis, AR | 3.0 | 2.0 | 1250 | $1,550 | $1.24 | 10d | 1 | 0.75mi |
Listing history 3 events
-
2026-05-15status Pending 64-char remark
-
2026-04-24price $45,900 64-char remark
-
2026-04-24$459,000 Active 64-char remark
ⓘ Source: listings_history table (triggers on properties + properties_extension) + one-shot
backfill from property_details.listing_events for pre-trigger history.
Tax reassessment forecast AR · Resets to sale price
- Current annual tax
- $228 · $19/mo
- Projected year-2 tax
- $294 · $24/mo
- Expected delta
- +$66/yr (+$6/mo · 29.1%)
ⓘ Screening estimate from a state-policy table — verify with the county assessor before closing.
Nearby sold comps map
Loading sold comps map…
Walkable amenities ~0.75 mi
Loading nearby amenities…
Taxation est. · year 1
- Rental income
- $15,012
- − Mortgage interest
- −$2,571
- − Property taxes
- −$228
- − Insurance
- −$230
- − Repairs & maintenance
- −$1,201
- − Management
- −$1,201
- − Depreciation
- −$1,335
- Taxable income
- $8,247
- Est. tax owed @ 24.0%
- −$1,979
- After-tax cash flow
- $6,535/yr
For passive investors: Depreciation is non-cash, so a rental often shows a tax loss while cash-flowing — sheltering income. Rental losses are passive: they offset passive income freely, and up to $25,000/yr can offset ordinary (W-2) income if you actively participate and your MAGI is under $100k (phasing out to $0 by $150k); unused losses carry forward. On sale, claimed depreciation is recaptured at up to 25%, and gains may owe capital-gains tax (a 1031 exchange can defer both). Figures are a year-1 estimate at your 24.0% rate — not tax advice; consult a CPA.
Schools (NCES district)
- District
- West Memphis School District
- NCES district ID
- 0508040
- Math proficiency
- 16% ▼ -14.00%
- Reading proficiency
- 15% ▼ -14.00%
- Median HH income
- $29,382
- Composite
- 12.22/100
- National rank
- #9647
- State rank
- #224 of 238 in AR
Livability — West Memphis
- Score
- 55/100
- State rank
- #413
- US rank
- #23638
Category grades
Schools grade is shown separately in the Schools card above.
Census & demographics
- Census place
- West Memphis, AR
- County
- Crittenden County · 16,034 people
- City population
- 24,182
- Metro
- Memphis, TN-MS-AR
- Population (ZIP)
- 16,034
- Household income
- $74,462
- Rent vs Own
- Severe rent burden
- 319.0
Population outlook (Crittenden County) Hauer SSP2
- Today (2025)
- 45,254 people
- By 2030
- 42,953 · -5.1%
- By 2040
- 38,235 · -15.5%
- By 2050
- 33,670 · -25.6%
- By 2075
- 24,315 · -46.3%
- By 2100
- 17,173 · -62.1%
Race, ethnicity, and origin ACS 2023
- Neighborhood character
- Diverse neighborhood (Simpson 0.61)
- Race & ethnicity
- White 51% Black 35% Two or more races 10% Hispanic / Latino 5% Asian 1%
- Common ancestry
- Italian 2% Romanian 1% Lithuanian 1%
- Foreign-born
- 3% · Canada, Dominican Republic
- Languages at home
- 96% English-only · Spanish 3% Korean 1%
Political lean MEDSL · Crittenden
- 2024 margin
- Toss-up / Even · D 50.1% · R 47.9% · Other 2.0%
- 2008→2024 swing
- -12.4pp toward R · 2008: 14.7pp · 2024: 2.3pp
- All cycles
- 2024: D+2.3 2020: D+7.2 2016: D+9.0 2012: D+18.7 2008: D+14.7
Not yet ingested
- Civics
- —
Market trends
- HPI YoY
- ▼ -31.64%
- Current HPI
- 205.4807
- Rent YoY
- —
- Metro
- Memphis, TN-MS-AR
- State GDP YoY
- ▲ 3.80%
- F500 in state
- 10
Industry mix (Fortune 500 HQ in AR)
| Industry | F500 HQs | Revenue |
|---|---|---|
| Retail | 1 | $681B |
|
||
| Food / Agriculture | 1 | $53B |
|
||
| Retail / Energy | 1 | $22B |
|
||
| Transportation / Logistics | 1 | $12B |
|
||
| Energy | 1 | $4B |
|
||
Price history
-90.0% since first listed3 events — show timeline
- 2026-05-15 Pending — EARA
- 2026-04-24 Price Changed $45,900 EARA
- 2026-04-24 Listed $459,000 EARA
Property tax history
-7.4%/yrLatest (2025): $228 · +9.7% YoY. Source: county tax records.
Cash-flow waterfall
monthlySold comps — $/sqft
last 12 mo · ≤1 miLoading sold comps…