1320 S Jacks Rnch · Ridgecrest Heights, CA
Flood risk 1/10 · Minimal
- FEMA flood zone
- X (unshaded)
- Chance of flooding over 30 yrs
- 0.0%
- Est. flood insurance / yr
- $507 – $1,088
Fire risk 4/10 · Minor
- Est. fire insurance / yr
- $659 – $1,223
Heat risk 8/10 · Major
- Hot days now (above 103°F)
- 8 days/yr
- Hot days in 30 yrs
- 23 days/yr
Wind risk 1/10 · Minimal
- Chance of severe wind over 30 yrs
- —
Air-quality risk 7/10 · Major
- Unhealthy air days now
- 14 days/yr
- Unhealthy air days in 30 yrs
- 15 days/yr
Risk factors via First Street. Map © Google.
Why this score? — see what drove the C- grade
The composite is a weighted blend of 9 inputs, each scored 0–100. Each bar is that input's sub-score; the figure is the points it added to the 100-point composite (weight × sub-score).
- Cash flow +20.7/30.0
- ARV discount +7.5/15.0
- DSCR +6.6/10.0
- 1% rule +4.4/10.0
- Rent growth +3.4/5.0
- Schools +2.9/10.0
- Livability +2.5/5.0
- Condition / age +2.5/5.0
- Appreciation +0.0/10.0
$130,000
🖨 Deal sheet (PDF) 📄 Offer letter ✓ Due diligence
Listing remarks
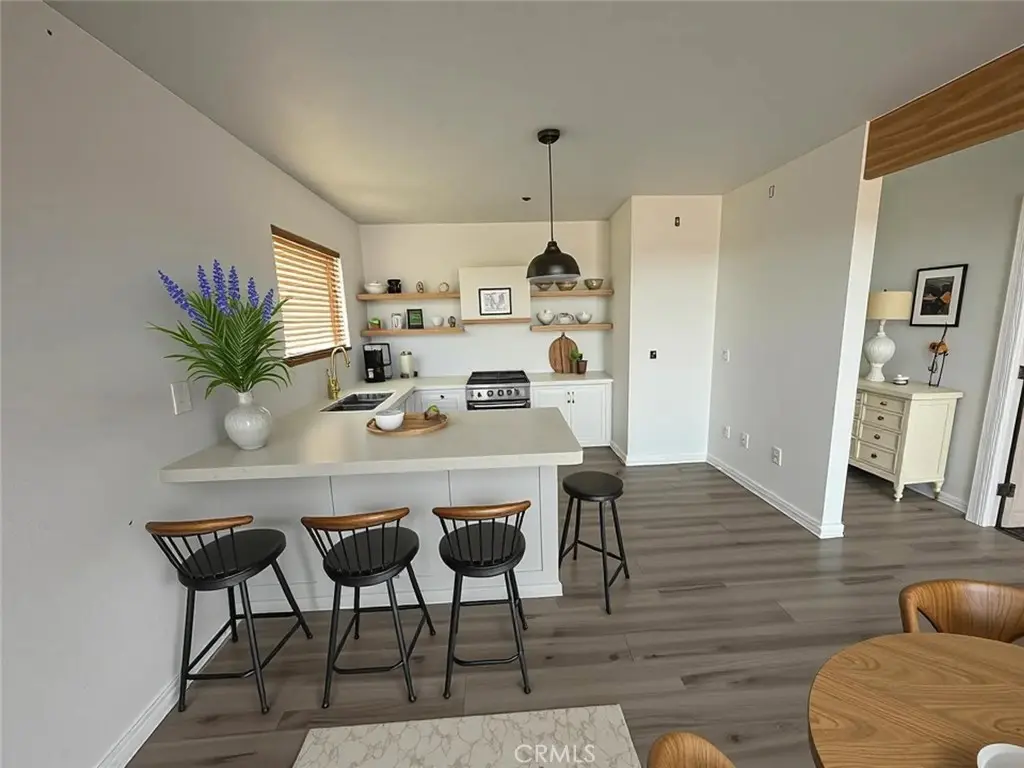
CASH-ONLY opportunity on 2 acres where peace, space, and wide-open views come together. This off-grid property offers true freedom just outside town, with stunning desert and mountain backdrops and the kind of privacy most buyers can’t find anymore. Enjoy quiet mornings, sunsets from your deck, and nights by the wood-burning stove under a sky full of stars. Inside, the home features a bright, open layout with large windows bringing in natural light, a functional kitchen with ample counter space, comfortable bedrooms, and a bonus room perfect for an office, gym, or guest space. The property runs on generator power and includes a 3,000-gallon water tank, propane stove, and fenced land w
Key facts
- 2 acre lot
- Built 1962
- Listed 47 days
Property features AI
Finance
- Other: Property condition: major and cosmetic repairs needed; Total units: 1; Accessibility: 2+ access exits; Year built: estimated
- HOA & community: Community features: horse trails, biking, hiking
Exterior
- Parking: No garage; Unpaved driveway
- Utilities: Well water; Engineered septic system; Propane available; Electricity available; Water available
- Home design: House; One story; Entry at main level; No common walls
- Construction: Composition roof; Raised permanent foundation with pillar/post/pier and concrete block; Fencing: barbed wire and chain link (good condition)
- Exterior features: Covered wood patio; Shed; Has view; 2–5 units per acre lot density; Desert front and back; Horse property; Secluded setting; Access road frontage with unpaved road
Interior
- Kitchen: Propane range
- Bedrooms: All bedrooms on main level; Main level bedrooms: 1
- Bathrooms: 1 full bathroom (main level)
- Heating & cooling: Natural gas heating
- Interior features: Beamed ceilings; Carbon monoxide detector(s); Smoke detector; Security system; Blinds
- Laundry & utility: Laundry area outside
Neighborhood map
What this means for you Summary
Snapshot
- This is a 2-bed/1.0-bath land listed at $130k.
Deal economics
- At list price, monthly cash flow is $175 ($2k/yr) — positive.
- The deal already cash-flows at list — no discount required.
- To meet the 1% rule (rent ≥ 1% of price), the offer needs to be $122k (6.0% below list).
- Recommended offer: $122k (6.0% below list) — sets the bar for 1% rule.
Location & tenants
- Location reads: area grade C — affects rentability + tenant quality, not the cash-flow math above.
- Sierra Sands Unified (town): math 25% / reading 39% proficiency, ranked #294 of 517 in CA (top 57%) — families likely to look elsewhere, expect single-tenant / working-renter base with shorter leases.
- Zoned schools: Faller Elementary (math 21% / reading 37%, grade F, #891 of 1,571 statewide, top 57%, 538 students, 48% FRL); James Monroe Middle (math 16% / reading 29%, grade F, #382 of 498 statewide, top 78%, 548 students, 49% FRL); Burroughs High (math 37% / reading 70%, grade C-, #281 of 1,170 statewide, top 24%, 1,479 students, 40% FRL) — zoned schools at 46% FRL track the district average.
- Market conditions: Rents rising (+3.6%/yr); 332 active listings in the ZIP; solid renter incomes; 3,244 units permitted in Kern County in 2024 (73 in 5+ unit buildings).
- This rent is only 17% of the median local income ($87k/yr) — well below the 30% rent-burden line; pricing power to push rent on renewal without tenant pushback.
Forward outlook
- Local home prices are declining (-3.0%/yr); year-one equity from $899 of loan paydown is wiped out by about $4k of value loss. Plan a longer hold.
- Kern County population projected at +17% by 2050 — long-run rental-demand tailwind backs the buy-and-hold thesis.
Negotiation context
- It's been on market 47 days — a 3% lower offer ($126k) is reasonable based on typical stale-listing flexibility.
- 4 sale attempts since 2y ago with the ask held roughly flat each time — persistent listings suggest the price (not the market) is what's stuck; bring a comps-based counter.
- Current owner paid $55k; list at $130k implies a 136% gain — meaningful room to come down on a strong offer.
Risks & watch-outs
- Climate carrying-cost: extreme-heat days projected 8→23/yr by 2055 (HVAC capex compounding) — expect insurance premiums to compound above CPI over the hold.
Questions for the listing agent
- It's been on market 47 days. Have you received any prior offers? Is the seller open to a 6% concession, seller financing, or rate buy-down credit?
- Built in 1962 — when were the roof, HVAC, electrical panel, plumbing, and water heater last replaced?
- Is there a deadline driving the sale (1031 exchange, divorce, estate, relocation)? That informs how much negotiation room exists.
- What's the average days-on-market for RENTAL listings here right now (not sales)? A rising rental-DOM trend means longer vacancies and softer asking-rent achievability than the comps imply.
- What's the recent tenant-quality profile in this submarket — average credit score on applications, eviction rate, late-payment / NSF rate, and stable-employment percentage? A property-management company in the area should have these aggregated.
- How much new for-sale + rental construction is in the pipeline within 1–3 miles? Heavy new supply typically softens prices + rents 12–24 months out; constrained supply supports both.
Investment metrics
- 1% rule
- 0.94% ✗
- Cap rate
- 7.91%
- Cash-on-cash
- 5.78%
- DSCR
- 1.26
- GRM
- 8.9
CMA / ARV
- ARV (median comp)
- $84,988
- List price
- $130,000
- Delta
- 52.96%
- Verdict
- OVERPRICED
- Comps
- 2 within 1.0 mi
Projected returns pro-forma
-3.0% appreciation · 3.58% rent growth · sell at horizon
- IRR
- -6.8%
- Equity multiple
- 0.75×
- Total profit
- $-9,236
- Equity at exit
- $19,383
- IRR
- 3.4%
- Equity multiple
- 1.25×
- Total profit
- $9,110
- Equity at exit
- $11,240
Cash invested: $36,400 (down + closing). Projections, not guarantees.
Landlord ↔ Tenant lean methodology
- Overall (STATE)
- 18 Strongly Tenant-Friendly
- State California
- 18 Strongly Tenant-Friendly · D+13
- County
- — inherits STATE
- City
- — inherits STATE
ZIP-level market 93555
- Home prices YoY
- -24.0%
- Rents YoY
- 3.6%
- Active inventory
- 332
- Price-to-rent
- 8.9×
Monthly cashflow live
- Estimated rent
- $1,222 medium interval (Pro) →
- Mortgage (P&I)
- −$682
- Tax from tax record
- −$54 /mo · $649/yr
- Insurance
- −$54
- HOA
- −$0
- Vacancy / Maint / Mgmt
- −$257
- Net cashflow
- $175
Break-even live
Sensitivity live
| Price | -10% $249 | -5% $212 | +0% $175 | +5% $138 | +10% $102 |
|---|---|---|---|---|---|
| Rent | -10% $79 | -5% $127 | +0% $175 | +5% $223 | +10% $272 |
| Rate | -1.0pp $241 | -0.5pp $208 | base $175 | +0.5pp $142 | +1.0pp $107 |
UW: 25.0% down · 7.5% · 30yr · 1.5% tax · 5.0% vac · 8.0% maint · 8.0% mgmt
Financing live
Cash to close
- Down payment
- $32,500
- Closing costs
- $3,900
- Reserves months
- —
- Total cash needed
- —
Loan-product check · same deal, 3 products live
Conventional
25% down · 7.5% · 30yr
- Down + closing
- —
- Monthly P&I
- —
- Monthly cashflow
- —
- DSCR
- —
- Eligible?
- —
Personal DTI + credit; lowest rate.
DSCR
20% down · 8.5% · 30yr
- Down + closing
- —
- Monthly P&I
- —
- Monthly cashflow
- —
- DSCR
- —
- Eligible?
- —
No personal income docs; deal must DSCR.
Hard money
10% down · 12.0% · 12mo
- Down + closing
- —
- Monthly P&I
- —
- Monthly cashflow
- —
- DSCR
- —
- Eligible?
- —
Short-term bridge; refi at stabilization.
Listing history 30 events
-
2026-06-21days on market $130,000 Active 47 DOM
-
2026-06-18days on market $130,000 Active 44 DOM
-
2026-06-17days on market $130,000 Active 43 DOM
-
2026-06-16days on market $130,000 Active 42 DOM
-
2026-06-15days on market $130,000 Active 41 DOM
-
2026-06-14days on market $130,000 Active 39 DOM
-
2026-06-13days on market $130,000 Active 38 DOM
-
2026-06-10days on market $130,000 Active 36 DOM
-
2026-06-09days on market $130,000 Active 35 DOM
-
2026-06-08days on market $130,000 Active 34 DOM
-
2026-06-07days on market $130,000 Active 33 DOM
-
2026-06-05days on market $130,000 Active 30 DOM
-
2026-06-03days on market $130,000 Active 29 DOM
-
2026-06-03days on market $130,000 Active 28 DOM
-
2026-06-01days on market $130,000 Active 27 DOM
-
2026-05-31days on market $130,000 Active 26 DOM
-
2026-05-05$130,000 Active 1171-char remark
-
2026-02-06historical
-
2025-12-30price $123,900
-
2025-12-19price $123,900
-
2025-10-25price $136,000
-
2025-10-25price $136,000
-
2025-07-06price $143,000
-
2025-07-06price $143,000
-
2025-05-09$149,000 Active
-
2025-05-08$149,000 Active
-
2024-04-17soldstatus $55,000 Closed
-
2024-04-17soldstatus $55,000
-
2024-03-09status Pending
-
2024-02-05$59,988 Active
ⓘ Source: listings_history table (triggers on properties + properties_extension) + one-shot
backfill from property_details.listing_events for pre-trigger history.
Tax reassessment forecast CA · Resets to sale price
- Current annual tax
- $649 · $54/mo
- Projected year-2 tax
- $988 · $82/mo
- Expected delta
- +$339/yr (+$28/mo · 52.3%)
ⓘ Screening estimate from a state-policy table — verify with the county assessor before closing.
Climate risk First Street
- Flood 1/10 Low FEMA zone X (unshaded) · 0% chance over 30 yrs
- Wildfire 4/10 Moderate
- Heat 8/10 Severe 8 d/yr ≥103°F today · 23 d/yr by 30 yrs out
- Wind 1/10 Low
- Air quality 7/10 Severe 14 unhealthy d/yr today · 15 by 30 yrs out
Nearby sold comps map
Loading sold comps map…
Walkable amenities ~0.75 mi
Loading nearby amenities…
Taxation est. · year 1
- Rental income
- $14,661
- − Mortgage interest
- −$7,282
- − Property taxes
- −$649
- − Insurance
- −$650
- − Repairs & maintenance
- −$1,173
- − Management
- −$1,173
- − Depreciation
- −$3,782
- Taxable loss
- −$47
- Est. tax savings @ 24.0%
- +$11
- After-tax cash flow
- $2,114/yr
For passive investors: Depreciation is non-cash, so a rental often shows a tax loss while cash-flowing — sheltering income. Rental losses are passive: they offset passive income freely, and up to $25,000/yr can offset ordinary (W-2) income if you actively participate and your MAGI is under $100k (phasing out to $0 by $150k); unused losses carry forward. On sale, claimed depreciation is recaptured at up to 25%, and gains may owe capital-gains tax (a 1031 exchange can defer both). Figures are a year-1 estimate at your 24.0% rate — not tax advice; consult a CPA.
Schools (NCES district)
- District
- Sierra Sands Unified
- NCES district ID
- 0636800
- Math proficiency
- 25% ▼ -11.00%
- Reading proficiency
- 39% ▼ -11.00%
- Median HH income
- $58,937
- Composite
- 28.66/100
- National rank
- #6699
- State rank
- #294 of 517 in CA
Livability — Ridgecrest Heights
No livability data for this city. (Only ~50 U.S. cities are tracked.)
Census & demographics
- County
- Kern County · 710,371 people
- Metro
- Bakersfield, CA
- Population (ZIP)
- 33,845
- Household income
- $86,700
- Rent vs Own
- Severe rent burden
- 975.0
Population outlook (Kern County) Hauer SSP2
- Today (2025)
- 947,286 people
- By 2030
- 978,984 · +3.3%
- By 2040
- 1,045,018 · +10.3%
- By 2050
- 1,105,232 · +16.7%
- By 2075
- 1,229,538 · +29.8%
- By 2100
- 1,238,059 · +30.7%
Race, ethnicity, and origin ACS 2023
- Neighborhood character
- Majority White (65%)
- Race & ethnicity
- White 65% Hispanic / Latino 20% Two or more races 12% Black 4% Asian 4% Native American 1%
- Hispanic origin (detail)
- Mexican 15%
- Common ancestry
- Italian 4% Lithuanian 2% Slovak 2%
- Foreign-born
- 7% · Canada
- Languages at home
- 84% English-only · Spanish 11% Other Indo-European 1% Other Asian/Pacific 1%
Political lean MEDSL · Kern
- 2024 margin
- Strong R (+21.1) · D 38.2% · R 59.3% · Other 2.5%
- 2008→2024 swing
- -3.3pp toward R · 2008: -17.8pp · 2024: -21.1pp
- All cycles
- 2024: R+21.1 2020: R+10.2 2016: R+15.0 2012: R+20.9 2008: R+17.8
Not yet ingested
- Civics
- —
Market trends
- HPI YoY
- ▼ -120.17%
- Current HPI
- 380.5208
- Rent YoY
- ▲ 3.58%
- Metro
- Bakersfield, CA
- State GDP YoY
- ▲ 3.21%
- F500 in state
- 116
Industry mix (Fortune 500 HQ in CA)
| Industry | F500 HQs | Revenue |
|---|---|---|
| Technology | 27 | $1,492B |
|
||
| Financial Services | 3 | $174B |
|
||
| Retail | 3 | $44B |
|
||
| Insurance | 3 | $26B |
|
||
| Media / Entertainment | 2 | $115B |
|
||
| Pharmaceuticals / Biotech | 2 | $62B |
|
||
Price history
+116.7% since first listed14 events — show timeline
- 2026-05-05 Listed $130,000 CRMLS
- 2026-02-06 Listing Removed — CRMLS
- 2025-12-30 Price Changed $123,900 CRMLS
- 2025-12-19 Price Changed $123,900 SSMLS
- 2025-10-25 Price Changed $136,000 SSMLS
- 2025-10-25 Price Changed $136,000 CRMLS
- 2025-07-06 Price Changed $143,000 SSMLS
- 2025-07-06 Price Changed $143,000 CRMLS
- 2025-05-09 Listed $149,000 CRMLS
- 2025-05-08 Listed $149,000 SSMLS
- 2024-04-17 Sold (Public Records) $55,000 Public Records
- 2024-04-17 Sold (MLS) $55,000 SSMLS
- 2024-03-09 Pending — SSMLS
- 2024-02-05 Listed $59,988 SSMLS
Property tax history
+12.5%/yrLatest (2025): $649 · +169.6% YoY. Source: county tax records.
Cash-flow waterfall
monthlySold comps — $/sqft
last 12 mo · ≤1 miLoading sold comps…