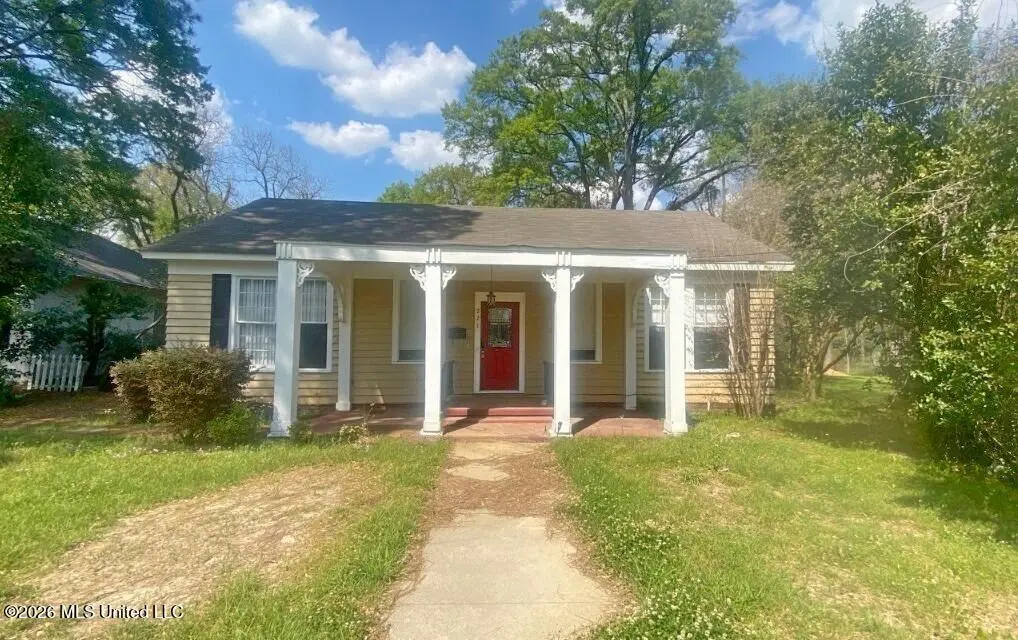
221 E Center St · Canton, MS
Flood risk 1/10 · Minimal
- FEMA flood zone
- X (unshaded)
- Chance of flooding over 30 yrs
- 0.0%
- Est. flood insurance / yr
- $507 – $1,088
Fire risk 3/10 · Minor
- Est. fire insurance / yr
- $1,241 – $2,305
Heat risk 7/10 · Major
- Hot days now (above 109°F)
- 7 days/yr
- Hot days in 30 yrs
- 20 days/yr
Wind risk 7/10 · Major
- Chance of severe wind over 30 yrs
- 78.0%
Air-quality risk 2/10 · Minimal
- Unhealthy air days now
- 0 days/yr
- Unhealthy air days in 30 yrs
- 1 days/yr
Risk factors via First Street. Map © Google.
Why this score? — see what drove the B grade
The composite is a weighted blend of 9 inputs, each scored 0–100. Each bar is that input's sub-score; the figure is the points it added to the 100-point composite (weight × sub-score).
- Cash flow +30.0/30.0
- ARV discount +15.0/15.0
- 1% rule +10.0/10.0
- DSCR +10.0/10.0
- Livability +3.0/5.0
- Rent growth +2.5/5.0
- Condition / age +2.5/5.0
- Schools +1.3/10.0
- Appreciation +0.0/10.0
$139,000
🖨 Deal sheet 📄 Offer letter ✓ Due diligence
Listing remarks MLS
This property includes multiple bedrooms and bathrooms, with defined living spaces and a kitchen area. The layout supports a range of residential uses and includes outdoor yard space. Situated within the city, the location offers access to local roadways, shopping, and community amenities. The property is being sold AS-IS and may appeal to buyers considering a primary residence or investment. Property is under court-ordered receivership; a copy of the order is available.
Key facts
- 0.29 acre lot
- Parking
- Built 1930
Neighborhood map
What this means for you Summary
Snapshot
- This is a 3-bed/3.0-bath single-family listed at $139k.
Deal economics
- At list price, monthly cash flow is $1k ($12k/yr) — positive.
- The deal already cash-flows at list — no discount required.
- Meets the 1% rule at list price ($2k rent vs $139k).
- Recommended offer: $131k (6.0% below list) — sets the bar for market timing.
- Cap rate 15.0% vs local median 4.2% in Canton — top-decile yield for the area; either an underpriced asset or a hidden risk that comps aren't pricing in. Stress-test before assuming the spread holds.
Location & tenants
- Location reads 60/100 on livability (#229 in MS) — a middle-class / working-renter tenant base. Strengths: cost of living A+, crime B+; Watch: schools F, amenities F, commute F.
- Canton Public School District (rural): math 13% / reading 19% proficiency, ranked #100 of 130 in MS (top 77%) — low school quality limits family demand, transient renter base, plan for 1-2y turnover; 94% free/reduced lunch — lower-income household profile, screen leases tightly.
- Market conditions: 358 active listings in the ZIP; 1 comparable units currently listed for rent nearby; 553 units permitted in Madison County in 2024 (0 in 5+ unit buildings).
Forward outlook
- Local home prices are declining (-3.0%/yr); year-one equity from $961 of loan paydown is wiped out by about $4k of value loss. Plan a longer hold.
- Madison County population projected at +34% by 2050 — long-run rental-demand tailwind backs the buy-and-hold thesis.
- At projected returns (-3.0% appreciation + 3.0% rent growth), your $39k cash investment doubles in ~4 years — after that, you're playing with house money.
Negotiation context
- It's been on market 80 days — a 6% lower offer ($131k) is reasonable based on typical stale-listing flexibility.
- 6 sale attempts since 14y ago with the ask held roughly flat each time — persistent listings suggest the price (not the market) is what's stuck; bring a comps-based counter.
Risks & watch-outs
- Watch-outs: built in 1930 — expect roof / HVAC / electrical / plumbing capex.
- Climate carrying-cost: major wind risk, 78% chance of damaging wind over 30y; extreme-heat days projected 7→20/yr by 2055 (HVAC capex compounding) — expect insurance premiums to compound above CPI over the hold.
Questions for the listing agent
- It's been on market 80 days. Have you received any prior offers? Is the seller open to a 6% concession, seller financing, or rate buy-down credit?
- Built in 1930 — when were the roof, HVAC, electrical panel, plumbing, and water heater last replaced?
- Why hasn't it sold? Are there any deal-killer items the seller is aware of (foundation, flood, title, zoning, code violations)?
- Is there a deadline driving the sale (1031 exchange, divorce, estate, relocation)? That informs how much negotiation room exists.
- Schools are F-rated, which usually means shorter tenancies and higher turnover. Who's the typical renter profile here, and what's been the actual vacancy rate?
- What's the average days-on-market for RENTAL listings here right now (not sales)? A rising rental-DOM trend means longer vacancies and softer asking-rent achievability than the comps imply.
- What's the recent tenant-quality profile in this submarket — average credit score on applications, eviction rate, late-payment / NSF rate, and stable-employment percentage? A property-management company in the area should have these aggregated.
- How much new for-sale + rental construction is in the pipeline within 1–3 miles? Heavy new supply typically softens prices + rents 12–24 months out; constrained supply supports both.
Investment metrics
- 1% rule
- 1.73% ✓
- Cap rate
- 15.01%
- Cash-on-cash
- 31.14%
- DSCR
- 2.39
- GRM
- 4.8
CMA / ARV
- ARV (median comp)
- $271,936
- List price
- $139,000
- Delta
- -48.88%
- Verdict
- UNDERPRICED
- Comps
- 20 within 1.0 mi
Show comp detail 10 sales within ~0.75 mi
| Address | Dist | Beds/Ba | Sqft | Sold | Price | $/sf | Match |
|---|---|---|---|---|---|---|---|
| 351 E Academy St | 0.34mi | 3/2.0 | 1,692 (+6%) | 12mo | $149,000 | $88 | 61 |
| 236 Hemimgway Cir | 0.33mi | 3/2.0 | 1,506 (-6%) | 23mo | $272,900 | $181 | 52 |
| 228 E Dinkins St | 0.72mi | 3/1.5 | 1,644 (+2%) | 8mo | $160,000 | $97 | 50 |
| 409 E Fulton St | 0.37mi | 3/2.0 | 1,713 (+7%) | 23mo | $189,000 | $110 | 48 |
| 201 E Semmes St | 0.42mi | 2/2.0 (-1) | 1,540 (-4%) | 24mo | $140,000 | $91 | 45 |
| 3472 N Liberty St | 0.57mi | 4/2.0 (+1) | 1,664 (+4%) | 20mo | $49,900 | $30 | 42 |
| 383 Frost St | 0.63mi | 2/1.0 (-1) | 1,461 (-9%) | 4mo | $44,900 | $31 | 40 |
| 508 Lyon St | 0.59mi | 3/2.0 | 1,417 (-12%) | 16mo | $185,000 | $131 | 36 |
| 365 S Walnut St | 0.72mi | 3/1.0 | 1,416 (-12%) | 4mo | $49,900 | $35 | 35 |
| 453 Washington St | 0.52mi | 2/1.0 (-1) | 1,760 (+10%) | 22mo | $39,900 | $23 | 28 |
Match score weights: distance 35% · size 25% · config 20% · recency 20%. Top-matched comps best support the ARV.
Projected returns pro-forma
-3.0% appreciation · 3.0% rent growth · sell at horizon
- IRR
- 25.9%
- Equity multiple
- 2.07×
- Total profit
- $41,795
- Equity at exit
- $20,725
- IRR
- 33.6%
- Equity multiple
- 4.06×
- Total profit
- $119,189
- Equity at exit
- $12,018
Cash invested: $38,920 (down + closing). Projections, not guarantees.
Landlord ↔ Tenant lean methodology
- Overall (STATE)
- 90 Strongly Landlord-Friendly
- State Mississippi
- 90 Strongly Landlord-Friendly · R+11
- County
- — inherits STATE
- City
- — inherits STATE
ZIP-level market 39046
- Home prices YoY
- -30.1%
- Active inventory
- 358
- Price-to-rent
- 4.8×
Monthly cashflow live
- Estimated rent
- $2,400 medium interval (Pro) →
- Mortgage (P&I)
- −$729
- Tax from tax record
- −$99 /mo · $1,190/yr
- Insurance
- −$58
- HOA
- −$0
- Vacancy / Maint / Mgmt
- −$504
- Net cashflow
- $1,010
Break-even live
UW: 25.0% down · 7.5% · 30yr · 1.5% tax · 5.0% vac · 8.0% maint · 8.0% mgmt
Financing live
Cash to close
- Down payment
- $34,750
- Closing costs
- $4,170
- Reserves months
- —
- Total cash needed
- —
Loan-product check · same deal, 3 products live
Conventional
25% down · 7.5% · 30yr
- Down + closing
- —
- Monthly P&I
- —
- Monthly cashflow
- —
- DSCR
- —
- Eligible?
- —
Personal DTI + credit; lowest rate.
DSCR
20% down · 8.5% · 30yr
- Down + closing
- —
- Monthly P&I
- —
- Monthly cashflow
- —
- DSCR
- —
- Eligible?
- —
No personal income docs; deal must DSCR.
Hard money
10% down · 12.0% · 12mo
- Down + closing
- —
- Monthly P&I
- —
- Monthly cashflow
- —
- DSCR
- —
- Eligible?
- —
Short-term bridge; refi at stabilization.
Rent comps 1 comps
| Address | Beds | Baths | Sqft | Rent | $/sqft | DOM | Units | Dist |
|---|---|---|---|---|---|---|---|---|
| 102 Rotherfield PL Canton, MS | 3.0 | 2.0 | 1565 | $2,400 | $1.53 | 13d | 1 | 0.35mi |
Listing history 34 events
-
2026-06-18days on market $139,000 Active 80 DOM
-
2026-06-17days on market $139,000 Active 79 DOM
-
2026-06-16days on market $139,000 Active 78 DOM
-
2026-06-15days on market $139,000 Active 77 DOM
-
2026-06-14days on market $139,000 Active 75 DOM
-
2026-06-13days on market $139,000 Active 74 DOM
-
2026-06-10days on market $139,000 Active 72 DOM
-
2026-06-09days on market $139,000 Active 71 DOM
-
2026-06-08days on market $139,000 Active 70 DOM
-
2026-06-07days on market $139,000 Active 69 DOM
-
2026-06-05days on market $139,000 Active 66 DOM
-
2026-06-03days on market $139,000 Active 65 DOM
-
2026-06-02days on market $139,000 Active 64 DOM
-
2026-06-01days on market $139,000 Active 63 DOM
-
2026-05-31days on market $139,000 Active 62 DOM
-
2026-05-30days on market $139,000 Active 61 DOM
-
2026-03-30$139,000 Active 478-char remark
Show marketing remark (478 chars)
This property includes multiple bedrooms and bathrooms, with defined living spaces and a kitchen area. The layout supports a range of residential uses and includes outdoor yard space. Situated within the city, the location offers access to local roadways, shopping, and community amenities. The property is being sold AS-IS and may appeal to buyers considering a primary residence or investment. Property is under court-ordered receivership; a copy of the order is available.
-
2026-03-23historical
-
2026-03-04price $139,000
-
2026-01-19price $145,000
-
2025-12-01$150,000 Active
-
2019-03-18soldstatus
-
2018-11-29$102,000
-
2014-07-18historical
-
2013-09-26$102,000
-
2012-12-13$12,900
-
2012-12-12historical
-
2012-10-13$12,900
-
2006-05-08soldstatus
-
2003-02-10soldstatus
-
1996-11-26soldstatus
-
1996-11-04soldstatus
-
1996-10-25soldstatus
-
1986-10-21soldstatus
ⓘ Source: listings_history table (triggers on properties + properties_extension) + one-shot
backfill from property_details.listing_events for pre-trigger history.
Tax reassessment forecast MS · Resets to sale price
- Current annual tax
- $1,190 · $99/mo
- Projected year-2 tax
- $1,190 · $99/mo
- Expected delta
- $0/yr ($0/mo · 0.0%)
ⓘ Screening estimate from a state-policy table — verify with the county assessor before closing.
Climate risk First Street
- Flood 1/10 Low FEMA zone X (unshaded) · 0% chance over 30 yrs
- Wildfire 3/10 Moderate
- Heat 7/10 Severe 7 d/yr ≥109°F today · 20 d/yr by 30 yrs out
- Wind 7/10 Severe 78% chance of damaging wind over 30 yrs
- Air quality 2/10 Low 0 unhealthy d/yr today · 1 by 30 yrs out
Nearby sold comps map
Loading sold comps map…
Walkable amenities ~0.75 mi
Loading nearby amenities…
Taxation est. · year 1
- Rental income
- $28,800
- − Mortgage interest
- −$7,786
- − Property taxes
- −$1,190
- − Insurance
- −$695
- − Repairs & maintenance
- −$2,304
- − Management
- −$2,304
- − Depreciation
- −$4,044
- Taxable income
- $10,478
- Est. tax owed @ 24.0%
- −$2,515
- After-tax cash flow
- $9,606/yr
For passive investors: Depreciation is non-cash, so a rental often shows a tax loss while cash-flowing — sheltering income. Rental losses are passive: they offset passive income freely, and up to $25,000/yr can offset ordinary (W-2) income if you actively participate and your MAGI is under $100k (phasing out to $0 by $150k); unused losses carry forward. On sale, claimed depreciation is recaptured at up to 25%, and gains may owe capital-gains tax (a 1031 exchange can defer both). Figures are a year-1 estimate at your 24.0% rate — not tax advice; consult a CPA.
Schools (NCES district)
- District
- Canton Public School District
- NCES district ID
- 2800900
- Math proficiency
- 13% ▼ -20.00%
- Reading proficiency
- 19% ▼ -5.00%
- Median HH income
- $38,130
- Composite
- 13.44/100
- National rank
- #9523
- State rank
- #100 of 130 in MS
Livability — Canton
- Score
- 60/100
- State rank
- #229
- US rank
- #19396
Category grades
Schools grade is shown separately in the Schools card above.
Census & demographics
- Census place
- Canton, MS
- City population
- 29,160
- Population (ZIP)
- 29,160
Population outlook (Madison County) Hauer SSP2
- Today (2025)
- 122,509 people
- By 2030
- 131,737 · +7.5%
- By 2040
- 148,930 · +21.6%
- By 2050
- 164,300 · +34.1%
- By 2075
- 197,495 · +61.2%
- By 2100
- 211,429 · +72.6%
Race, ethnicity, and origin ACS 2023
- Neighborhood character
- Majority Black (63%)
- Race & ethnicity
- Black 63% White 31% Hispanic / Latino 4% Two or more races 2%
- Common ancestry
- Italian 2% Slovak 1% Serbian 1%
- Foreign-born
- 2% · Canada, China
- Languages at home
- 95% English-only · Spanish 4%
Political lean MEDSL · Madison
- 2024 margin
- R (+17.3) · D 40.8% · R 58.0% · Other 1.2%
- 2008→2024 swing
- -1.7pp toward R · 2008: -15.6pp · 2024: -17.3pp
- All cycles
- 2024: R+17.3 2020: R+11.8 2016: R+16.1 2012: R+15.7 2008: R+15.6
Not yet ingested
- Civics
- —
Market trends
- HPI YoY
- ▼ -66.50%
- Current HPI
- 154.0441
- Rent YoY
- —
- Metro
- —
- State GDP YoY
- —
- F500 in state
- 0
Price history
+977.5% since first listed18 events — show timeline
- 2026-03-30 Listed $139,000 MLSU
- 2026-03-23 Listing Removed — MLSU
- 2026-03-04 Price Changed $139,000 MLSU
- 2026-01-19 Price Changed $145,000 MLSU
- 2025-12-01 Listed $150,000 MLSU
- 2019-03-18 Sold (MLS) — MLSU
- 2018-11-29 Listed $102,000 MLSU
- 2014-07-18 Listing Removed — MLSU
- 2013-09-26 Listed $102,000 MLSU
- 2012-12-13 Listed $12,900 MLSU
- 2012-12-12 Listing Removed — MLSU
- 2012-10-13 Listed $12,900 MLSU
- 2006-05-08 Sold (Public Records) — Public Records
- 2003-02-10 Sold (Public Records) — Public Records
- 1996-11-26 Sold (Public Records) — Public Records
- 1996-11-04 Sold (Public Records) — Public Records
- 1996-10-25 Sold (Public Records) — Public Records
- 1986-10-21 Sold (Public Records) — Public Records
Property tax history
+1.0%/yrLatest (2025): $1,190 · +0.0% YoY. Source: county tax records.
Cash-flow waterfall
monthlySold comps — $/sqft
last 12 mo · ≤1 miLoading sold comps…