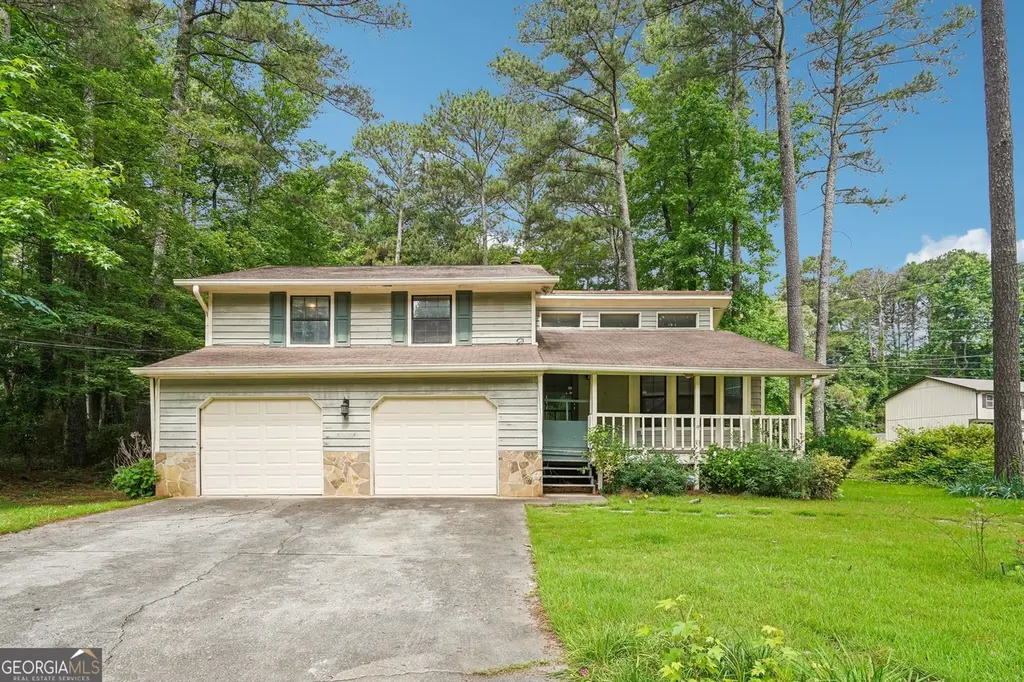
511 Ryan Pl · Stone Mountain, GA
Flood risk 5/10 · Moderate
- FEMA flood zone
- X (unshaded)
- Chance of flooding over 30 yrs
- 0.24%
- Est. flood insurance / yr
- $507 – $1,088
Fire risk 1/10 · Minimal
- Est. fire insurance / yr
- $963 – $1,789
Heat risk 5/10 · Moderate
- Hot days now (above 104°F)
- 7 days/yr
- Hot days in 30 yrs
- 18 days/yr
Wind risk 5/10 · Moderate
- Chance of severe wind over 30 yrs
- 25.0%
Air-quality risk 6/10 · Moderate
- Unhealthy air days now
- 8 days/yr
- Unhealthy air days in 30 yrs
- 11 days/yr
Risk factors via First Street. Map © Google.
Why this score? — see what drove the D+ grade
The composite is a weighted blend of 9 inputs, each scored 0–100. Each bar is that input's sub-score; the figure is the points it added to the 100-point composite (weight × sub-score).
- Cash flow +16.2/30.0
- ARV discount +9.6/15.0
- DSCR +5.0/10.0
- Livability +4.0/5.0
- 1% rule +3.2/10.0
- Rent growth +2.8/5.0
- Condition / age +2.5/5.0
- Schools +2.1/10.0
- Appreciation +0.0/10.0
$239,900
🖨 Deal sheet (PDF) 📄 Offer letter ✓ Due diligence
Listing remarks MLS
Welcome home to this split floor plan featuring 3BR/2BA! Large open family room with fireplace leading to a sunroom or office space on main floor. Step down to the spacious kitchen, open dining and laundry area! Upstairs features 3 bedrooms with new carpet and 2 bathrooms! Schedule your showing today!
Key facts
- 0.35 acre lot
- 2 garage spots
- Built 1986
Property features AI
Exterior
- Parking: 2-car garage; Kitchen-level parking access
- Utilities: Public water; Public sewer; Electricity available
- Home design: Multi-level / split-level home; Fee simple ownership
- Construction: Cedar and wood siding exterior; Composition roof; Resale property
- Exterior features: Front porch; Back yard fencing; Other exterior features
Interior
- Kitchen: Eat-in kitchen; Dishwasher; Microwave
- Bedrooms: Three bedrooms on the upper level
- Flooring: Carpet; Ceramic tile; Laminate
- Bathrooms: Two full bathrooms (both on the upper level); Master bath with separate tub and shower
- Heating & cooling: Central heating (electric); Central air conditioning; Ceiling fans
- Interior features: One factory-built fireplace in the family room; No shared/common walls; Other interior features
- Laundry & utility: Laundry in hall; Laundry in kitchen; Laundry closet
Neighborhood map
What this means for you Summary
Snapshot
- This is a 3-bed/2.0-bath single-family listed at $240k.
Deal economics
- At list price, monthly cash flow is $129 ($2k/yr) — positive.
- The deal already cash-flows at list — no discount required.
- To meet the 1% rule (rent ≥ 1% of price), the offer needs to be $197k (17.7% below list).
- Recommended offer: $197k (17.7% below list) — sets the bar for 1% rule.
- Cap rate 6.9% vs local median 5.1% in Stone Mountain — top-decile yield for the area; either an underpriced asset or a hidden risk that comps aren't pricing in. Stress-test before assuming the spread holds.
Location & tenants
- Location reads 79/100 on livability (#11 in GA, #1,977 nationally) — a middle-class / working-renter tenant base. Strengths: commute A+, cost of living A+, housing A+; Watch: employment D+, crime F.
- Dekalb County (suburban): math 19% / reading 28% proficiency, ranked #125 of 174 in GA (top 72%) — low school quality limits family demand, transient renter base, plan for 1-2y turnover; 68% free/reduced lunch — lower-income household profile, screen leases tightly.
- Zoned schools: Pine Ridge Elementary School (math 8% / reading 8%, grade F, #1,125 of 1,228 statewide, top 93%, 597 students, 100% FRL); Stephenson Middle School (math 8% / reading 22%, grade F, #399 of 470 statewide, top 86%, 812 students, 100% FRL); Stephenson High School (math 9% / reading 25%, grade F, #277 of 424 statewide, top 67%, 1,354 students, 64% FRL) — zoned schools average 88% FRL vs 68% district-wide (20 pts higher); higher-poverty schools than district average — tighter screening recommended.
- Market conditions: Rents rising (+1.3%/yr); 250 active listings in the ZIP; 26 comparable units currently listed for rent nearby; rentals at typical pace (median 24d on market — plan ~3-4 weeks tenant-placement turnaround); solid renter incomes; 1,240 units permitted in DeKalb County in 2024 (385 in 5+ unit buildings).
Forward outlook
- Local home prices are declining (-3.0%/yr); year-one equity from $2k of loan paydown is wiped out by about $7k of value loss. Plan a longer hold.
- DeKalb County population projected at +28% by 2050 — long-run rental-demand tailwind backs the buy-and-hold thesis.
Negotiation context
- It's been on market 16 days — a 2% lower offer ($236k) is reasonable based on typical stale-listing flexibility.
- 3 sale attempts since 19y ago with the ask held roughly flat each time — persistent listings suggest the price (not the market) is what's stuck; bring a comps-based counter.
- Current owner paid $83k; list at $240k implies a 191% gain — meaningful room to come down on a strong offer.
Risks & watch-outs
- Climate carrying-cost: moderate flood risk; moderate wind risk, 25% chance of damaging wind over 30y; extreme-heat days projected 7→18/yr by 2055 (HVAC capex compounding) — expect insurance premiums to compound above CPI over the hold.
Questions for the listing agent
- Is there a deadline driving the sale (1031 exchange, divorce, estate, relocation)? That informs how much negotiation room exists.
- Schools are F-rated, which usually means shorter tenancies and higher turnover. Who's the typical renter profile here, and what's been the actual vacancy rate?
- Crime grade is F in this area — have there been break-ins, vandalism, or insurance claims at this property in the last 3 years? What carrier currently insures it and at what premium?
- The area grade is low — what's the realistic commute time and amenity access for the typical tenant pool here? Any planned neighborhood developments (good or bad) we should know about?
- What's the average days-on-market for RENTAL listings here right now (not sales)? A rising rental-DOM trend means longer vacancies and softer asking-rent achievability than the comps imply.
- What's the recent tenant-quality profile in this submarket — average credit score on applications, eviction rate, late-payment / NSF rate, and stable-employment percentage? A property-management company in the area should have these aggregated.
- How much new for-sale + rental construction is in the pipeline within 1–3 miles? Heavy new supply typically softens prices + rents 12–24 months out; constrained supply supports both.
Investment metrics
- 1% rule
- 0.82% ✗
- Cap rate
- 6.94%
- Cash-on-cash
- 2.31%
- DSCR
- 1.10
- GRM
- 10.1
CMA / ARV
- ARV (on-the-fly)
- $251,704
- Comps found
- 12
Show comp detail 12 sales within ~0.75 mi
| Address | Dist | Beds/Ba | Sqft | Sold | Price | $/sf | Match |
|---|---|---|---|---|---|---|---|
| 512 Ryan Pl | 0.02mi | 3/2.5 | 1,676 (-3%) | 2mo | $140,000 | $84 | 90 |
| 571 Pennylake Ln | 0.13mi | 3/2.5 | 1,862 (+8%) | 12mo | $231,900 | $125 | 69 |
| 482 Maid Marion Ln | 0.47mi | 3/2.5 | 1,776 (+3%) | 4mo | $260,000 | $146 | 68 |
| 5515 Pennybrook Trl | 0.21mi | 3/2.5 | 1,588 (-8%) | 11mo | $280,000 | $176 | 66 |
| 5745 Walter Trl | 0.23mi | 4/2.5 (+1) | 1,916 (+11%) | 1mo | $255,900 | $134 | 63 |
| 643 Woodsong Ln | 0.52mi | 3/2.0 | 1,625 (-6%) | 8mo | $245,000 | $151 | 60 |
| 508 Jaywood Dr | 0.52mi | 3/2.5 | 1,584 (-8%) | 10mo | $249,900 | $158 | 51 |
| 5848 Navarre Ct | 0.53mi | 3/2.0 | 1,516 (-12%) | 7mo | $220,000 | $145 | 50 |
| 5809 Oakleaf Way | 0.75mi | 3/2.5 | 1,852 (+7%) | 2mo | $235,000 | $127 | 49 |
| 5802 Oakleaf Dr | 0.58mi | 3/2.5 | 1,918 (+11%) | 8mo | $231,000 | $120 | 46 |
| 425 Orchard Dr | 0.48mi | 4/3.0 (+1) | 1,500 (-13%) | 11mo | $249,900 | $167 | 38 |
| 5332 Zachary Dr | 0.74mi | 4/2.5 (+1) | 1,898 (+10%) | 8mo | $282,900 | $149 | 34 |
Match score weights: distance 35% · size 25% · config 20% · recency 20%. Top-matched comps best support the ARV.
Projected returns pro-forma
-3.0% appreciation · 1.3% rent growth · sell at horizon
- IRR
- -14.4%
- Equity multiple
- 0.49×
- Total profit
- $-34,086
- Equity at exit
- $35,770
- IRR
- -8.4%
- Equity multiple
- 0.51×
- Total profit
- $-32,713
- Equity at exit
- $20,742
Cash invested: $67,172 (down + closing). Projections, not guarantees.
Landlord ↔ Tenant lean methodology
- Overall (STATE)
- 90 Strongly Landlord-Friendly
- State Georgia
- 90 Strongly Landlord-Friendly · R+3
- County
- — inherits STATE
- City
- — inherits STATE
ZIP-level market 30087
- Rents YoY
- 1.3%
- Active inventory
- 250
- Price-to-rent
- 10.1×
Monthly cashflow live
- Estimated rent
- $1,974 high interval (Pro) →
- Mortgage (P&I)
- −$1,258
- Tax from tax record
- −$73 /mo · $872/yr
- Insurance
- −$100
- HOA
- −$0
- Vacancy / Maint / Mgmt
- −$415
- Net cashflow
- $129
Break-even live
Sensitivity live
| Price | -10% $265 | -5% $197 | +0% $129 | +5% $61 | +10% $-7 |
|---|---|---|---|---|---|
| Rent | -10% $-27 | -5% $51 | +0% $129 | +5% $207 | +10% $285 |
| Rate | -1.0pp $250 | -0.5pp $190 | base $129 | +0.5pp $67 | +1.0pp $4 |
UW: 25.0% down · 7.5% · 30yr · 1.5% tax · 5.0% vac · 8.0% maint · 8.0% mgmt
Financing live
Cash to close
- Down payment
- $59,975
- Closing costs
- $7,197
- Reserves months
- —
- Total cash needed
- —
Loan-product check · same deal, 3 products live
Conventional
25% down · 7.5% · 30yr
- Down + closing
- —
- Monthly P&I
- —
- Monthly cashflow
- —
- DSCR
- —
- Eligible?
- —
Personal DTI + credit; lowest rate.
DSCR
20% down · 8.5% · 30yr
- Down + closing
- —
- Monthly P&I
- —
- Monthly cashflow
- —
- DSCR
- —
- Eligible?
- —
No personal income docs; deal must DSCR.
Hard money
10% down · 12.0% · 12mo
- Down + closing
- —
- Monthly P&I
- —
- Monthly cashflow
- —
- DSCR
- —
- Eligible?
- —
Short-term bridge; refi at stabilization.
Rent comps 26 comps
| Address | Beds | Baths | Sqft | Rent | $/sqft | DOM | Units | Dist |
|---|---|---|---|---|---|---|---|---|
| 5612 Pennybrook Ct Stone Mountain, GA | 3.0 | 2.0 | 1364 | $1,941 | $1.42 | 14d | 1 | 0.10mi |
| 524 Julius Dr Stone Mountain, GA | 3.0 | 2.0 | 1780 | $1,795 | $1.01 | 45d | 1 | 0.14mi |
| 450 Pennybrook Dr Stone Mountain, GA | 3.0 | 2.0 | 1404 | $1,750 | $1.25 | 26d | 1 | 0.17mi |
| 5509 Stonehaven Way Stone Mountain, GA | 4.0 | 3.0 | 1635 | $1,899 | $1.16 | 24d | 1 | 0.36mi |
| 469 Sherwood Grn Stone Mountain, GA | 3.0 | 2.0 | 1792 | $1,810 | $1.01 | 13d | 1 | 0.47mi |
| 5811 Navarre Ct Stone Mountain, GA | 3.0 | 2.0 | 1864 | $1,911 | $1.03 | 4d | 1 | 0.56mi |
| 5621 Stonington Trace Pkwy Stone Mountain, GA | 2.0 | 3.5 | 1292 | $1,581 | $1.22 | 17d | 1 | 0.60mi |
| 779 Pepperwood Trl Stone Mountain, GA | 3.0 | 2.0 | 1458 | $1,980 | $1.36 | 1d | 1 | 0.62mi |
| 5707 Wells Cir Stone Mountain, GA | 2.0 | 2.5 | 1160 | $1,506 | $1.30 | 6d | 1 | 0.63mi |
| 5713 Wells Cir Stone Mountain, GA | 3.0 | 2.5 | 1304 | $1,706 | $1.31 | 7d | 1 | 0.63mi |
| 697 Pepperwood Trl Stone Mountain, GA | 3.0 | 2.0 | 1576 | $1,650 | $1.05 | 45d | 1 | 0.63mi |
| 5702 Wells Cir Stone Mountain, GA | 2.0 | 2.5 | 1160 | $1,495 | $1.29 | 45d | 1 | 0.66mi |
| 5370 Zachary Dr Stone Mountain, GA | 4.0 | 2.0 | 1556 | $1,150 | $0.74 | 26d | 1 | 0.66mi |
| 5353 Ridgemere Ct Stone Mountain, GA | 3.0 | 2.5 | 1160 | $1,465 | $1.26 | 7d | 1 | 0.74mi |
| 5351 Ridgemere Ct Stone Mountain, GA | 3.0 | 2.5 | 1160 | $1,465 | $1.26 | 7d | 1 | 0.75mi |
| 768 Fourth St Stone Mountain, GA | 3.0 | 2.0 | 1200 | $2,100 | $1.75 | 7d | 1 | 0.81mi |
| 5280 Ridge Forest Dr Stone Mountain, GA | 2.0 | 2.5 | 1170 | $1,325 | $1.13 | 45d | 1 | 0.81mi |
| 5290 Stonebush Ter Unit A Stone Mountain, GA | 2.0 | 2.5 | 1200 | $1,450 | $1.21 | 20d | 1 | 0.86mi |
| 643 Navarre Dr Stone Mountain, GA | 3.0 | 2.5 | 1666 | $2,600 | $1.56 | 45d | 1 | 0.94mi |
| 5308 Omalley Ln Stone Mountain, GA | 4.0 | 2.5 | 1950 | $1,949 | $1.00 | 45d | 1 | 0.99mi |
| 651 Mincey Woods Ct Stone Mountain, GA | 3.0 | 2.0 | 2188 | $2,150 | $0.98 | 45d | 1 | 1.01mi |
| 427 Chanterelle Dr Stone Mountain, GA | 3.0 | 2.5 | 1608 | $1,650 | $1.03 | 5d | 1 | 1.07mi |
| 811 King Rd Stone Mountain, GA | 3.0 | 3.0 | 1840 | $3,300 | $1.79 | 45d | 1 | 1.33mi |
| 827 San Miguel Dr Stone Mountain, GA | 3.0 | 2.0 | 1272 | $1,550 | $1.22 | 18d | 1 | 1.35mi |
| 1150 Rankin St Stone Mountain, GA | 2.0–3.0 | 2.5 | 1437 | $1,850 | $1.29 | 45d | 2 | 1.46mi |
| 1150 Rankin St Stone Mountain, GA | 2.0 | 2.5 | 1495 | $1,850 | $1.24 | 26d | 1 | 1.49mi |
Listing history 10 events
-
2026-06-21days on market $239,900 Active 16 DOM
-
2026-06-18days on market $239,900 Active 13 DOM
-
2026-06-17days on market $239,900 Active 12 DOM
-
2026-06-16days on market $239,900 Active 11 DOM
-
2026-06-15days on market $239,900 Active 10 DOM
-
2026-06-13days on market $239,900 Active 8 DOM
-
2026-06-09days on market $239,900 Active 4 DOM
-
2026-06-08days on market $239,900 Active 3 DOM
-
2026-06-07remarks 305-char remark
-
2026-06-07$239,900 Active 2 DOM
ⓘ Source: listings_history table (triggers on properties + properties_extension) + one-shot
backfill from property_details.listing_events for pre-trigger history.
Tax reassessment forecast GA · Resets to sale price
- Current annual tax
- $872 · $73/mo
- Projected year-2 tax
- $2,207 · $184/mo
- Expected delta
- +$1,335/yr (+$111/mo · 153.2%)
ⓘ Screening estimate from a state-policy table — verify with the county assessor before closing.
Climate risk First Street
- Flood 5/10 Major FEMA zone X (unshaded) · 24% chance over 30 yrs
- Wildfire 1/10 Low
- Heat 5/10 Major 7 d/yr ≥104°F today · 18 d/yr by 30 yrs out
- Wind 5/10 Major 25% chance of damaging wind over 30 yrs
- Air quality 6/10 Major 8 unhealthy d/yr today · 11 by 30 yrs out
Nearby sold comps map
Loading sold comps map…
Walkable amenities ~0.75 mi
Loading nearby amenities…
Taxation est. · year 1
- Rental income
- $23,692
- − Mortgage interest
- −$13,438
- − Property taxes
- −$872
- − Insurance
- −$1,200
- − Repairs & maintenance
- −$1,895
- − Management
- −$1,895
- − Depreciation
- −$6,979
- Taxable loss
- −$2,587
- Est. tax savings @ 24.0%
- +$621
- After-tax cash flow
- $2,169/yr
For passive investors: Depreciation is non-cash, so a rental often shows a tax loss while cash-flowing — sheltering income. Rental losses are passive: they offset passive income freely, and up to $25,000/yr can offset ordinary (W-2) income if you actively participate and your MAGI is under $100k (phasing out to $0 by $150k); unused losses carry forward. On sale, claimed depreciation is recaptured at up to 25%, and gains may owe capital-gains tax (a 1031 exchange can defer both). Figures are a year-1 estimate at your 24.0% rate — not tax advice; consult a CPA.
Schools (NCES district)
- District
- Dekalb County
- NCES district ID
- 1301740
- Math proficiency
- 19% ▼ -12.00%
- Reading proficiency
- 28% ▼ -7.00%
- Median HH income
- $51,448
- Composite
- 20.92/100
- National rank
- #8482
- State rank
- #125 of 174 in GA
Livability — Stone Mountain
- Score
- 79/100
- State rank
- #11
- US rank
- #1977
Category grades
Schools grade is shown separately in the Schools card above.
Census & demographics
- County
- Dekalb County · 782,738 people
- City population
- 130,941
- Metro
- Atlanta-Sandy Springs-Alpharetta, GA
- Population (ZIP)
- 38,977
- Household income
- $96,491
- Rent vs Own
- Severe rent burden
- 780.0
Population outlook (DeKalb County) Hauer SSP2
- Today (2025)
- 839,977 people
- By 2030
- 891,768 · +6.2%
- By 2040
- 988,894 · +17.7%
- By 2050
- 1,074,583 · +27.9%
- By 2075
- 1,245,026 · +48.2%
- By 2100
- 1,303,135 · +55.1%
Race, ethnicity, and origin ACS 2023
- Neighborhood character
- Diverse neighborhood (Simpson 0.56)
- Race & ethnicity
- Black 62% White 22% Asian 6% Hispanic / Latino 5% Two or more races 5%
- Common ancestry
- Slovak 1% Lithuanian 1% Serbian 1%
- Foreign-born
- 14% · Canada, China, South Korea
- Languages at home
- 86% English-only · Spanish 5% Other Indo-European 2% Other Asian/Pacific 1%
Political lean MEDSL · DeKalb
- 2024 margin
- Solid D (+64.8) · D 81.9% · R 17.1% · Other 1.0%
- 2008→2024 swing
- +6.1pp toward D · 2008: 58.6pp · 2024: 64.8pp
- All cycles
- 2024: D+64.8 2020: D+67.4 2016: D+64.8 2012: D+56.8 2008: D+58.6
Not yet ingested
- Civics
- —
Market trends
- HPI YoY
- ▼ -228.39%
- Current HPI
- 204.2122
- Rent YoY
- ▲ 1.30%
- Metro
- Atlanta-Sandy Springs-Alpharetta, GA
- State GDP YoY
- ▲ 2.66%
- F500 in state
- 28
Industry mix (Fortune 500 HQ in GA)
| Industry | F500 HQs | Revenue |
|---|---|---|
| Paper / Packaging | 2 | $29B |
|
||
| Retail | 1 | $160B |
|
||
| Transportation / Logistics | 1 | $91B |
|
||
| Airlines | 1 | $62B |
|
||
| Consumer Goods | 1 | $47B |
|
||
| Utilities | 1 | $25B |
|
||
Price history
+191.5% since first listed7 events — show timeline
- 2026-06-04 Listed $239,900 GAMLS
- 2026-06-04 Listed $239,900 FMLS
- 2008-03-11 Sold (MLS) $82,571 FMLS
- 2007-11-06 Listed $88,900 FMLS
- 2004-04-07 Sold (Public Records) $135,000 Public Records
- 1994-01-20 Sold (Public Records) $82,388 Public Records
- 1986-12-30 Sold (Public Records) $82,300 Public Records
Property tax history
-5.8%/yrLatest (2025): $872 · -6.4% YoY. Source: county tax records.
Cash-flow waterfall
monthlySold comps — $/sqft
last 12 mo · ≤1 miLoading sold comps…