 Duplex
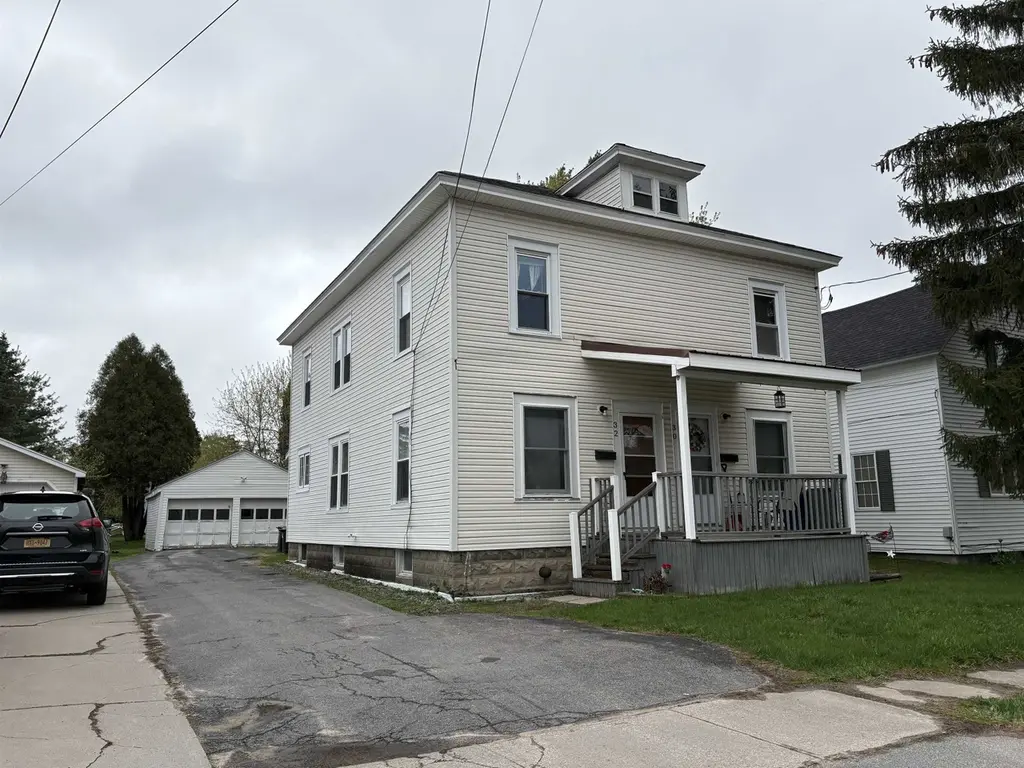
30 Mccluskey Ave · Massena, NY
Flood risk 1/10 · Minimal
- FEMA flood zone
- X
- Chance of flooding over 30 yrs
- 0.0%
- Est. flood insurance / yr
- $473 – $860
Fire risk 3/10 · Minor
- Est. fire insurance / yr
- $691 – $1,283
Heat risk 2/10 · Minimal
- Hot days now (above 93°F)
- 7 days/yr
- Hot days in 30 yrs
- 15 days/yr
Wind risk 1/10 · Minimal
- Chance of severe wind over 30 yrs
- —
Air-quality risk 2/10 · Minimal
- Unhealthy air days now
- 1 days/yr
- Unhealthy air days in 30 yrs
- 1 days/yr
Risk factors via First Street. Map © Google.
Why this score? — see what drove the C+ grade
The composite is a weighted blend of 9 inputs, each scored 0–100. Each bar is that input's sub-score; the figure is the points it added to the 100-point composite (weight × sub-score).
- Cash flow +30.0/30.0
- DSCR +10.0/10.0
- 1% rule +9.9/10.0
- Schools +3.9/10.0
- Livability +3.7/5.0
- Rent growth +2.5/5.0
- Condition / age +2.5/5.0
- ARV discount +1.9/15.0
- Appreciation +0.0/10.0
$139,000
🖨 Deal sheet 📄 Offer letter ✓ Due diligence
Multi-family units
County records classify this as Multi-Family (2-4 Unit). Listing-text estimate: 2 units. confirmed
Listing remarks MLS
Vacant side by side apartment house has been fully remodeled with ceramic tile flooring, new bathrooms, kitchens. .. what a great place to start and have income from an apartment. .. check this out for $79,500.. .just move in.
Key facts
- Hardwood flooring
- Two spacious units
- Half bath
Tags
Property features AI
Exterior
- Parking: Detached 2-car garage
- Utilities: Public water; Public sewer; Cable available; Natural gas available
- Home design: Duplex; 2 stories
- Construction: Shingle roof
- Exterior features: Level lot
Interior
- Kitchen: Refrigerator; Cooktop
- Flooring: Carpet; Ceramic tile; Tile; Wood
- Bathrooms: 2 full bathrooms; 2 half bathrooms
- Heating & cooling: Forced air heating; Natural gas available
- Interior features: Electric water heater; Basement present
- Laundry & utility: Laundry on main level
Neighborhood map
What this means for you Summary
Snapshot
- This is a 2 × 3-bed/2.5-bath units multifamily listed at $139k.
Deal economics
- At list price, monthly cash flow is $579 ($7k/yr) — positive. Per door: $290/mo.
- The deal already cash-flows at list — no discount required.
- Meets the 1% rule at list price ($2k rent vs $139k).
- Recommended offer: $135k (3.0% below list) — sets the bar for market timing.
- Cap rate 11.3% vs local median 5.3% in Massena — top-decile yield for the area; either an underpriced asset or a hidden risk that comps aren't pricing in. Stress-test before assuming the spread holds.
Location & tenants
- Location reads 73/100 on livability (#330 in NY) — a middle-class / working-renter tenant base. Strengths: cost of living A+, housing A+, health & safety A+; Watch: amenities D, crime D-, commute F.
- Massena Central School District (town): math 43% / reading 49% proficiency, ranked #456 of 590 in NY (top 77%) — families likely to look elsewhere, expect single-tenant / working-renter base with shorter leases.
- Market conditions: 171 active listings in the ZIP; 215 units permitted in St. Lawrence County in 2024 (0 in 5+ unit buildings).
Forward outlook
- Local home prices are declining (-3.0%/yr); year-one equity from $961 of loan paydown is wiped out by about $4k of value loss. Plan a longer hold.
- St. Lawrence County population projected at -14% by 2050 — secular population decline; favor cash flow + early exit over multi-decade hold.
- At projected returns (-3.0% appreciation + 3.0% rent growth), your $39k cash investment doubles in ~7 years — after that, you're playing with house money.
Negotiation context
- It's been on market 43 days — a 3% lower offer ($135k) is reasonable based on typical stale-listing flexibility.
- 2 sale attempts since 10y ago with the ask held roughly flat each time — persistent listings suggest the price (not the market) is what's stuck; bring a comps-based counter.
- Current owner paid $82k; list at $139k implies a 70% gain — meaningful room to come down on a strong offer.
Risks & watch-outs
- Watch-outs: built in 1915 — expect roof / HVAC / electrical / plumbing capex.
Questions for the listing agent
- It's been on market 43 days. Have you received any prior offers? Is the seller open to a 3% concession, seller financing, or rate buy-down credit?
- Can we see the unit-by-unit rent roll, current vacancy, and any below-market leases? What's the average tenancy length?
- What capital expenditures (roof, boiler, parking lot, exteriors) have been made in the last 5 years, and what's planned in the next 2?
- Built in 1915 — when were the roof, HVAC, electrical panel, plumbing, and water heater last replaced?
- Is there a deadline driving the sale (1031 exchange, divorce, estate, relocation)? That informs how much negotiation room exists.
- Crime grade is D in this area — have there been break-ins, vandalism, or insurance claims at this property in the last 3 years? What carrier currently insures it and at what premium?
- What's the average days-on-market for RENTAL listings here right now (not sales)? A rising rental-DOM trend means longer vacancies and softer asking-rent achievability than the comps imply.
- What's the recent tenant-quality profile in this submarket — average credit score on applications, eviction rate, late-payment / NSF rate, and stable-employment percentage? A property-management company in the area should have these aggregated.
- How much new apartment / multifamily construction is in the pipeline within 1–3 miles? Heavy new supply (>2% of stock underway) typically softens rents 12–24 months out; light construction supports rent growth.
Investment metrics
- 1% rule
- 1.49% ✓
- Cap rate
- 11.29%
- Cash-on-cash
- 17.85%
- DSCR
- 1.79
- GRM
- 5.6
CMA / ARV
- ARV (median comp)
- $123,700
- List price
- $139,000
- Delta
- 12.37%
- Verdict
- OVERPRICED
- Comps
- 17 within 1.0 mi
Projected returns pro-forma
-3.0% appreciation · 3.0% rent growth · sell at horizon
- IRR
- 9.4%
- Equity multiple
- 1.37×
- Total profit
- $14,446
- Equity at exit
- $20,725
- IRR
- 18.6%
- Equity multiple
- 2.55×
- Total profit
- $60,440
- Equity at exit
- $12,018
Cash invested: $38,920 (down + closing). Projections, not guarantees.
Landlord ↔ Tenant lean methodology
- Overall (STATE)
- 15 Strongly Tenant-Friendly
- State New York
- 15 Strongly Tenant-Friendly · D+10
- County
- — inherits STATE
- City
- — inherits STATE
ZIP-level market 13662
- Home prices YoY
- -6.4%
- Active inventory
- 171
- Price-to-rent
- 11.2×
Monthly cashflow live
- Estimated rent
- $2,074 medium interval (Pro) →
- Mortgage (P&I)
- −$729
- Tax from tax record
- −$273 /mo · $3,271/yr
- Insurance
- −$58
- HOA
- −$0
- Vacancy / Maint / Mgmt
- −$436
- Net cashflow
- $579
Break-even live
2-unit breakdown (identical units grouped — click to expand)
| Units | Beds | Baths | Est. rent |
|---|---|---|---|
| 2× units | 3 | 2.5 | $2,074 |
| #1 | 3 | 2.5 | $1,037 |
| #2 | 3 | 2.5 | $1,037 |
| Total (2 units) | $2,074 | ||
UW: 25.0% down · 7.5% · 30yr · 1.5% tax · 5.0% vac · 8.0% maint · 8.0% mgmt
Financing live
Cash to close
- Down payment
- $34,750
- Closing costs
- $4,170
- Reserves months
- —
- Total cash needed
- —
Loan-product check · same deal, 3 products live
Conventional
25% down · 7.5% · 30yr
- Down + closing
- —
- Monthly P&I
- —
- Monthly cashflow
- —
- DSCR
- —
- Eligible?
- —
Personal DTI + credit; lowest rate.
DSCR
20% down · 8.5% · 30yr
- Down + closing
- —
- Monthly P&I
- —
- Monthly cashflow
- —
- DSCR
- —
- Eligible?
- —
No personal income docs; deal must DSCR.
Hard money
10% down · 12.0% · 12mo
- Down + closing
- —
- Monthly P&I
- —
- Monthly cashflow
- —
- DSCR
- —
- Eligible?
- —
Short-term bridge; refi at stabilization.
Listing history 18 events
-
2026-06-18days on market $139,000 Active 43 DOM
-
2026-06-17days on market $139,000 Active 42 DOM
-
2026-06-16days on market $139,000 Active 41 DOM
-
2026-06-15days on market $139,000 Active 40 DOM
-
2026-06-13days on market $139,000 Active 38 DOM
-
2026-06-12days on market $139,000 Active 37 DOM
-
2026-06-09days on market $139,000 Active 34 DOM
-
2026-06-08days on market $139,000 Active 33 DOM
-
2026-06-07days on market $139,000 Active 32 DOM
-
2026-06-04days on market $139,000 Active 28 DOM
-
2026-06-02days on market $139,000 Active 27 DOM
-
2026-06-01days on market $139,000 Active 26 DOM
-
2026-05-31days on market $139,000 Active 25 DOM
-
2026-05-06$139,000 Active 1172-char remark
-
2022-01-20soldstatus $82,000
-
2017-11-03soldstatus $60,000 226-char remark
Show marketing remark (226 chars)
Vacant side by side apartment house has been fully remodeled with ceramic tile flooring, new bathrooms, kitchens. .. what a great place to start and have income from an apartment. .. check this out for $79,500.. .just move in.
-
2017-11-03soldstatus $60,000
Show marketing remark (226 chars)
Vacant side by side apartment house has been fully remodeled with ceramic tile flooring, new bathrooms, kitchens. .. what a great place to start and have income from an apartment. .. check this out for $79,500.. .just move in.
-
2016-08-01$79,500 226-char remark
Show marketing remark (226 chars)
Vacant side by side apartment house has been fully remodeled with ceramic tile flooring, new bathrooms, kitchens. .. what a great place to start and have income from an apartment. .. check this out for $79,500.. .just move in.
ⓘ Source: listings_history table (triggers on properties + properties_extension) + one-shot
backfill from property_details.listing_events for pre-trigger history.
Tax reassessment forecast NY · Partial reset (capped growth)
- Current annual tax
- $3,271 · $273/mo
- Projected year-2 tax
- $3,271 · $273/mo
- Expected delta
- $0/yr ($0/mo · 0.0%)
ⓘ Screening estimate from a state-policy table — verify with the county assessor before closing.
Climate risk First Street
- Flood 1/10 Low FEMA zone X · 0% chance over 30 yrs
- Wildfire 3/10 Moderate
- Heat 2/10 Low 7 d/yr ≥93°F today · 15 d/yr by 30 yrs out
- Wind 1/10 Low
- Air quality 2/10 Low 1 unhealthy d/yr today · 1 by 30 yrs out
Nearby sold comps map
Loading sold comps map…
Walkable amenities ~0.75 mi
Loading nearby amenities…
Taxation est. · year 1
- Rental income
- $24,888
- − Mortgage interest
- −$7,786
- − Property taxes
- −$3,271
- − Insurance
- −$695
- − Repairs & maintenance
- −$1,991
- − Management
- −$1,991
- − Depreciation
- −$4,044
- Taxable income
- $5,110
- Est. tax owed @ 24.0%
- −$1,226
- After-tax cash flow
- $5,722/yr
For passive investors: Depreciation is non-cash, so a rental often shows a tax loss while cash-flowing — sheltering income. Rental losses are passive: they offset passive income freely, and up to $25,000/yr can offset ordinary (W-2) income if you actively participate and your MAGI is under $100k (phasing out to $0 by $150k); unused losses carry forward. On sale, claimed depreciation is recaptured at up to 25%, and gains may owe capital-gains tax (a 1031 exchange can defer both). Figures are a year-1 estimate at your 24.0% rate — not tax advice; consult a CPA.
Schools (NCES district)
- District
- Massena Central School District
- NCES district ID
- 3618660
- Math proficiency
- 43% ▼ -10.00%
- Reading proficiency
- 49% ▲ 1.00%
- Median HH income
- $42,610
- Composite
- 38.75/100
- National rank
- #4123
- State rank
- #456 of 590 in NY
Livability — Massena
- Score
- 73/100
- State rank
- #330
- US rank
- #5449
Category grades
Schools grade is shown separately in the Schools card above.
Census & demographics
- Census place
- Massena, NY
- City population
- 15,737
- Population (ZIP)
- 15,737
Population outlook (St. Lawrence County) Hauer SSP2
- Today (2025)
- 110,027 people
- By 2030
- 107,455 · -2.3%
- By 2040
- 100,492 · -8.7%
- By 2050
- 94,254 · -14.3%
- By 2075
- 80,175 · -27.1%
- By 2100
- 63,140 · -42.6%
Race, ethnicity, and origin ACS 2023
- Neighborhood character
- Predominantly White (93%)
- Race & ethnicity
- White 93% Two or more races 4% Hispanic / Latino 2%
- Common ancestry
- Lithuanian 12% Slovak 2% Romanian 2%
- Foreign-born
- 4% · Canada
- Languages at home
- 96% English-only · French/Haitian/Cajun 1% Spanish 1% Russian/Polish/Slavic 1%
Political lean MEDSL · St. Lawrence
- 2024 margin
- R (+18.0) · D 41.0% · R 59.0%
- 2008→2024 swing
- -34.3pp toward R · 2008: 16.3pp · 2024: -18.0pp
- All cycles
- 2024: R+18.0 2020: R+11.7 2016: R+10.8 2012: D+16.6 2008: D+16.3
Not yet ingested
- Civics
- —
Market trends
- HPI YoY
- ▼ -16.77%
- Current HPI
- 243.4674
- Rent YoY
- —
- Metro
- —
- State GDP YoY
- ▲ 2.60%
- F500 in state
- 92
Industry mix (Fortune 500 HQ in NY)
| Industry | F500 HQs | Revenue |
|---|---|---|
| Financial Services | 10 | $950B |
|
||
| Consumer Goods | 9 | $162B |
|
||
| Insurance | 4 | $225B |
|
||
| Telecommunications | 2 | $144B |
|
||
| Pharmaceuticals | 2 | $112B |
|
||
| Media / Entertainment | 2 | $69B |
|
||
Price history
+74.8% since first listed5 events — show timeline
- 2026-05-06 Listed $139,000 SLCMLS
- 2022-01-20 Sold (Public Records) $82,000 Public Records
- 2017-11-03 Sold (Public Records) $60,000 Public Records
- 2017-11-03 Sold (MLS) $60,000 SLCMLS
- 2016-08-01 Listed $79,500 SLCMLS
Property tax history
+1.8%/yrLatest (2025): $3,271 · -1.1% YoY. Source: county tax records.
Cash-flow waterfall
monthlySold comps — $/sqft
last 12 mo · ≤1 miLoading sold comps…