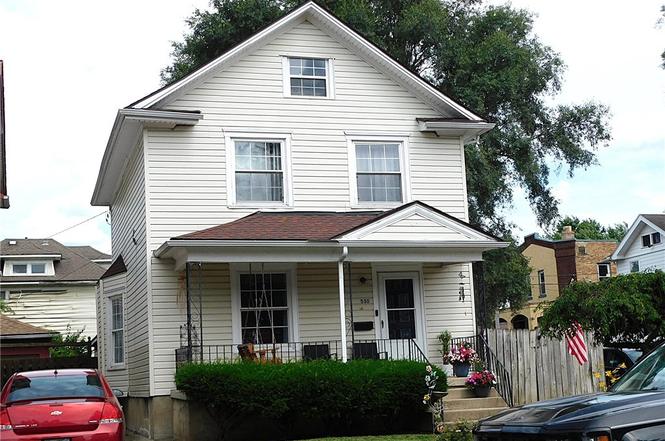
530 Saint Nicholas Ave · Dayton, OH
Flood risk 3/10 · Minor
- FEMA flood zone
- X (unshaded)
- Chance of flooding over 30 yrs
- 0.2%
- Est. flood insurance / yr
- $473 – $860
Fire risk 1/10 · Minimal
- Est. fire insurance / yr
- $713 – $1,323
Heat risk 4/10 · Minor
- Hot days now (above 101°F)
- 7 days/yr
- Hot days in 30 yrs
- 18 days/yr
Wind risk 2/10 · Minimal
- Chance of severe wind over 30 yrs
- 1.0%
Air-quality risk 3/10 · Minor
- Unhealthy air days now
- 2 days/yr
- Unhealthy air days in 30 yrs
- 4 days/yr
Risk factors via First Street. Map © Google.
Why this score? — see what drove the D grade
The composite is a weighted blend of 9 inputs, each scored 0–100. Each bar is that input's sub-score; the figure is the points it added to the 100-point composite (weight × sub-score).
- Cash flow +19.8/30.0
- DSCR +6.3/10.0
- 1% rule +5.4/10.0
- Rent growth +5.0/5.0
- Livability +3.2/5.0
- Condition / age +2.5/5.0
- Schools +1.3/10.0
- ARV discount +0.0/15.0
- Appreciation +0.0/10.0
$119,900
🖨 Deal sheet 📄 Offer letter ✓ Due diligence
Listing remarks
Attractive home with 3 bedrooms and 1.5 baths. Roof, furnace, a/c and hot water heater all updated about 5 years ago. Home has vinyl siding and vinyl windows. Property is tenant occupied. Tenant has been there for 12 years. One car detached garage has newer roof also.
Key facts
- 3,167 sq ft lot
- Garage
- Built 1910
Property features AI
Finance
- Financial info: Offered for sale
Exterior
- Parking: One-car garage
- Utilities: Natural gas heating; Central air conditioning
- Home design: Two-story home; Frame construction with vinyl siding; Below-grade unfinished area approximately 616
- Construction: Frame construction; Vinyl siding
- Exterior features: Residential lot approximately 33 x 136
Interior
- Kitchen: Main-level kitchen (approx. 13 x 11)
- Bedrooms: Three bedrooms on the second floor (approx. 12 x 11, 13 x 10, 15 x 11)
- Bathrooms: One full bathroom and one half bathroom (both on the main level)
- Heating & cooling: Forced air heating (natural gas); Central air conditioning
- Interior features: Full unfinished basement
Neighborhood map
What this means for you Summary
Snapshot
- This is a 3-bed/1.0-bath single-family listed at $120k.
Deal economics
- At list price, monthly cash flow is $143 ($2k/yr) — positive.
- The deal already cash-flows at list — no discount required.
- Meets the 1% rule at list price ($1k rent vs $120k).
Location & tenants
- Location reads 65/100 on livability (#716 in OH) — a middle-class / working-renter tenant base. Strengths: cost of living A+, housing A+, health & safety A; Watch: schools C-, amenities C-, crime F.
- Dayton City (urban): math 12% / reading 21% proficiency, ranked #641 of 656 in OH (top 98%) — low school quality limits family demand, transient renter base, plan for 1-2y turnover; 74% free/reduced lunch — lower-income household profile, screen leases tightly.
- Market conditions: Rents rising fast (+11.4%/yr); 92 active listings in the ZIP; 40 comparable units currently listed for rent nearby; rentals at typical pace (median 23d on market — plan ~3-4 weeks tenant-placement turnaround); 40% of comp listings sitting > 30 days — soft ceiling on asking rent; 907 units permitted in Montgomery County in 2024 (416 in 5+ unit buildings).
- This rent runs 32% of the median local income ($47k/yr) — at the standard rent-burdened threshold; future hikes will face affordability resistance.
Forward outlook
- Local home prices are declining (-3.0%/yr); year-one equity from $829 of loan paydown is wiped out by about $4k of value loss. Plan a longer hold.
- Montgomery County population projected at -10% by 2050 — secular population decline; favor cash flow + early exit over multi-decade hold.
- At projected returns (-3.0% appreciation + 8.0% rent growth), your $34k cash investment doubles in ~9 years — after that, you're playing with house money.
Negotiation context
- Only 1 days on market — expect competitive offers; lowballing is unlikely to land.
- Current owner paid $61k; list at $120k implies a 97% gain — meaningful room to come down on a strong offer.
Risks & watch-outs
- Watch-outs: built in 1910 — expect roof / HVAC / electrical / plumbing capex.
Questions for the listing agent
- Built in 1910 — when were the roof, HVAC, electrical panel, plumbing, and water heater last replaced?
- Is there a deadline driving the sale (1031 exchange, divorce, estate, relocation)? That informs how much negotiation room exists.
- Crime grade is F in this area — have there been break-ins, vandalism, or insurance claims at this property in the last 3 years? What carrier currently insures it and at what premium?
- The area grade is low — what's the realistic commute time and amenity access for the typical tenant pool here? Any planned neighborhood developments (good or bad) we should know about?
- What's the average days-on-market for RENTAL listings here right now (not sales)? A rising rental-DOM trend means longer vacancies and softer asking-rent achievability than the comps imply.
- What's the recent tenant-quality profile in this submarket — average credit score on applications, eviction rate, late-payment / NSF rate, and stable-employment percentage? A property-management company in the area should have these aggregated.
- How much new for-sale + rental construction is in the pipeline within 1–3 miles? Heavy new supply typically softens prices + rents 12–24 months out; constrained supply supports both.
Investment metrics
- 1% rule
- 1.04% ✓
- Cap rate
- 7.73%
- Cash-on-cash
- 5.12%
- DSCR
- 1.23
- GRM
- 8.0
CMA / ARV
- ARV (on-the-fly)
- $86,966
- Comps found
- 12
Show comp detail 12 sales within ~0.75 mi
| Address | Dist | Beds/Ba | Sqft | Sold | Price | $/sf | Match |
|---|---|---|---|---|---|---|---|
| 853 Creighton Ave | 0.33mi | 3/1.0 | 1,368 (+5%) | 2mo | $125,000 | $91 | 74 |
| 804 Linden Ave | 0.19mi | 3/2.0 | 1,395 (+8%) | 1mo | $86,000 | $62 | 74 |
| 712 Wellmeier Ave | 0.37mi | 3/1.0 | 1,390 (+7%) | 2mo | $210,000 | $151 | 70 |
| 800 Linden Ave | 0.19mi | 3/1.5 | 1,472 (+13%) | 0mo | $62,500 | $42 | 66 |
| 425 Huffman Ave | 0.58mi | 3/2.0 | 1,248 (-4%) | 1mo | $80,000 | $64 | 62 |
| 55 Illinois Ave | 0.62mi | 3/1.0 | 1,408 (+8%) | 1mo | $95,000 | $67 | 56 |
| 760 Greenlawn Ave | 0.74mi | 3/1.0 | 1,232 (-5%) | 1mo | $14,900 | $12 | 56 |
| 849 Wellmeier Ave | 0.43mi | 3/2.0 | 1,453 (+12%) | 2mo | $199,000 | $137 | 54 |
| 107 Sherman St | 0.51mi | 3/1.5 | 1,446 (+11%) | 2mo | $73,000 | $50 | 54 |
| 167 Indiana Ave | 0.68mi | 3/1.5 | 1,395 (+8%) | 2mo | $179,900 | $129 | 52 |
| 1014 Arbor Ave | 0.49mi | 3/1.5 | 1,488 (+15%) | 2mo | $99,900 | $67 | 49 |
| 128 Missouri Ave | 0.75mi | 3/2.0 | 1,415 (+9%) | 2mo | $165,000 | $117 | 45 |
Match score weights: distance 35% · size 25% · config 20% · recency 20%. Top-matched comps best support the ARV.
Projected returns pro-forma
-3.0% appreciation · 8.0% rent growth · sell at horizon
- IRR
- -2.8%
- Equity multiple
- 0.89×
- Total profit
- $-3,712
- Equity at exit
- $17,877
- IRR
- 11.8%
- Equity multiple
- 2.15×
- Total profit
- $38,519
- Equity at exit
- $10,367
Cash invested: $33,572 (down + closing). Projections, not guarantees.
Landlord ↔ Tenant lean methodology
- Overall (STATE)
- 73 Landlord-Friendly
- State Ohio
- 73 Landlord-Friendly · R+6
- County
- — inherits STATE
- City
- — inherits STATE
ZIP-level market 45410
- Home prices YoY
- -21.4%
- Rents YoY
- 11.4%
- Active inventory
- 92
- Price-to-rent
- 8.0×
Monthly cashflow live
- Estimated rent
- $1,243 high interval (Pro) →
- Mortgage (P&I)
- −$629
- Tax from tax record
- −$160 /mo · $1,922/yr
- Insurance
- −$50
- HOA
- −$0
- Vacancy / Maint / Mgmt
- −$261
- Net cashflow
- $143
Break-even live
UW: 25.0% down · 7.5% · 30yr · 1.5% tax · 5.0% vac · 8.0% maint · 8.0% mgmt
Financing live
Cash to close
- Down payment
- $29,975
- Closing costs
- $3,597
- Reserves months
- —
- Total cash needed
- —
Loan-product check · same deal, 3 products live
Conventional
25% down · 7.5% · 30yr
- Down + closing
- —
- Monthly P&I
- —
- Monthly cashflow
- —
- DSCR
- —
- Eligible?
- —
Personal DTI + credit; lowest rate.
DSCR
20% down · 8.5% · 30yr
- Down + closing
- —
- Monthly P&I
- —
- Monthly cashflow
- —
- DSCR
- —
- Eligible?
- —
No personal income docs; deal must DSCR.
Hard money
10% down · 12.0% · 12mo
- Down + closing
- —
- Monthly P&I
- —
- Monthly cashflow
- —
- DSCR
- —
- Eligible?
- —
Short-term bridge; refi at stabilization.
Rent comps 40 comps
| Address | Beds | Baths | Sqft | Rent | $/sqft | DOM | Units | Dist |
|---|---|---|---|---|---|---|---|---|
| 637 Creighton Ave Dayton, OH | 3.0 | 1.0 | 1144 | $1,350 | $1.18 | 14d | 1 | 0.11mi |
| 2012 Saint Charles Ave Dayton, OH | 2.0 | 1.0 | 945 | $1,250 | $1.32 | 43d | 1 | 0.28mi |
| 511 Parrot St Dayton, OH | 3.0 | 1.5 | 1618 | $1,100 | $0.68 | 14d | 1 | 0.32mi |
| 424 Bantz Ct Dayton, OH | 3.0 | 1.0 | 1192 | $1,050 | $0.88 | 3d | 1 | 0.33mi |
| 1515 Wyoming St Dayton, OH | 3.0 | 1.0 | 1400 | $1,000 | $0.71 | 43d | 1 | 0.41mi |
| 115 Livingston Ave Dayton, OH | 3.0 | 1.0 | 1624 | $1,450 | $0.89 | 44d | 1 | 0.44mi |
| 1101 Phillips Ave Unit 1101 Dayton, OH | 3.0 | 1.5 | 1300 | $1,450 | $1.12 | 43d | 1 | 0.46mi |
| 1411 Wyoming St Dayton, OH | 3.0 | 1.0 | 1256 | $1,095 | $0.87 | 2d | 1 | 0.46mi |
| 706 Kolping Ave Unit 706 Dayton, OH | 3.0 | 1.5 | 1172 | $1,300 | $1.11 | 2d | 1 | 0.46mi |
| 854 Santa Cruz Ave Dayton, OH | 3.0 | 1.0 | 1060 | $1,300 | $1.23 | 43d | 1 | 0.50mi |
| 1354 Ohmer St Unit 1354A Dayton, OH | 2.0 | 1.0 | 900 | $675 | $0.75 | 23d | 1 | 0.52mi |
| 1354 Ohmer St Unit 1356C Dayton, OH | 2.0 | 2.0 | 1200 | $900 | $0.75 | 43d | 1 | 0.52mi |
| 1354 Ohmer St Unit 1354C Dayton, OH | 2.0 | 1.0 | 900 | $700 | $0.78 | 43d | 1 | 0.52mi |
| 1300 Chardon Ct Dayton, OH | 2.0 | 1.0 | 970 | $1,200 | $1.24 | 2d | 1 | 0.57mi |
| 314 Sheridan Ave Dayton, OH | 3.0 | 1.0 | 1258 | $1,150 | $0.91 | 3d | 1 | 0.60mi |
| 201 Pleasant Ave Unit 203 Dayton, OH | 2.0 | 1.0 | 1250 | $975 | $0.78 | 23d | 1 | 0.60mi |
| 2306 Alice St Dayton, OH | 3.0 | 1.0 | 918 | $1,200 | $1.31 | 3d | 1 | 0.62mi |
| 136 Indiana Ave Dayton, OH | 3.0 | 1.0 | 1194 | $1,250 | $1.05 | 23d | 1 | 0.63mi |
| 31 Bidleman St Dayton, OH | 2.0 | 1.5 | 1568 | $1,100 | $0.70 | 43d | 1 | 0.68mi |
| 15 John St Unit 15 Dayton, OH | 2.0 | 1.0 | 1200 | $800 | $0.67 | 23d | 1 | 0.68mi |
| 224 S Irwin St Unit 226 Dayton, OH | 2.0 | 1.0 | 992 | $900 | $0.91 | 3d | 1 | 0.72mi |
| 1430 Coventry Rd Dayton, OH | 2.0 | 1.0 | 1106 | $1,125 | $1.02 | 14d | 1 | 0.73mi |
| 2200 E 5th St Dayton, OH | 2.0 | 1.0 | 1000 | $825 | $0.82 | 23d | 1 | 0.74mi |
| 20 Lucerne Ave Dayton, OH | 3.0 | 1.0 | 1378 | $1,200 | $0.87 | 43d | 1 | 0.74mi |
| 120 S Monmouth St Dayton, OH | 2.0 | 1.0 | 1000 | $950 | $0.95 | 43d | 1 | 0.77mi |
| 1020 Walnut Hill Pl Dayton, OH | 3.0 | 1.0 | 1200 | $1,400 | $1.17 | 43d | 1 | 0.77mi |
| 1038 Walnut Hill Pl Dayton, OH | 3.0 | 1.0 | 1232 | $1,095 | $0.89 | 43d | 1 | 0.78mi |
| 210 S Hedges St Dayton, OH | 2.0 | 1.5 | 1048 | $1,045 | $1.00 | 21d | 1 | 0.82mi |
| 1410 Phillips Ave Unit 1 Dayton, OH | 2.0 | 1.0 | 1000 | $950 | $0.95 | 43d | 1 | 0.82mi |
| 32 Gebhart St Dayton, OH | 4.0 | 1.0 | 1800 | $1,400 | $0.78 | 14d | 1 | 0.84mi |
| 313 Illinois Ave Dayton, OH | 3.0 | 1.0 | 1142 | $975 | $0.85 | 3d | 1 | 0.86mi |
| 2600 Wayne Ave Dayton, OH | 4.0 | 1.5 | 1328 | $1,500 | $1.13 | 23d | 1 | 0.87mi |
| 2114 Wayne Ave Dayton, OH | 4.0 | 2.0 | 1723 | $1,595 | $0.93 | 43d | 1 | 0.91mi |
| 2132 Wayne Ave Dayton, OH | 3.0 | 2.0 | 1484 | $1,350 | $0.91 | 2d | 1 | 0.91mi |
| 1520 S Smithville Rd Dayton, OH | 3.0 | 2.0 | 1481 | $1,345 | $0.91 | 2d | 1 | 0.92mi |
| 3100 Linden Ave Unit 3102 Dayton, OH | 2.0 | 1.0 | 1035 | $995 | $0.96 | 43d | 1 | 0.94mi |
| 1620 Gummer Ave Dayton, OH | 2.0 | 1.0 | 875 | $950 | $1.09 | 3d | 1 | 0.94mi |
| 29 N Garfield St Dayton, OH | 3.0 | 1.0 | 1092 | $1,000 | $0.92 | 23d | 1 | 0.98mi |
| 2029 Brookline Ave Dayton, OH | 2.0 | 1.0 | 990 | $1,270 | $1.28 | 14d | 1 | 1.03mi |
| 920 E Stewart St Dayton, OH | 4.0 | 1.0 | 1322 | $1,425 | $1.08 | 43d | 1 | 1.03mi |
Listing history 2 events
-
2026-06-17remarks 268-char remark
-
2026-06-17$119,900 Pending 1 DOM
ⓘ Source: listings_history table (triggers on properties + properties_extension) + one-shot
backfill from property_details.listing_events for pre-trigger history.
Tax reassessment forecast OH · Partial reset (capped growth)
- Current annual tax
- $1,922 · $160/mo
- Projected year-2 tax
- $1,922 · $160/mo
- Expected delta
- $0/yr ($0/mo · 0.0%)
ⓘ Screening estimate from a state-policy table — verify with the county assessor before closing.
Climate risk First Street
- Flood 3/10 Moderate FEMA zone X (unshaded) · 20% chance over 30 yrs
- Wildfire 1/10 Low
- Heat 4/10 Moderate 7 d/yr ≥101°F today · 18 d/yr by 30 yrs out
- Wind 2/10 Low 100% chance of damaging wind over 30 yrs
- Air quality 3/10 Moderate 2 unhealthy d/yr today · 4 by 30 yrs out
Nearby sold comps map
Loading sold comps map…
Walkable amenities ~0.75 mi
Loading nearby amenities…
Taxation est. · year 1
- Rental income
- $14,919
- − Mortgage interest
- −$6,716
- − Property taxes
- −$1,922
- − Insurance
- −$600
- − Repairs & maintenance
- −$1,194
- − Management
- −$1,194
- − Depreciation
- −$3,488
- Taxable loss
- −$194
- Est. tax savings @ 24.0%
- +$47
- After-tax cash flow
- $1,765/yr
For passive investors: Depreciation is non-cash, so a rental often shows a tax loss while cash-flowing — sheltering income. Rental losses are passive: they offset passive income freely, and up to $25,000/yr can offset ordinary (W-2) income if you actively participate and your MAGI is under $100k (phasing out to $0 by $150k); unused losses carry forward. On sale, claimed depreciation is recaptured at up to 25%, and gains may owe capital-gains tax (a 1031 exchange can defer both). Figures are a year-1 estimate at your 24.0% rate — not tax advice; consult a CPA.
Schools (NCES district)
- District
- Dayton City
- NCES district ID
- 3904384
- Math proficiency
- 12% ▼ -12.00%
- Reading proficiency
- 21% ▼ -11.00%
- Median HH income
- $28,688
- Composite
- 12.94/100
- National rank
- #9579
- State rank
- #641 of 656 in OH
Livability — Dayton
- Score
- 65/100
- State rank
- #716
- US rank
- #12895
Category grades
Schools grade is shown separately in the Schools card above.
Census & demographics
- Census place
- Dayton, OH
- County
- Montgomery County · 459,541 people
- City population
- 164,387
- Metro
- Dayton-Kettering, OH
- Population (ZIP)
- 14,694
- Household income
- $46,651
- Rent vs Own
- Severe rent burden
- 961.0
Population outlook (Montgomery County) Hauer SSP2
- Today (2025)
- 523,241 people
- By 2030
- 514,948 · -1.6%
- By 2040
- 493,378 · -5.7%
- By 2050
- 469,639 · -10.2%
- By 2075
- 418,360 · -20.0%
- By 2100
- 353,315 · -32.5%
Race, ethnicity, and origin ACS 2023
- Neighborhood character
- Predominantly White (71%)
- Race & ethnicity
- White 71% Black 15% Hispanic / Latino 7% Two or more races 6% Asian 1%
- Hispanic origin (detail)
- Mexican 3%
- Common ancestry
- Lithuanian 2% Iranian 2% Slovak 2%
- Foreign-born
- 5% · Canada, United Kingdom
- Languages at home
- 91% English-only · Spanish 6% Tagalog/Filipino 1% Other Asian/Pacific 1%
Political lean MEDSL · Montgomery
- 2024 margin
- Toss-up / Even · D 49.8% · R 49.3%
- 2008→2024 swing
- -5.8pp toward R · 2008: 6.2pp · 2024: 0.5pp
- All cycles
- 2024: D+0.5 2020: D+2.2 2016: R+1.2 2012: D+3.1 2008: D+6.2
Not yet ingested
- Civics
- —
Market trends
- HPI YoY
- ▼ -100.61%
- Current HPI
- 369.3938
- Rent YoY
- ▲ 11.37%
- Metro
- Dayton-Kettering, OH
- State GDP YoY
- ▲ 1.98%
- F500 in state
- 48
Industry mix (Fortune 500 HQ in OH)
| Industry | F500 HQs | Revenue |
|---|---|---|
| Insurance | 3 | $145B |
|
||
| Industrial Machinery | 3 | $49B |
|
||
| Financial Services | 3 | $24B |
|
||
| Consumer Goods | 2 | $93B |
|
||
| Aerospace / Defense | 2 | $47B |
|
||
| Utilities | 2 | $33B |
|
||
Price history
+211.4% since first listed4 events — show timeline
- 2026-06-17 Pending — Dayton MLS
- 2026-06-16 Listed $119,900 Dayton MLS
- 1993-06-04 Sold (Public Records) $61,000 Public Records
- 1991-07-12 Sold (Public Records) $38,500 Public Records
Property tax history
+2.4%/yrLatest (2025): $1,922 · -0.2% YoY. Source: county tax records.
Cash-flow waterfall
monthlySold comps — $/sqft
last 12 mo · ≤1 miLoading sold comps…