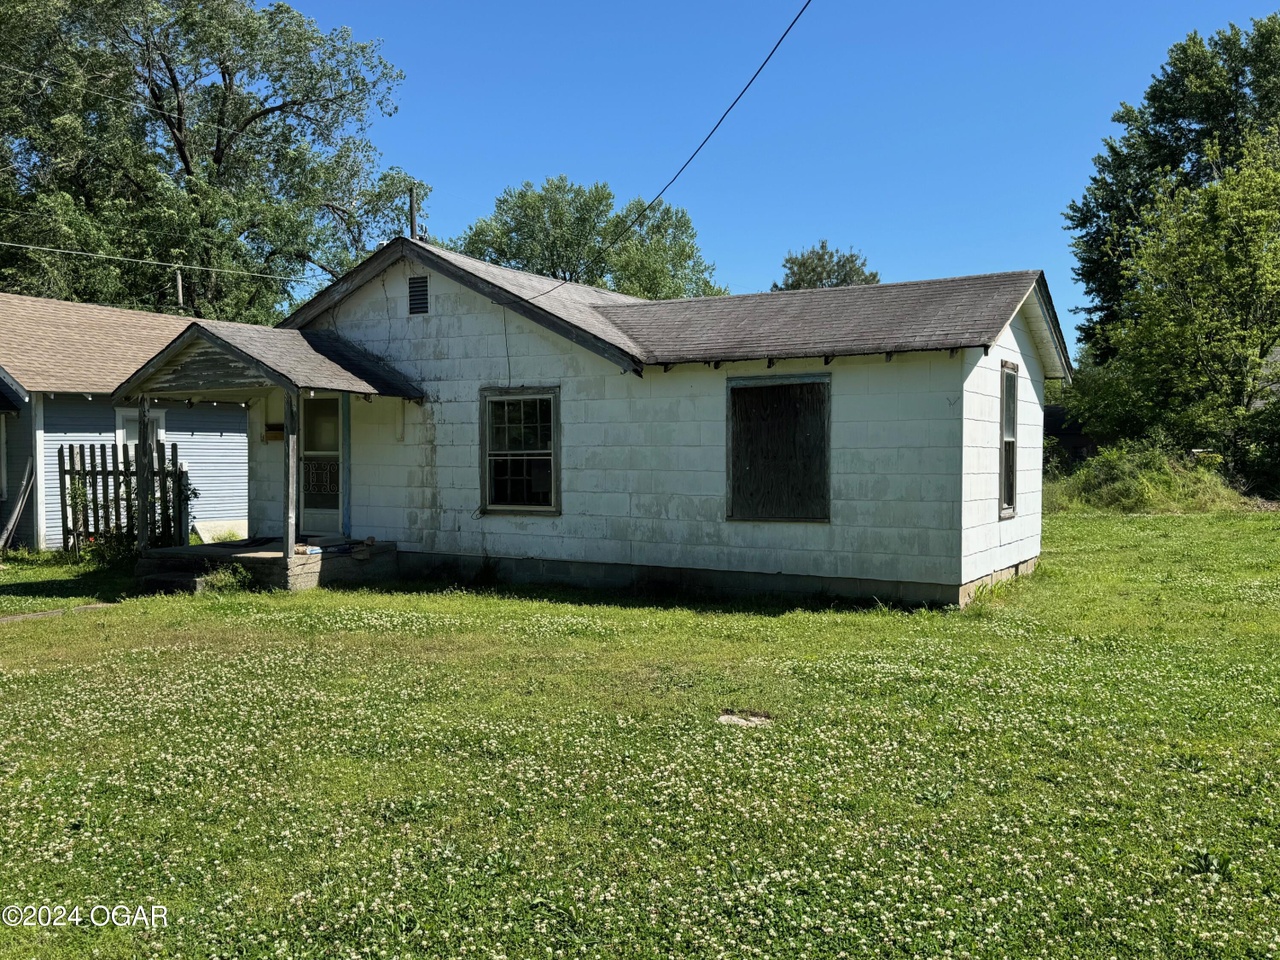
627 W 6th St · Baxter Springs, KS
Flood risk 1/10 · Minimal
- FEMA flood zone
- X (unshaded)
- Chance of flooding over 30 yrs
- 0.0%
- Est. flood insurance / yr
- $507 – $1,088
Fire risk 7/10 · Major
- Est. fire insurance / yr
- $1,154 – $2,142
Heat risk 5/10 · Moderate
- Hot days now (above 108°F)
- 7 days/yr
- Hot days in 30 yrs
- 20 days/yr
Wind risk 2/10 · Minimal
- Chance of severe wind over 30 yrs
- 2.0%
Air-quality risk 2/10 · Minimal
- Unhealthy air days now
- 1 days/yr
- Unhealthy air days in 30 yrs
- 1 days/yr
Risk factors via First Street. Map © Google.
Why this score? — see what drove the B- grade
The composite is a weighted blend of 9 inputs, each scored 0–100. Each bar is that input's sub-score; the figure is the points it added to the 100-point composite (weight × sub-score).
- Cash flow +30.0/30.0
- 1% rule +10.0/10.0
- DSCR +10.0/10.0
- ARV discount +7.5/15.0
- Livability +3.8/5.0
- Schools +2.9/10.0
- Rent growth +2.5/5.0
- Condition / age +2.5/5.0
- Appreciation +0.0/10.0
$19,900
🖨 Deal sheet 📄 Offer letter ✓ Due diligence
Key facts
- Selling as-is
- 5,200 sq ft lot
- Built 1925
Tags
Neighborhood map
What this means for you Summary
Snapshot
- This is a 2-bed/1.0-bath single-family listed at $20k.
Deal economics
- At list price, monthly cash flow is $396 ($5k/yr) — positive.
- The deal already cash-flows at list — no discount required.
- Meets the 1% rule at list price ($649 rent vs $20k).
- Recommended offer: $19k (3.0% below list) — sets the bar for market timing.
Location & tenants
- Location reads 75/100 on livability (#63 in KS, #3,952 nationally) — a middle-class / working-renter tenant base. Strengths: cost of living A+, housing A+, health & safety A+; Watch: employment D, schools F, amenities F.
- Baxter Springs (town): math 31% / reading 39% proficiency, ranked #64 of 169 in KS (top 38%) — families likely to look elsewhere, expect single-tenant / working-renter base with shorter leases.
- Market conditions: 54 active listings in the ZIP; 4 comparable units currently listed for rent nearby; rentals at typical pace (median 21d on market — plan ~3-4 weeks tenant-placement turnaround); 17 units permitted in Cherokee County in 2024 (0 in 5+ unit buildings).
Forward outlook
- Local home prices are declining (-3.0%/yr); year-one equity from $138 of loan paydown is wiped out by about $597 of value loss. Plan a longer hold.
- Cherokee County population projected at -26% by 2050 — secular population decline; favor cash flow + early exit over multi-decade hold.
- At projected returns (-3.0% appreciation + 3.0% rent growth), your $6k cash investment doubles in ~2 years — after that, you're playing with house money.
Negotiation context
- It's been on market 54 days — a 3% lower offer ($19k) is reasonable based on typical stale-listing flexibility.
Risks & watch-outs
- Watch-outs: built in 1925 — expect roof / HVAC / electrical / plumbing capex.
- Climate carrying-cost: major wildfire risk; extreme-heat days projected 7→20/yr by 2055 (HVAC capex compounding) — expect insurance premiums to compound above CPI over the hold.
Questions for the listing agent
- It's been on market 54 days. Have you received any prior offers? Is the seller open to a 3% concession, seller financing, or rate buy-down credit?
- Built in 1925 — when were the roof, HVAC, electrical panel, plumbing, and water heater last replaced?
- Is there a deadline driving the sale (1031 exchange, divorce, estate, relocation)? That informs how much negotiation room exists.
- Schools are F-rated, which usually means shorter tenancies and higher turnover. Who's the typical renter profile here, and what's been the actual vacancy rate?
- What's the average days-on-market for RENTAL listings here right now (not sales)? A rising rental-DOM trend means longer vacancies and softer asking-rent achievability than the comps imply.
- What's the recent tenant-quality profile in this submarket — average credit score on applications, eviction rate, late-payment / NSF rate, and stable-employment percentage? A property-management company in the area should have these aggregated.
- How much new for-sale + rental construction is in the pipeline within 1–3 miles? Heavy new supply typically softens prices + rents 12–24 months out; constrained supply supports both.
Investment metrics
- 1% rule
- 3.26% ✓
- Cap rate
- 30.17%
- Cash-on-cash
- 85.29%
- DSCR
- 4.79
- GRM
- 2.6
CMA / ARV
- ARV (on-the-fly)
- $90,083
- Comps found
- 1
Show comp detail 1 sale within ~0.75 mi
| Address | Dist | Beds/Ba | Sqft | Sold | Price | $/sf | Match |
|---|---|---|---|---|---|---|---|
| 421 W 6th St | 0.16mi | 2/1.0 | 800 (+6%) | 7mo | $94,900 | $119 | 77 |
Match score weights: distance 35% · size 25% · config 20% · recency 20%. Top-matched comps best support the ARV.
Projected returns pro-forma
-3.0% appreciation · 3.0% rent growth · sell at horizon
- IRR
- 85.7%
- Equity multiple
- 4.95×
- Total profit
- $21,995
- Equity at exit
- $2,967
- IRR
- 88.9%
- Equity multiple
- 10.26×
- Total profit
- $51,618
- Equity at exit
- $1,721
Cash invested: $5,572 (down + closing). Projections, not guarantees.
Landlord ↔ Tenant lean methodology
- Overall (STATE)
- 83 Strongly Landlord-Friendly
- State Kansas
- 83 Strongly Landlord-Friendly · R+10
- County
- — inherits STATE
- City
- — inherits STATE
ZIP-level market 66713
- Home prices YoY
- -17.7%
- Active inventory
- 54
- Price-to-rent
- 2.6×
Monthly cashflow live
- Estimated rent
- $649 medium interval (Pro) →
- Mortgage (P&I)
- −$104
- Tax from tax record
- −$4 /mo · $44/yr
- Insurance
- −$8
- HOA
- −$0
- Vacancy / Maint / Mgmt
- −$136
- Net cashflow
- $396
Break-even live
UW: 25.0% down · 7.5% · 30yr · 1.5% tax · 5.0% vac · 8.0% maint · 8.0% mgmt
Financing live
Cash to close
- Down payment
- $4,975
- Closing costs
- $597
- Reserves months
- —
- Total cash needed
- —
Loan-product check · same deal, 3 products live
Conventional
25% down · 7.5% · 30yr
- Down + closing
- —
- Monthly P&I
- —
- Monthly cashflow
- —
- DSCR
- —
- Eligible?
- —
Personal DTI + credit; lowest rate.
DSCR
20% down · 8.5% · 30yr
- Down + closing
- —
- Monthly P&I
- —
- Monthly cashflow
- —
- DSCR
- —
- Eligible?
- —
No personal income docs; deal must DSCR.
Hard money
10% down · 12.0% · 12mo
- Down + closing
- —
- Monthly P&I
- —
- Monthly cashflow
- —
- DSCR
- —
- Eligible?
- —
Short-term bridge; refi at stabilization.
Rent comps 4 comps
| Address | Beds | Baths | Sqft | Rent | $/sqft | DOM | Units | Dist |
|---|---|---|---|---|---|---|---|---|
| 126 E 13th St Apt 8 Baxter Springs, KS | 1.0 | 1.0 | 700 | $650 | $0.93 | 20d | 1 | 0.65mi |
| 1520 Cleveland Ave Unit 2-206 Baxter Springs, KS | 1.0 | 1.0 | 643 | $598 | $0.93 | 20d | 1 | 0.87mi |
| 1520 Cleveland Ave Unit 2-302 Baxter Springs, KS | 2.0 | 1.0 | 989 | $795 | $0.80 | 20d | 1 | 0.87mi |
| 1520 Cleveland Ave Unit 1-003 Baxter Springs, KS | 1.0 | 1.0 | 932 | $561 | $0.60 | 20d | 1 | 0.87mi |
Listing history 2 events
-
2024-07-01status Pending
-
2024-05-07$19,900 Active
ⓘ Source: listings_history table (triggers on properties + properties_extension) + one-shot
backfill from property_details.listing_events for pre-trigger history.
Tax reassessment forecast KS · Resets to sale price
- Current annual tax
- $44 · $4/mo
- Projected year-2 tax
- $281 · $23/mo
- Expected delta
- +$237/yr (+$20/mo · 540.0%)
ⓘ Screening estimate from a state-policy table — verify with the county assessor before closing.
Climate risk First Street
- Flood 1/10 Low FEMA zone X (unshaded) · 0% chance over 30 yrs
- Wildfire 7/10 Severe
- Heat 5/10 Major 7 d/yr ≥108°F today · 20 d/yr by 30 yrs out
- Wind 2/10 Low 2% chance of damaging wind over 30 yrs
- Air quality 2/10 Low 1 unhealthy d/yr today · 1 by 30 yrs out
Nearby sold comps map
Loading sold comps map…
Walkable amenities ~0.75 mi
Loading nearby amenities…
Taxation est. · year 1
- Rental income
- $7,782
- − Mortgage interest
- −$1,115
- − Property taxes
- −$44
- − Insurance
- −$100
- − Repairs & maintenance
- −$623
- − Management
- −$623
- − Depreciation
- −$579
- Taxable income
- $4,700
- Est. tax owed @ 24.0%
- −$1,128
- After-tax cash flow
- $3,624/yr
For passive investors: Depreciation is non-cash, so a rental often shows a tax loss while cash-flowing — sheltering income. Rental losses are passive: they offset passive income freely, and up to $25,000/yr can offset ordinary (W-2) income if you actively participate and your MAGI is under $100k (phasing out to $0 by $150k); unused losses carry forward. On sale, claimed depreciation is recaptured at up to 25%, and gains may owe capital-gains tax (a 1031 exchange can defer both). Figures are a year-1 estimate at your 24.0% rate — not tax advice; consult a CPA.
Schools (NCES district)
- District
- Baxter Springs
- NCES district ID
- 2003810
- Math proficiency
- 31% ▼ -1.00%
- Reading proficiency
- 39% ▲ 2.00%
- Median HH income
- $40,038
- Composite
- 29.37/100
- National rank
- #6529
- State rank
- #64 of 169 in KS
Livability — Baxter Springs
- Score
- 75/100
- State rank
- #63
- US rank
- #3952
Category grades
Schools grade is shown separately in the Schools card above.
Census & demographics
- Census place
- Baxter Springs, KS
- Population (ZIP)
- 5,560
Population outlook (Cherokee County) Hauer SSP2
- Today (2025)
- 18,848 people
- By 2030
- 17,862 · -5.2%
- By 2040
- 15,850 · -15.9%
- By 2050
- 13,915 · -26.2%
- By 2075
- 10,102 · -46.4%
- By 2100
- 6,977 · -63.0%
Race, ethnicity, and origin ACS 2023
- Neighborhood character
- Predominantly White (85%)
- Race & ethnicity
- White 85% Hispanic / Latino 6% Two or more races 4% Native American 3%
- Hispanic origin (detail)
- Mexican 4%
- Common ancestry
- Scotch-Irish 6% Slovak 3% Italian 3%
- Foreign-born
- 2% · Canada
- Languages at home
- 98% English-only · Other Indo-European 1% Spanish 1%
Political lean MEDSL · Cherokee
- 2024 margin
- Solid R (+52.9) · D 22.6% · R 75.5% · Other 1.9%
- 2008→2024 swing
- -29.2pp toward R · 2008: -23.7pp · 2024: -52.9pp
- All cycles
- 2024: R+52.9 2020: R+49.9 2016: R+48.4 2012: R+29.5 2008: R+23.7
Not yet ingested
- Civics
- —
Market trends
- HPI YoY
- ▼ -37.71%
- Current HPI
- 175.5431
- Rent YoY
- —
- Metro
- —
- State GDP YoY
- —
- F500 in state
- 0
Price history
2 events — show timeline
- 2024-07-01 Pending — OGAR
- 2024-05-07 Listed $19,900 OGAR
Property tax history
-25.5%/yrLatest (2025): $44 · -42.7% YoY. Source: county tax records.
Cash-flow waterfall
monthlySold comps — $/sqft
last 12 mo · ≤1 miLoading sold comps…