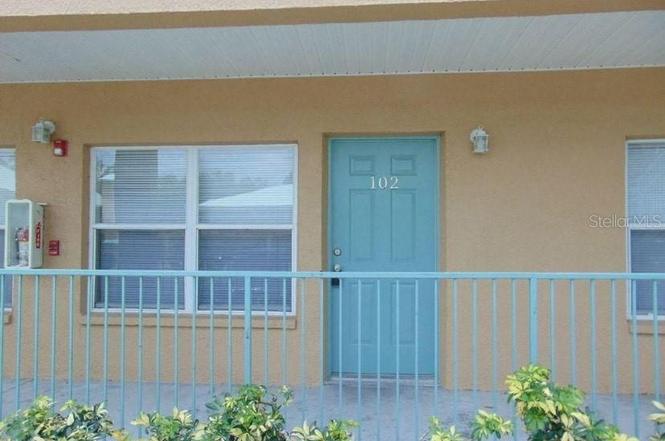
5816 Congress St #102 · New Port Richey, FL
Flood risk 7/10 · Major
- FEMA flood zone
- X (shaded)
- Chance of flooding over 30 yrs
- 0.95%
- Est. flood insurance / yr
- $507 – $1,088
Fire risk 3/10 · Minor
- Est. fire insurance / yr
- $947 – $1,759
Heat risk 10/10 · Severe
- Hot days now (above 108°F)
- 7 days/yr
- Hot days in 30 yrs
- 28 days/yr
Wind risk 10/10 · Severe
- Chance of severe wind over 30 yrs
- 99.0%
Air-quality risk 2/10 · Minimal
- Unhealthy air days now
- 1 days/yr
- Unhealthy air days in 30 yrs
- 1 days/yr
Risk factors via First Street. Map © Google.
Why this score? — see what drove the D grade
The composite is a weighted blend of 9 inputs, each scored 0–100. Each bar is that input's sub-score; the figure is the points it added to the 100-point composite (weight × sub-score).
- Cash flow +12.4/30.0
- ARV discount +7.5/15.0
- 1% rule +6.9/10.0
- Schools +4.3/10.0
- Livability +4.1/5.0
- DSCR +3.7/10.0
- Condition / age +2.5/5.0
- Rent growth +1.8/5.0
- Appreciation +0.0/10.0
$123,500
🖨 Deal sheet 📄 Offer letter ✓ Due diligence
Listing remarks MLS
This updated 920 sq ft condo is a 2 bedroom, 2 bath that features newer appliances, inside laundry room, and inside large storage room. It has carpet, tile split and is bottom floor.
Key facts
- Extra storage space
- Large kitchen
- In unit laundry
Tags
Property features AI
Finance
- Other: Property type: Residential condominium; Zoning: MF1; Lot acreage: approximately 1 to less than 2 acres; Road surface: Asphalt
- Financial info: Total annual fees $3,624
- HOA & community: Monthly condo fee of $302 (includes internet, structure and grounds maintenance, sewer, trash and water); Association managed by Qualified Property Management, Inc.; Association fee required; Pets allowed with restrictions (cats and dogs OK; breed, number and size limits may apply)
Exterior
- Utilities: Public water; Public sewer; Electricity connected; Water connected; Sewer connected
- Home design: Condominium; Single-story; Faces north; Entry level: 1
- Construction: Block construction; Metal roof; Slab foundation; Built on one level
- Exterior features: Sidewalk; Other exterior features
Interior
- Kitchen: Dishwasher; Disposal; Freezer; Refrigerator; Electric water heater
- Bedrooms: 2 bedrooms
- Flooring: Ceramic tile; Laminate
- Bathrooms: 2 full bathrooms
- Heating & cooling: Electric heating; Central air conditioning
- Interior features: Ceiling fans
- Laundry & utility: Washer hookup; Electric dryer hookup
Neighborhood map
What this means for you Summary
Snapshot
- This is a 2-bed/2.0-bath condo listed at $124k.
Deal economics
- At list price, monthly cash flow is $-87 ($-1k/yr) — negative.
- To cash-flow at today's rent, offer at most $108k (12.4% below list).
- Meets the 1% rule at list price ($1k rent vs $124k).
- Recommended offer: $108k (12.4% below list) — sets the bar for cash-flow.
- Cap rate 6.1% vs local median 2.0% in New Port Richey — top-decile yield for the area; either an underpriced asset or a hidden risk that comps aren't pricing in. Stress-test before assuming the spread holds.
Location & tenants
- Location reads 82/100 on livability (#67 in FL, #1,139 nationally) — a professional / high-income tenant draw. Strengths: amenities A+, cost of living A+, housing A+; Watch: crime C-, commute D, employment F.
- Pasco (suburban): math 50% / reading 52% proficiency, ranked #32 of 73 in FL (top 44%) — acceptable for families but not a draw, mixed tenant base, ~2y average lease.
- Zoned schools: Cotee River Elementary School (math 42% / reading 45%, grade F, #1,345 of 2,144 statewide, top 64%, 551 students, 84% FRL); Gulf High School (math 32% / reading 34%, grade F, #406 of 667 statewide, top 61%, 1,465 students, 76% FRL) — zoned schools average 80% FRL vs 48% district-wide (32 pts higher); higher-poverty schools than district average — tighter screening recommended.
- Zoned-school proficiency averages 38% at this address vs 51% district-wide (-13 pts) — the specific schools serving this property underperform the Pasco average; the district grade overstates school quality for this exact location.
- Market conditions: Rents soft (-2.9%/yr); 305 active listings in the ZIP; 40 comparable units currently listed for rent nearby; rentals at typical pace (median 24d on market — plan ~3-4 weeks tenant-placement turnaround); 6,765 units permitted in Pasco County in 2024 (1,250 in 5+ unit buildings).
- This rent runs 36% of the median local income ($50k/yr) — at the standard rent-burdened threshold; future hikes will face affordability resistance.
Forward outlook
- Local home prices are declining (-3.0%/yr); year-one equity from $854 of loan paydown is wiped out by about $4k of value loss. Plan a longer hold.
- Pasco County population projected at +29% by 2050 — long-run rental-demand tailwind backs the buy-and-hold thesis.
Negotiation context
- It's been on market 218 days — a 12% lower offer ($109k) is reasonable based on typical stale-listing flexibility.
- 5 sale attempts since 18y ago with the ask held roughly flat each time — persistent listings suggest the price (not the market) is what's stuck; bring a comps-based counter.
Risks & watch-outs
- Watch-outs: flood insurance adds $66/mo; HOA is 21% of rent.
- Climate carrying-cost: major flood risk; severe wind risk, 99% chance of damaging wind over 30y; extreme-heat days projected 7→28/yr by 2055 (HVAC capex compounding) — expect insurance premiums to compound above CPI over the hold.
Questions for the listing agent
- What do current leases actually rent for vs. the listed asking? Can we see a recent rent roll and the last 12 months of T-12 income?
- It's been on market 218 days. Have you received any prior offers? Is the seller open to a 12% concession, seller financing, or rate buy-down credit?
- What's the actual annual flood-insurance premium (NFIP or private), and is the property in a SFHA with mandatory coverage?
- What does the HOA fee cover, when was the last increase, and are there any pending special assessments or reserve-fund shortfalls?
- Any open or pending special assessments — roof, HVAC, plumbing, elevator, façade? What's the per-unit balance and payoff schedule, and is the seller paying it off at close or rolling it to the buyer?
- Why hasn't it sold? Are there any deal-killer items the seller is aware of (foundation, flood, title, zoning, code violations)?
- Is there a deadline driving the sale (1031 exchange, divorce, estate, relocation)? That informs how much negotiation room exists.
- The area grade is low — what's the realistic commute time and amenity access for the typical tenant pool here? Any planned neighborhood developments (good or bad) we should know about?
- What's the average days-on-market for RENTAL listings here right now (not sales)? A rising rental-DOM trend means longer vacancies and softer asking-rent achievability than the comps imply.
- What's the recent tenant-quality profile in this submarket — average credit score on applications, eviction rate, late-payment / NSF rate, and stable-employment percentage? A property-management company in the area should have these aggregated.
- How much new apartment / multifamily construction is in the pipeline within 1–3 miles? Heavy new supply (>2% of stock underway) typically softens rents 12–24 months out; light construction supports rent growth.
Investment metrics
- 1% rule
- 1.19% ✓
- Cap rate
- 6.09%
- Cash-on-cash
- -0.71%
- DSCR
- 0.97
- GRM
- 7.0
CMA / ARV
No comps found within radius.
Projected returns pro-forma
-3.0% appreciation · 0.0% rent growth · sell at horizon
- IRR
- -26.3%
- Equity multiple
- 0.14×
- Total profit
- $-29,599
- Equity at exit
- $18,414
- IRR
- -50.7%
- Equity multiple
- -0.40×
- Total profit
- $-48,488
- Equity at exit
- $10,678
Cash invested: $34,580 (down + closing). Projections, not guarantees.
Landlord ↔ Tenant lean methodology
- Overall (STATE)
- 87 Strongly Landlord-Friendly
- State Florida
- 87 Strongly Landlord-Friendly · R+3
- County
- — inherits STATE
- City
- — inherits STATE
ZIP-level market 34653
- Home prices YoY
- -18.4%
- Rents YoY
- -2.9%
- Active inventory
- 305
- Price-to-rent
- 7.0×
Monthly cashflow live
- Estimated rent
- $1,470 high interval (Pro) →
- Mortgage (P&I)
- −$648
- Tax from tax record
- −$181 /mo · $2,174/yr
- Insurance
- −$51
- Flood insurance flood zone
- −$66 /mo · $798/yr
- HOA
- −$302
- Vacancy / Maint / Mgmt
- −$309
- Net cashflow
- $-87
Break-even live
UW: 25.0% down · 7.5% · 30yr · 1.5% tax · 5.0% vac · 8.0% maint · 8.0% mgmt
Financing live
Cash to close
- Down payment
- $30,875
- Closing costs
- $3,705
- Reserves months
- —
- Total cash needed
- —
Loan-product check · same deal, 3 products live
Conventional
25% down · 7.5% · 30yr
- Down + closing
- —
- Monthly P&I
- —
- Monthly cashflow
- —
- DSCR
- —
- Eligible?
- —
Personal DTI + credit; lowest rate.
DSCR
20% down · 8.5% · 30yr
- Down + closing
- —
- Monthly P&I
- —
- Monthly cashflow
- —
- DSCR
- —
- Eligible?
- —
No personal income docs; deal must DSCR.
Hard money
10% down · 12.0% · 12mo
- Down + closing
- —
- Monthly P&I
- —
- Monthly cashflow
- —
- DSCR
- —
- Eligible?
- —
Short-term bridge; refi at stabilization.
Rent comps 40 comps
| Address | Beds | Baths | Sqft | Rent | $/sqft | DOM | Units | Dist |
|---|---|---|---|---|---|---|---|---|
| 5816 Congress St New Port Richey, FL | 2.0 | 2.0 | 920 | $1,400 | $1.52 | 24d | 1 | 0.03mi |
| 5822 Congress St #104 New Port Richey, FL | 2.0 | 2.0 | 920 | $1,650 | $1.79 | 24d | 1 | 0.03mi |
| 6322 Alaska Ave New Port Richey, FL | 2.0 | 1.0 | 720 | $1,500 | $2.08 | 24d | 1 | 0.18mi |
| 6029 Wyoming Ave New Port Richey, FL | 2.0 | 1.0 | 792 | $1,850 | $2.34 | 24d | 1 | 0.47mi |
| 6330 Pennsylvania Ave New Port Richey, FL | 1.0 | 1.0 | 622 | $1,150 | $1.85 | 24d | 1 | 0.58mi |
| 6330 Pennsylvania Ave Unit 1 New Port Richey, FL | 1.0 | 1.0 | 622 | $1,150 | $1.85 | 20d | 1 | 0.58mi |
| 6332 Pennsylvania Ave New Port Richey, FL | 2.0 | 1.0 | 962 | $1,250 | $1.30 | 20d | 1 | 0.58mi |
| 6332 Pennsylvania Ave New Port Richey, FL | 2.0 | 1.0 | 920 | $1,250 | $1.36 | 24d | 1 | 0.58mi |
| 5551 Executive Dr New Port Richey, FL | 2.0 | 2.0 | 1100 | $1,459 | $1.33 | 24d | 1 | 0.67mi |
| 5543 Executive Dr Unit B4 New Port Richey, FL | 2.0 | 2.0 | 1000 | $1,459 | $1.46 | 24d | 1 | 0.68mi |
| 5640 Ferguson Ct #2101 New Port Richey, FL | 2.0 | 2.0 | 1056 | $1,650 | $1.56 | 24d | 1 | 0.68mi |
| 5521 Executive Dr Unit D1 New Port Richey, FL | 2.0 | 2.0 | 1000 | $1,379 | $1.38 | 24d | 1 | 0.70mi |
| 5511 Executive Dr Apt E1 New Port Richey, FL | 2.0 | 2.0 | 1000 | $1,459 | $1.46 | 24d | 1 | 0.70mi |
| 5809 Dailey Ln New Port Richey, FL | 2.0 | 1.0 | 950 | $1,000 | $1.05 | 24d | 1 | 0.72mi |
| 5805 Delaware Ave New Port Richey, FL | 2.0 | 1.0 | 700 | $1,250 | $1.79 | 24d | 1 | 0.73mi |
| 5741 Tennessee Ave New Port Richey, FL | 1.0 | 1.0 | 700 | $1,200 | $1.71 | 24d | 1 | 0.74mi |
| 6120 Indiana Ave New Port Richey, FL | 2.0 | 1.0 | 676 | $1,299 | $1.92 | 3d | 1 | 0.74mi |
| 5847 Nebraska Ave New Port Richey, FL | 1.0 | 1.0 | 900 | $1,350 | $1.50 | 24d | 1 | 0.75mi |
| 6721 Congress St New Port Richey, FL | 2.0 | 1.0 | 830 | $1,250 | $1.51 | 24d | 1 | 0.78mi |
| 6635 Crossbow Ln New Port Richey, FL | 2.0 | 2.0 | 1082 | $1,695 | $1.57 | 17d | 1 | 0.78mi |
| 5743 Elm St New Port Richey, FL | 2.0 | 1.0 | 756 | $1,200 | $1.59 | 4d | 1 | 0.83mi |
| 5648 Townhouse Dr New Port Richey, FL | 2.0 | 1.5 | 900 | $1,495 | $1.66 | 24d | 1 | 0.88mi |
| 6332 Grand Blvd Port Richey, FL | 2.0 | 2.0 | 894 | $1,950 | $2.18 | 4d | 2 | 0.90mi |
| 4903 Myrtle Oak Dr #14 New Port Richey, FL | 2.0 | 2.0 | 935 | $1,250 | $1.34 | 24d | 1 | 0.96mi |
| 6807 Porter Rd Unit PCG G-101 New Port Richey, FL | 3.0 | 1.5 | 1080 | $1,375 | $1.27 | 4d | 1 | 0.98mi |
| 6807 Porter Rd Unit PCG G-202 New Port Richey, FL | 1.0 | 1.0 | 605 | $1,025 | $1.69 | 4d | 1 | 0.98mi |
| 6807 Porter Rd Unit PCG G-203 New Port Richey, FL | 2.0 | 1.0 | 770 | $1,275 | $1.66 | 4d | 1 | 0.98mi |
| 6807 Porter Rd Unit PGC C-5432-209 New Port Richey, FL | 2.0 | 2.0 | 1100 | $1,300 | $1.18 | 17d | 1 | 0.98mi |
| 6807 Porter Rd Unit PBMP M-5826 New Port Richey, FL | 2.0 | 1.0 | 800 | $1,380 | $1.73 | 24d | 1 | 0.98mi |
| 6807 Porter Rd Unit PGC C-5432-105 New Port Richey, FL | 2.0 | 2.0 | 895 | $1,360 | $1.52 | 24d | 1 | 0.98mi |
| 6807 Porter Rd Unit PBMP M-5836 New Port Richey, FL | 2.0 | 1.0 | 840 | $1,475 | $1.76 | 24d | 1 | 0.98mi |
| 6807 Porter Rd New Port Richey, FL | 2.0 | 1.0 | 840 | $1,475 | $1.76 | 2d | 1 | 0.98mi |
| 5543 Gulf Dr New Port Richey, FL | 2.0 | 1.0 | 744 | $1,550 | $2.08 | 16d | 1 | 0.98mi |
| 5800 Virginia Ave New Port Richey, FL | 2.0 | 1.0 | 900 | $1,550 | $1.72 | 12d | 1 | 1.00mi |
| 5800 Virginia Ave New Port Richey, FL | 2.0 | 1.0 | 900 | $1,495 | $1.66 | 20d | 1 | 1.00mi |
| 5529 La Salle Ct New Port Richey, FL | 2.0 | 1.0 | 850 | $1,300 | $1.53 | 10d | 1 | 1.03mi |
| 6424 Spring Flower Dr #25 New Port Richey, FL | 2.0 | 1.5 | 835 | $1,175 | $1.41 | 24d | 1 | 1.09mi |
| 6424 Spring Flower Dr #25 New Port Richey, FL | 2.0 | 1.5 | 915 | $1,175 | $1.28 | 17d | 1 | 1.09mi |
| 6548 Batea Ter New Port Richey, FL | 3.0 | 2.0 | 1120 | $1,800 | $1.61 | 24d | 1 | 1.10mi |
| 5634 Charles St New Port Richey, FL | 3.0 | 1.5 | 960 | $1,700 | $1.77 | 24d | 1 | 1.11mi |
HOA detail condo
- Monthly dues
- $302 · $3,624/yr
- Assessments
- None detected in remarks — confirm with the listing agent.
Listing history 6 events
-
2026-06-07statusdays on market $123,500 Pending 218 DOM
-
2026-06-04days on market $123,500 Active 216 DOM
-
2026-06-03days on market $123,500 Active 215 DOM
-
2026-06-02days on market $123,500 Active 214 DOM
-
2026-06-01days on market $123,500 Active 213 DOM
-
2026-05-31days on market $123,500 Active 212 DOM
ⓘ Source: listings_history table (triggers on properties + properties_extension) + one-shot
backfill from property_details.listing_events for pre-trigger history.
Tax reassessment forecast FL · Resets to sale price
- Current annual tax
- $2,174 · $181/mo
- Projected year-2 tax
- $2,174 · $181/mo
- Expected delta
- $0/yr ($0/mo · 0.0%)
ⓘ Screening estimate from a state-policy table — verify with the county assessor before closing.
Climate risk First Street
- Flood 7/10 Severe FEMA zone X (shaded) · 95% chance over 30 yrs
- Wildfire 3/10 Moderate
- Heat 10/10 Extreme 7 d/yr ≥108°F today · 28 d/yr by 30 yrs out
- Wind 10/10 Extreme 99% chance of damaging wind over 30 yrs
- Air quality 2/10 Low 1 unhealthy d/yr today · 1 by 30 yrs out
Nearby sold comps map
Loading sold comps map…
Walkable amenities ~0.75 mi
Loading nearby amenities…
Taxation est. · year 1
- Rental income
- $17,646
- − Mortgage interest
- −$6,918
- − Property taxes
- −$2,174
- − Insurance
- −$1,415
- − Repairs & maintenance
- −$1,412
- − Management
- −$1,412
- − HOA
- −$3,624
- − Depreciation
- −$3,593
- Taxable loss
- −$2,901
- Est. tax savings @ 24.0%
- +$696
- After-tax cash flow
- $-348/yr
For passive investors: Depreciation is non-cash, so a rental often shows a tax loss while cash-flowing — sheltering income. Rental losses are passive: they offset passive income freely, and up to $25,000/yr can offset ordinary (W-2) income if you actively participate and your MAGI is under $100k (phasing out to $0 by $150k); unused losses carry forward. On sale, claimed depreciation is recaptured at up to 25%, and gains may owe capital-gains tax (a 1031 exchange can defer both). Figures are a year-1 estimate at your 24.0% rate — not tax advice; consult a CPA.
Schools (NCES district)
- District
- Pasco
- NCES district ID
- 1201530
- Math proficiency
- 50% ▼ -10.00%
- Reading proficiency
- 52% ▼ -5.00%
- Median HH income
- $45,039
- Composite
- 43.14/100
- National rank
- #3074
- State rank
- #32 of 73 in FL
Livability — New Port Richey
- Score
- 82/100
- State rank
- #67
- US rank
- #1139
Category grades
Schools grade is shown separately in the Schools card above.
Census & demographics
- Census place
- New Port Richey, FL
- County
- Pasco County · 524,098 people
- City population
- 137,708
- Metro
- Tampa-St. Petersburg-Clearwater, FL
- Population (ZIP)
- 35,945
- Household income
- $49,563
- Rent vs Own
- Severe rent burden
- 1439.0
Population outlook (Pasco County) Hauer SSP2
- Today (2025)
- 570,045 people
- By 2030
- 605,844 · +6.3%
- By 2040
- 674,806 · +18.4%
- By 2050
- 736,022 · +29.1%
- By 2075
- 862,900 · +51.4%
- By 2100
- 906,364 · +59.0%
Race, ethnicity, and origin ACS 2023
- Neighborhood character
- Predominantly White (74%)
- Race & ethnicity
- White 74% Hispanic / Latino 14% Two or more races 9% Black 6% Asian 2%
- Hispanic origin (detail)
- Mexican 3% Puerto Rican 4% Cuban 2%
- Common ancestry
- Romanian 3% Lithuanian 2% Slovak 2%
- Foreign-born
- 11% · Canada, Jamaica, China
- Languages at home
- 84% English-only · Spanish 9% Other Indo-European 2% Russian/Polish/Slavic 2%
Political lean MEDSL · Pasco
- 2024 margin
- Strong R (+25.2) · D 36.9% · R 62.1% · Other 1.0%
- 2008→2024 swing
- -21.6pp toward R · 2008: -3.6pp · 2024: -25.2pp
- All cycles
- 2024: R+25.2 2020: R+20.1 2016: R+21.6 2012: R+6.7 2008: R+3.6
Not yet ingested
- Civics
- —
Market trends
- HPI YoY
- ▼ -73.10%
- Current HPI
- 324.6519
- Rent YoY
- ▼ -2.92%
- Metro
- Tampa-St. Petersburg-Clearwater, FL
- State GDP YoY
- ▲ 3.28%
- F500 in state
- 36
Industry mix (Fortune 500 HQ in FL)
| Industry | F500 HQs | Revenue |
|---|---|---|
| Industrial Technology | 2 | $29B |
|
||
| Insurance | 2 | $17B |
|
||
| Retail | 1 | $60B |
|
||
| Technology Distribution | 1 | $58B |
|
||
| Homebuilding | 1 | $35B |
|
||
| Technology Manufacturing | 1 | $35B |
|
||
Price history
+311.7% since first listed13 events — show timeline
- 2026-05-29 Relisted — Stellar MLS as Distributed by MLS Grid
- 2026-03-06 Price Changed $123,500 Stellar MLS as Distributed by MLS Grid
- 2025-12-31 Price Changed $129,000 Stellar MLS as Distributed by MLS Grid
- 2025-12-03 Listing Removed — Stellar MLS as Distributed by MLS Grid
- 2025-10-07 Listed $129,500 Stellar MLS as Distributed by MLS Grid
- 2025-10-06 Listed $129,500 Stellar MLS as Distributed by MLS Grid
- 2022-10-17 Sold (Public Records) $138,000 Public Records
- 2021-11-19 Sold (Public Records) $222,000 Public Records
- 2016-05-07 Listing Removed — Stellar MLS as Distributed by MLS Grid
- 2016-05-04 Sold (MLS) $28,000 Stellar MLS as Distributed by MLS Grid
- 2016-04-21 Pending — Stellar MLS as Distributed by MLS Grid
- 2016-04-01 Listed $35,000 Stellar MLS as Distributed by MLS Grid
- 2008-08-14 Listed $30,000 Stellar MLS as Distributed by MLS Grid
Property tax history
+14.0%/yrLatest (2025): $2,174 · +7.1% YoY. Source: county tax records.
Cash-flow waterfall
monthlySold comps — $/sqft
last 12 mo · ≤1 miLoading sold comps…