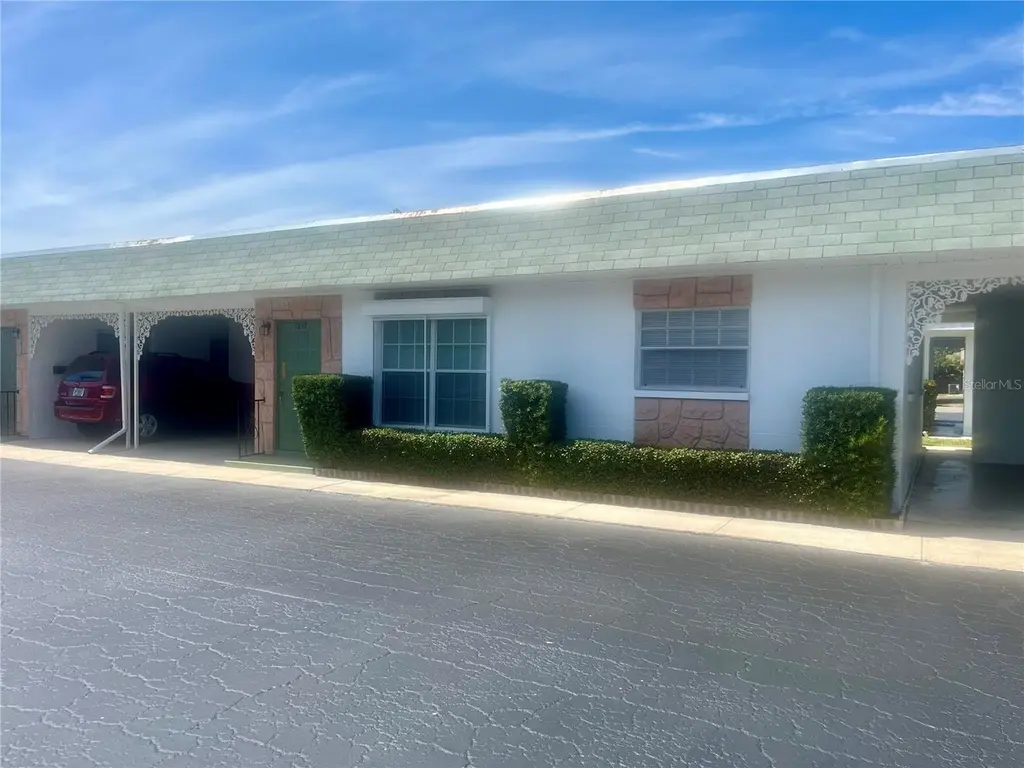
7847 39th Ter N · St. Petersburg, FL
Flood risk 1/10 · Minimal
- FEMA flood zone
- X (unshaded)
- Chance of flooding over 30 yrs
- 0.0%
- Est. flood insurance / yr
- $507 – $1,088
Fire risk 1/10 · Minimal
- Est. fire insurance / yr
- $947 – $1,759
Heat risk 10/10 · Severe
- Hot days now (above 107°F)
- 7 days/yr
- Hot days in 30 yrs
- 26 days/yr
Wind risk 10/10 · Severe
- Chance of severe wind over 30 yrs
- 99.0%
Air-quality risk 4/10 · Minor
- Unhealthy air days now
- 4 days/yr
- Unhealthy air days in 30 yrs
- 4 days/yr
Risk factors via First Street. Map © Google.
Why this score? — see what drove the D grade
The composite is a weighted blend of 9 inputs, each scored 0–100. Each bar is that input's sub-score; the figure is the points it added to the 100-point composite (weight × sub-score).
- Cash flow +10.2/30.0
- ARV discount +7.5/15.0
- 1% rule +7.4/10.0
- Schools +4.3/10.0
- DSCR +2.9/10.0
- Rent growth +2.7/5.0
- Livability +2.5/5.0
- Condition / age +2.5/5.0
- Appreciation +0.0/10.0
$129,900
🖨 Deal sheet 📄 Offer letter ✓ Due diligence
Listing remarks
High and Dry area, and no flooding or damage during the most recent 2 hurricane. , and ever before. Tyrone Villas community. This charming 2-bedroom and 1-bathroom villa, with a conveniently attached one-car covered carport, is situated in the highly sought-after Tyrone Villas community. Recent updates include laminated flooring throughout, a refrigerator, and fresh paint. The sliding glass door leads to a lovely back patio, and to a utility room which houses the HVAC system with natural gas heat, a gas water heater. Residents of this friendly, close-knit community can enjoy amenities such as a solar-heated community pool, shuffleboard courts, and
Key facts
- Laminated flooring
- Utility room
- High and dry area
Tags
Property features AI
Finance
- Other: Total annual fees reported; Unfurnished
- HOA & community: Monthly HOA fee of $424.64 (includes common area taxes, reserves, insurance, structure maintenance, grounds maintenance, management, pest control, pool, private road, recreational facilities, sewer, trash, water); Association amenities: Clubhouse, Pool, Shuffleboard court; Association name listed; Buyer approval required; Deed restrictions; Sidewalks and street lights; Senior community; No pets allowed
Exterior
- Parking: Carport with 1 space
- Utilities: Public sewer; Electricity connected; Natural gas connected; Water connected; Cable available; Broadband/high-speed internet available; Underground utilities; Fire hydrant nearby
- Home design: Attached villa; One story; South-facing
- Construction: Brick construction; Membrane roof; Shingle roof; Slab foundation; Completed condition; Built as a residential villa
- Exterior features: Sidewalk; Sliding doors; Sprinkler (metered)
Interior
- Kitchen: Dishwasher; Disposal; Gas range; Refrigerator
- Bedrooms: 2 bedrooms
- Flooring: Laminate; Tile
- Bathrooms: 1 full bathroom
- Heating & cooling: Central heating (natural gas); Central air conditioning
- Interior features: Ceiling fans; Eat-in kitchen; Open floorplan; Thermostat; Window treatments
- Laundry & utility: Washer; Dryer; Laundry room; Outside laundry area; Gas water heater
Neighborhood map
What this means for you Summary
Snapshot
- This is a 2-bed/1.0-bath condo listed at $130k.
Deal economics
- At list price, monthly cash flow is $-73 ($-881/yr) — negative.
- To cash-flow at today's rent, offer at most $117k (10.0% below list).
- Meets the 1% rule at list price ($2k rent vs $130k).
- Recommended offer: $117k (10.0% below list) — sets the bar for cash-flow.
- Cap rate 5.6% vs local median 2.6% in St. Petersburg — top-decile yield for the area; either an underpriced asset or a hidden risk that comps aren't pricing in. Stress-test before assuming the spread holds.
Location & tenants
- Location reads: area grade D — affects rentability + tenant quality, not the cash-flow math above.
- Pinellas (suburban): math 51% / reading 51% proficiency, ranked #31 of 73 in FL (top 42%) — acceptable for families but not a draw, mixed tenant base, ~2y average lease.
- Market conditions: Rents flat; 309 active listings in the ZIP; 18 comparable units currently listed for rent nearby; rentals at typical pace (median 18d on market — plan ~3-4 weeks tenant-placement turnaround); 2,676 units permitted in Pinellas County in 2024 (1,422 in 5+ unit buildings).
- This rent runs 36% of the median local income ($54k/yr) — at the standard rent-burdened threshold; future hikes will face affordability resistance.
Forward outlook
- Local home prices are declining (-3.0%/yr); year-one equity from $898 of loan paydown is wiped out by about $4k of value loss. Plan a longer hold.
- Pinellas County population projected at +14% by 2050 — modest demand growth; plan on rents tracking national, not racing it.
Negotiation context
- It's been on market 60 days — a 3% lower offer ($126k) is reasonable based on typical stale-listing flexibility.
- 3 sale attempts with the ask held roughly flat each time — persistent listings suggest the price (not the market) is what's stuck; bring a comps-based counter.
- Current owner paid $28k; list at $130k implies a 364% gain — meaningful room to come down on a strong offer.
Risks & watch-outs
- Watch-outs: HOA is 26% of rent.
- Climate carrying-cost: severe wind risk, 99% chance of damaging wind over 30y; extreme-heat days projected 7→26/yr by 2055 (HVAC capex compounding) — expect insurance premiums to compound above CPI over the hold.
Questions for the listing agent
- What do current leases actually rent for vs. the listed asking? Can we see a recent rent roll and the last 12 months of T-12 income?
- It's been on market 60 days. Have you received any prior offers? Is the seller open to a 10% concession, seller financing, or rate buy-down credit?
- Built in 1969 — when were the roof, HVAC, electrical panel, plumbing, and water heater last replaced?
- What does the HOA fee cover, when was the last increase, and are there any pending special assessments or reserve-fund shortfalls?
- Any open or pending special assessments — roof, HVAC, plumbing, elevator, façade? What's the per-unit balance and payoff schedule, and is the seller paying it off at close or rolling it to the buyer?
- Is there a deadline driving the sale (1031 exchange, divorce, estate, relocation)? That informs how much negotiation room exists.
- The area grade is low — what's the realistic commute time and amenity access for the typical tenant pool here? Any planned neighborhood developments (good or bad) we should know about?
- What's the average days-on-market for RENTAL listings here right now (not sales)? A rising rental-DOM trend means longer vacancies and softer asking-rent achievability than the comps imply.
- What's the recent tenant-quality profile in this submarket — average credit score on applications, eviction rate, late-payment / NSF rate, and stable-employment percentage? A property-management company in the area should have these aggregated.
- How much new apartment / multifamily construction is in the pipeline within 1–3 miles? Heavy new supply (>2% of stock underway) typically softens rents 12–24 months out; light construction supports rent growth.
Investment metrics
- 1% rule
- 1.24% ✓
- Cap rate
- 5.61%
- Cash-on-cash
- -2.42%
- DSCR
- 0.89
- GRM
- 6.7
CMA / ARV
No comps found within radius.
Projected returns pro-forma
-3.0% appreciation · 0.99% rent growth · sell at horizon
- IRR
- -23.6%
- Equity multiple
- 0.21×
- Total profit
- $-28,622
- Equity at exit
- $19,369
- IRR
- -29.1%
- Equity multiple
- -0.16×
- Total profit
- $-42,325
- Equity at exit
- $11,231
Cash invested: $36,372 (down + closing). Projections, not guarantees.
Landlord ↔ Tenant lean methodology
- Overall (STATE)
- 87 Strongly Landlord-Friendly
- State Florida
- 87 Strongly Landlord-Friendly · R+3
- County
- — inherits STATE
- City
- — inherits STATE
ZIP-level market 33709
- Rents YoY
- 1.0%
- Active inventory
- 309
- Price-to-rent
- 6.7×
Monthly cashflow live
- Estimated rent
- $1,613 high interval (Pro) →
- Mortgage (P&I)
- −$681
- Tax from tax record
- −$188 /mo · $2,256/yr
- Insurance
- −$54
- HOA
- −$424
- Vacancy / Maint / Mgmt
- −$339
- Net cashflow
- $-73
Break-even live
UW: 25.0% down · 7.5% · 30yr · 1.5% tax · 5.0% vac · 8.0% maint · 8.0% mgmt
Financing live
Cash to close
- Down payment
- $32,475
- Closing costs
- $3,897
- Reserves months
- —
- Total cash needed
- —
Loan-product check · same deal, 3 products live
Conventional
25% down · 7.5% · 30yr
- Down + closing
- —
- Monthly P&I
- —
- Monthly cashflow
- —
- DSCR
- —
- Eligible?
- —
Personal DTI + credit; lowest rate.
DSCR
20% down · 8.5% · 30yr
- Down + closing
- —
- Monthly P&I
- —
- Monthly cashflow
- —
- DSCR
- —
- Eligible?
- —
No personal income docs; deal must DSCR.
Hard money
10% down · 12.0% · 12mo
- Down + closing
- —
- Monthly P&I
- —
- Monthly cashflow
- —
- DSCR
- —
- Eligible?
- —
Short-term bridge; refi at stabilization.
Rent comps 18 comps
| Address | Beds | Baths | Sqft | Rent | $/sqft | DOM | Units | Dist |
|---|---|---|---|---|---|---|---|---|
| 7801 34th Ave N #88 Saint Petersburg, FL | 2.0 | 1.0 | 624 | $1,400 | $2.24 | 24d | 1 | 0.30mi |
| 7801 34th Ave N #88 Saint Petersburg, FL | 2.0 | 1.0 | 624 | $1,300 | $2.08 | 2d | 1 | 0.30mi |
| 7317 46th Ave N Unit 4 St. Petersburg, FL | 1.0 | 1.0 | 528 | $1,200 | $2.27 | 14d | 1 | 0.63mi |
| 4801 71st St N Saint Petersburg, FL | 2.0 | 1.0 | 726 | $1,900 | $2.62 | 4d | 1 | 0.83mi |
| 4801 71st St N St Petersburg, FL | 2.0 | 1.0 | 726 | $1,900 | $2.62 | 17d | 1 | 0.83mi |
| 5257 81st Ln N #6 Saint Petersburg, FL | 1.0 | 1.0 | 745 | $1,375 | $1.85 | 24d | 1 | 0.87mi |
| 7045 30th Ave N Saint Petersburg, FL | 1.0–2.0 | 1.0–2.0 | 825 | $1,595 | $1.93 | 7d | 1 | 0.94mi |
| 8800 Bay Pines Blvd #320 Saint Petersburg, FL | 1.0 | 1.0 | 506 | $2,200 | $4.35 | 4d | 1 | 0.96mi |
| 5140 70th St N Unit 3 St. Petersburg, FL | 1.0 | 1.0 | 450 | $1,200 | $2.67 | 24d | 1 | 1.00mi |
| 6801 48th Ave N Unit B St. Petersburg, FL | 1.0 | 1.0 | 650 | $1,525 | $2.35 | 24d | 1 | 1.01mi |
| 4701 68th St N Saint Petersburg, FL | 1.0 | 1.0 | 700 | $1,099 | $1.57 | 24d | 1 | 1.03mi |
| 3556 66th St N St. Petersburg, FL | 1.0 | 1.0 | 610 | $1,300 | $2.13 | 14d | 1 | 1.13mi |
| 5411 70th Ln N Saint Petersburg, FL | 2.0 | 1.0 | 600 | $1,800 | $3.00 | 24d | 1 | 1.15mi |
| 6538 42nd Ave N Unit 7 Kenneth City, FL | 2.0 | 1.0 | 648 | $2,000 | $3.09 | 24d | 1 | 1.19mi |
| 3980 64th St N Saint Petersburg, FL | 1.0–2.0 | 1.0–2.0 | 707 | $1,500 | $2.12 | 3d | 6 | 1.34mi |
| 6939 Stones Throw Cir N #6207 Saint Petersburg, FL | 1.0 | 1.0 | 680 | $1,595 | $2.35 | 24d | 1 | 1.39mi |
| 6522 54th Ave N Saint Petersburg, FL | 1.0–3.0 | 1.0–2.0 | 892 | $1,600 | $1.79 | 1d | 10 | 1.45mi |
| 6908 Stones Throw Cir N #10208 Saint Petersburg, FL | 2.0 | 1.5 | 730 | $1,900 | $2.60 | 14d | 1 | 1.47mi |
HOA detail condo
- Monthly dues
- $424 · $5,088/yr
- Likely covers
- watergaspool
- Assessments
- None detected in remarks — confirm with the listing agent.
Listing history 23 events
-
2026-06-18days on market $129,900 Active 60 DOM
-
2026-06-17days on market $129,900 Active 59 DOM
-
2026-06-16days on market $129,900 Active 58 DOM
-
2026-06-15days on market $129,900 Active 57 DOM
-
2026-06-13days on market $129,900 Active 55 DOM
-
2026-06-09days on market $129,900 Active 51 DOM
-
2026-06-08days on market $129,900 Active 50 DOM
-
2026-06-07days on market $129,900 Active 49 DOM
-
2026-06-04days on market $129,900 Active 46 DOM
-
2026-06-03days on market $129,900 Active 45 DOM
-
2026-06-01days on market $129,900 Active 43 DOM
-
2026-05-31days on market $129,900 Active 42 DOM
-
2026-04-19$129,900 Active
-
2026-01-31historical
-
2025-12-13price $132,500
-
2025-10-04price $137,500
-
2025-06-14price $145,000
-
2025-04-30status Active
-
2025-02-23$147,000 Active
-
2000-03-02soldstatus $28,000
-
1999-07-19soldstatus $28,500
-
1987-03-30soldstatus $34,000
-
1984-06-01soldstatus $33,000
ⓘ Source: listings_history table (triggers on properties + properties_extension) + one-shot
backfill from property_details.listing_events for pre-trigger history.
Tax reassessment forecast FL · Resets to sale price
- Current annual tax
- $2,256 · $188/mo
- Projected year-2 tax
- $2,256 · $188/mo
- Expected delta
- $0/yr ($0/mo · 0.0%)
ⓘ Screening estimate from a state-policy table — verify with the county assessor before closing.
Climate risk First Street
- Flood 1/10 Low FEMA zone X (unshaded) · 0% chance over 30 yrs
- Wildfire 1/10 Low
- Heat 10/10 Extreme 7 d/yr ≥107°F today · 26 d/yr by 30 yrs out
- Wind 10/10 Extreme 99% chance of damaging wind over 30 yrs
- Air quality 4/10 Moderate 4 unhealthy d/yr today · 4 by 30 yrs out
Nearby sold comps map
Loading sold comps map…
Walkable amenities ~0.75 mi
Loading nearby amenities…
Taxation est. · year 1
- Rental income
- $19,351
- − Mortgage interest
- −$7,276
- − Property taxes
- −$2,256
- − Insurance
- −$650
- − Repairs & maintenance
- −$1,548
- − Management
- −$1,548
- − HOA
- −$5,088
- − Depreciation
- −$3,779
- Taxable loss
- −$2,794
- Est. tax savings @ 24.0%
- +$671
- After-tax cash flow
- $-210/yr
For passive investors: Depreciation is non-cash, so a rental often shows a tax loss while cash-flowing — sheltering income. Rental losses are passive: they offset passive income freely, and up to $25,000/yr can offset ordinary (W-2) income if you actively participate and your MAGI is under $100k (phasing out to $0 by $150k); unused losses carry forward. On sale, claimed depreciation is recaptured at up to 25%, and gains may owe capital-gains tax (a 1031 exchange can defer both). Figures are a year-1 estimate at your 24.0% rate — not tax advice; consult a CPA.
Schools (NCES district)
- District
- Pinellas
- NCES district ID
- 1201560
- Math proficiency
- 51% ▼ -5.00%
- Reading proficiency
- 51% ▼ -3.00%
- Median HH income
- $46,270
- Composite
- 43.27/100
- National rank
- #3046
- State rank
- #31 of 73 in FL
Livability — St. Petersburg
No livability data for this city. (Only ~50 U.S. cities are tracked.)
Census & demographics
- Census place
- St. Petersburg, FL
- County
- Pinellas County · 939,478 people
- City population
- 249,151
- Metro
- Tampa-St. Petersburg-Clearwater, FL
- Population (ZIP)
- 25,050
- Household income
- $53,501
- Rent vs Own
- Severe rent burden
- 712.0
Population outlook (Pinellas County) Hauer SSP2
- Today (2025)
- 1,027,532 people
- By 2030
- 1,063,586 · +3.5%
- By 2040
- 1,125,020 · +9.5%
- By 2050
- 1,168,637 · +13.7%
- By 2075
- 1,265,188 · +23.1%
- By 2100
- 1,260,357 · +22.7%
Race, ethnicity, and origin ACS 2023
- Neighborhood character
- Predominantly White (73%)
- Race & ethnicity
- White 73% Hispanic / Latino 11% Two or more races 10% Black 5% Asian 5%
- Hispanic origin (detail)
- Mexican 2% Puerto Rican 3% Cuban 2% Dominican 1%
- Common ancestry
- Lithuanian 3% Romanian 3% Slovak 2%
- Foreign-born
- 14% · Canada, Vietnam, Jamaica
- Languages at home
- 84% English-only · Spanish 9% Other Indo-European 2% Vietnamese 2%
Political lean MEDSL · Pinellas
- 2024 margin
- Lean R (+5.2) · D 46.9% · R 52.1%
- 2008→2024 swing
- -13.5pp toward R · 2008: 8.3pp · 2024: -5.2pp
- All cycles
- 2024: R+5.2 2020: D+0.2 2016: R+1.1 2012: D+5.6 2008: D+8.3
Not yet ingested
- Civics
- —
Market trends
- HPI YoY
- ▼ -416.74%
- Current HPI
- 391.368
- Rent YoY
- ▲ 0.99%
- Metro
- Tampa-St. Petersburg-Clearwater, FL
- State GDP YoY
- ▲ 3.28%
- F500 in state
- 36
Industry mix (Fortune 500 HQ in FL)
| Industry | F500 HQs | Revenue |
|---|---|---|
| Industrial Technology | 2 | $29B |
|
||
| Insurance | 2 | $17B |
|
||
| Retail | 1 | $60B |
|
||
| Technology Distribution | 1 | $58B |
|
||
| Homebuilding | 1 | $35B |
|
||
| Technology Manufacturing | 1 | $35B |
|
||
Price history
+293.6% since first listed11 events — show timeline
- 2026-04-19 Listed $129,900 Stellar MLS as Distributed by MLS Grid
- 2026-01-31 Listing Removed — Stellar MLS as Distributed by MLS Grid
- 2025-12-13 Price Changed $132,500 Stellar MLS as Distributed by MLS Grid
- 2025-10-04 Price Changed $137,500 Stellar MLS as Distributed by MLS Grid
- 2025-06-14 Price Changed $145,000 Stellar MLS as Distributed by MLS Grid
- 2025-04-30 Relisted — Stellar MLS as Distributed by MLS Grid
- 2025-02-23 Listed $147,000 Stellar MLS as Distributed by MLS Grid
- 2000-03-02 Sold (Public Records) $28,000 Public Records
- 1999-07-19 Sold (Public Records) $28,500 Public Records
- 1987-03-30 Sold (Public Records) $34,000 Public Records
- 1984-06-01 Sold (Public Records) $33,000 Public Records
Property tax history
+11.3%/yrLatest (2025): $2,256 · -1.5% YoY. Source: county tax records.
Cash-flow waterfall
monthlySold comps — $/sqft
last 12 mo · ≤1 miLoading sold comps…