 Multi-family
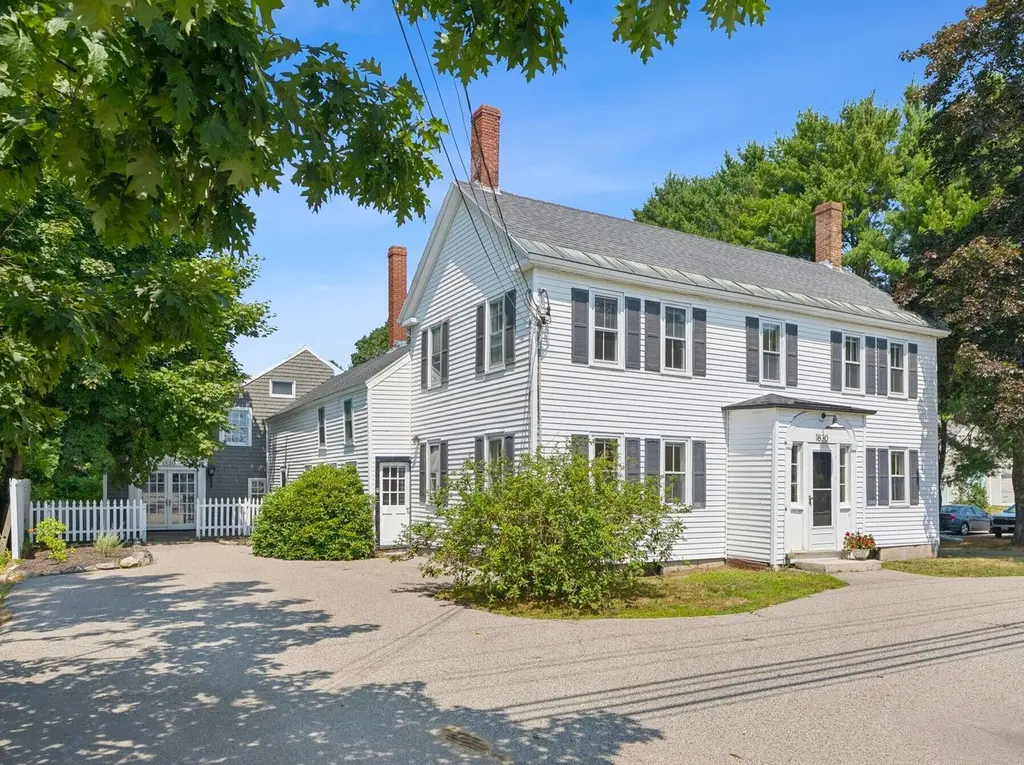
1830 Post Rd · Wells, ME
Flood risk 1/10 · Minimal
- FEMA flood zone
- X
- Chance of flooding over 30 yrs
- 0.0%
- Est. flood insurance / yr
- $507 – $1,088
Fire risk 3/10 · Minor
- Est. fire insurance / yr
- $669 – $1,243
Heat risk 5/10 · Moderate
- Hot days now (above 87°F)
- 7 days/yr
- Hot days in 30 yrs
- 17 days/yr
Wind risk 6/10 · Moderate
- Chance of severe wind over 30 yrs
- 67.0%
Air-quality risk 2/10 · Minimal
- Unhealthy air days now
- 1 days/yr
- Unhealthy air days in 30 yrs
- 2 days/yr
Risk factors via First Street. Map © Google.
Why this score? — see what drove the C grade
The composite is a weighted blend of 9 inputs, each scored 0–100. Each bar is that input's sub-score; the figure is the points it added to the 100-point composite (weight × sub-score).
- Cash flow +23.8/30.0
- DSCR +7.7/10.0
- Schools +7.6/10.0
- ARV discount +7.5/15.0
- 1% rule +5.2/10.0
- Rent growth +2.5/5.0
- Livability +2.5/5.0
- Condition / age +2.5/5.0
- Appreciation +0.0/10.0
$795,000
🖨 Deal sheet 📄 Offer letter ✓ Due diligence
Multi-family units
County records classify this as Multi-Family (2-4 Unit). Listing-text estimate: 1 unit. estimate disagrees with records
Listing remarks
Welcome to a rare opportunity to own a historic 1820 Colonial offering both residential and commercial use in a prime Route 1 location. Formerly part of the Rankinville Salt Marsh Farm, this property provides excellent visibility with strong traffic exposure, clear sight lines, and pedestrian sidewalk access. Inside, the building features tin ceilings, maple floors, abundant natural light, and marsh views. A working fireplace and modern heat pumps support year-round comfort. A private patio and separate paved parking provide convenience for both commercial and residential occupants. The upper level includes cathedral ceilings with original wooden beams and knee braces. At the rear of the st
Key facts
- Tin ceilings
- Historic colonial
- Clear sight lines
Tags
Property features AI
Finance
- Other: Property configured as a 2-unit building (one 3-bed unit and one 1-bed unit); Each unit has a dedicated electric meter; neither unit has a dedicated gas meter
Exterior
- Parking: Detached 2-car garage; Paved parking with space for 11–20 vehicles
- Utilities: Public water; Public sewer (primary unit); Public sewer for property listed; secondary unit reported as no sewer; Electric service with circuit breakers; Electric water heater; Utilities currently on
- Home design: Wood-frame construction with vinyl siding; Shingle roof; Built in 1820; Ocean and marsh water view
- Construction: Stone, granite, and brick/mortar foundation
- Exterior features: Deck; Patio; Located in a historic district; Near public beach, shopping, town, turnpike/interstate, and railroad; Level lot; Paved road
Interior
- Kitchen: Refrigerators in both units
- Bedrooms: Three-bedroom primary unit on the first level; One-bedroom secondary unit on the first level
- Flooring: Carpet; Vinyl; Wood; Hardwood
- Bathrooms: Five full bathrooms
- Heating & cooling: Direct vent heater; Forced air; Heat pump (also provides cooling); Zoned heating
- Interior features: Walk-in closets; Internet access available
- Laundry & utility: Dedicated water heater for the primary unit; Secondary unit does not have a dedicated water heater
Neighborhood map
What this means for you Summary
Snapshot
- This is a 3-bed/2.0-bath multifamily listed at $795k.
Deal economics
- At list price, monthly cash flow is $2k ($18k/yr) — positive.
- The deal already cash-flows at list — no discount required.
- Meets the 1% rule at list price ($8k rent vs $795k).
- Recommended offer: $783k (1.5% below list) — sets the bar for market timing.
Location & tenants
- Location reads: area grade C — affects rentability + tenant quality, not the cash-flow math above.
- Wells-Ogunquit CSD (rural): math 87% / reading 90% proficiency, ranked #32 of 112 in ME (top 29%) — strong family-tenant draw, lease renewals of 3-5y typical; only 17% free/reduced lunch — higher-income household profile.
- Market conditions: 267 active listings in the ZIP; 1,386 units permitted in York County in 2024 (338 in 5+ unit buildings).
Forward outlook
- Local home prices are declining (-3.0%/yr); year-one equity from $5k of loan paydown is wiped out by about $24k of value loss. Plan a longer hold.
Negotiation context
- It's been on market 20 days — a 2% lower offer ($783k) is reasonable based on typical stale-listing flexibility.
- 7 sale attempts since 3y ago with the ask held roughly flat each time — persistent listings suggest the price (not the market) is what's stuck; bring a comps-based counter.
Risks & watch-outs
- Watch-outs: built in 1820 — expect roof / HVAC / electrical / plumbing capex.
- Climate carrying-cost: major wind risk, 67% chance of damaging wind over 30y; extreme-heat days projected 7→17/yr by 2055 (HVAC capex compounding) — expect insurance premiums to compound above CPI over the hold.
Questions for the listing agent
- Built in 1820 — when were the roof, HVAC, electrical panel, plumbing, and water heater last replaced?
- Is there a deadline driving the sale (1031 exchange, divorce, estate, relocation)? That informs how much negotiation room exists.
- What's the average days-on-market for RENTAL listings here right now (not sales)? A rising rental-DOM trend means longer vacancies and softer asking-rent achievability than the comps imply.
- What's the recent tenant-quality profile in this submarket — average credit score on applications, eviction rate, late-payment / NSF rate, and stable-employment percentage? A property-management company in the area should have these aggregated.
- How much new apartment / multifamily construction is in the pipeline within 1–3 miles? Heavy new supply (>2% of stock underway) typically softens rents 12–24 months out; light construction supports rent growth.
Investment metrics
- 1% rule
- 1.02% ✓
- Cap rate
- 8.61%
- Cash-on-cash
- 8.27%
- DSCR
- 1.37
- GRM
- 8.2
CMA / ARV
No comps found within radius.
Projected returns pro-forma
-3.0% appreciation · 3.0% rent growth · sell at horizon
- IRR
- -3.8%
- Equity multiple
- 0.86×
- Total profit
- $-31,394
- Equity at exit
- $118,537
- IRR
- 5.9%
- Equity multiple
- 1.44×
- Total profit
- $97,368
- Equity at exit
- $68,737
Cash invested: $222,600 (down + closing). Projections, not guarantees.
Landlord ↔ Tenant lean methodology
- Overall (STATE)
- 41 Moderately Tenant-Leaning
- State Maine
- 41 Moderately Tenant-Leaning · D+2
- County
- — inherits STATE
- City
- — inherits STATE
ZIP-level market 04090
- Home prices YoY
- -20.0%
- Active inventory
- 267
- Price-to-rent
- 24.6×
Monthly cashflow live
- Estimated rent
- $8,087 medium interval (Pro) →
- Mortgage (P&I)
- −$4,169
- Tax from tax record
- −$354 /mo · $4,253/yr
- Insurance
- −$331
- HOA
- −$0
- Vacancy / Maint / Mgmt
- −$1,698
- Net cashflow
- $1,534
Break-even live
3-unit breakdown (identical units grouped — click to expand)
| Units | Beds | Baths | Est. rent |
|---|---|---|---|
| 3× units | 2 | 1 | $8,088 |
| #1 | 2 | 1 | $2,696 |
| #2 | 2 | 1 | $2,696 |
| #3 | 2 | 1 | $2,696 |
| Total (3 units) | $8,087 | ||
UW: 25.0% down · 7.5% · 30yr · 1.5% tax · 5.0% vac · 8.0% maint · 8.0% mgmt
Financing live
Cash to close
- Down payment
- $198,750
- Closing costs
- $23,850
- Reserves months
- —
- Total cash needed
- —
Loan-product check · same deal, 3 products live
Conventional
25% down · 7.5% · 30yr
- Down + closing
- —
- Monthly P&I
- —
- Monthly cashflow
- —
- DSCR
- —
- Eligible?
- —
Personal DTI + credit; lowest rate.
DSCR
20% down · 8.5% · 30yr
- Down + closing
- —
- Monthly P&I
- —
- Monthly cashflow
- —
- DSCR
- —
- Eligible?
- —
No personal income docs; deal must DSCR.
Hard money
10% down · 12.0% · 12mo
- Down + closing
- —
- Monthly P&I
- —
- Monthly cashflow
- —
- DSCR
- —
- Eligible?
- —
Short-term bridge; refi at stabilization.
Listing history 17 events
-
2026-06-18days on market $795,000 Active 20 DOM
-
2026-06-17days on market $795,000 Active 19 DOM
-
2026-06-16days on market $795,000 Active 18 DOM
-
2026-06-15days on market $795,000 Active 17 DOM
-
2026-06-14days on market $795,000 Active 15 DOM
-
2026-06-13days on market $795,000 Active 14 DOM
-
2026-06-10days on market $795,000 Active 12 DOM
-
2026-06-09days on market $795,000 Active 11 DOM
-
2026-06-08days on market $795,000 Active 10 DOM
-
2026-06-07days on market $795,000 Active 9 DOM
-
2026-06-05days on market $795,000 Active 6 DOM
-
2026-06-03days on market $795,000 Active 5 DOM
-
2026-06-02days on market $795,000 Active 4 DOM
-
2026-06-01days on market $795,000 Active 3 DOM
-
2026-05-31days on market $795,000 Active 2 DOM
-
2026-05-30remarks 699-char remark
-
2026-05-30$795,000 Active 1 DOM
ⓘ Source: listings_history table (triggers on properties + properties_extension) + one-shot
backfill from property_details.listing_events for pre-trigger history.
Tax reassessment forecast ME · Partial reset (capped growth)
- Current annual tax
- $4,253 · $354/mo
- Projected year-2 tax
- $7,532 · $628/mo
- Expected delta
- +$3,280/yr (+$273/mo · 77.1%)
ⓘ Screening estimate from a state-policy table — verify with the county assessor before closing.
Climate risk First Street
- Flood 1/10 Low FEMA zone X · 0% chance over 30 yrs
- Wildfire 3/10 Moderate
- Heat 5/10 Major 7 d/yr ≥87°F today · 17 d/yr by 30 yrs out
- Wind 6/10 Major 67% chance of damaging wind over 30 yrs
- Air quality 2/10 Low 1 unhealthy d/yr today · 2 by 30 yrs out
Nearby sold comps map
Loading sold comps map…
Walkable amenities ~0.75 mi
Loading nearby amenities…
Taxation est. · year 1
- Rental income
- $97,044
- − Mortgage interest
- −$44,532
- − Property taxes
- −$4,253
- − Insurance
- −$3,975
- − Repairs & maintenance
- −$7,764
- − Management
- −$7,764
- − Depreciation
- −$23,127
- Taxable income
- $5,629
- Est. tax owed @ 24.0%
- −$1,351
- After-tax cash flow
- $17,057/yr
For passive investors: Depreciation is non-cash, so a rental often shows a tax loss while cash-flowing — sheltering income. Rental losses are passive: they offset passive income freely, and up to $25,000/yr can offset ordinary (W-2) income if you actively participate and your MAGI is under $100k (phasing out to $0 by $150k); unused losses carry forward. On sale, claimed depreciation is recaptured at up to 25%, and gains may owe capital-gains tax (a 1031 exchange can defer both). Figures are a year-1 estimate at your 24.0% rate — not tax advice; consult a CPA.
Schools (NCES district)
- District
- Wells-Ogunquit CSD
- NCES district ID
- 2313490
- Math proficiency
- 87% ▲ 42.00%
- Reading proficiency
- 90% ▲ 26.00%
- Median HH income
- $61,341
- Composite
- 75.79/100
- National rank
- #125
- State rank
- #32 of 112 in ME
Livability — Wells
No livability data for this city. (Only ~50 U.S. cities are tracked.)
Census & demographics
- Population (ZIP)
- 11,544
Population outlook (York County) Hauer SSP2
- Today (2025)
- 209,961 people
- By 2030
- 212,816 · +1.4%
- By 2040
- 214,360 · +2.1%
- By 2050
- 210,350 · +0.2%
- By 2075
- 201,686 · -3.9%
- By 2100
- 183,392 · -12.7%
Race, ethnicity, and origin ACS 2023
- Neighborhood character
- Predominantly White (89%)
- Race & ethnicity
- White 89% Two or more races 5% Black 3% Asian 1%
- Common ancestry
- Lithuanian 11% Romanian 3% Slovak 3%
- Foreign-born
- 5% · Canada, China
- Languages at home
- 94% English-only · Other Indo-European 1% French/Haitian/Cajun 1% Other Asian/Pacific 1%
Political lean MEDSL · York
- 2024 margin
- D (+10.5) · D 54.3% · R 43.8% · Other 1.9%
- 2008→2024 swing
- -10.1pp toward R · 2008: 20.5pp · 2024: 10.5pp
- All cycles
- 2024: D+10.5 2020: D+12.6 2016: D+4.8 2012: D+16.4 2008: D+20.5
Not yet ingested
- Civics
- —
Market trends
- HPI YoY
- ▼ -103.52%
- Current HPI
- 413.9951
- Rent YoY
- —
- Metro
- —
- State GDP YoY
- —
- F500 in state
- 0
Price history
-38.5% since first listed27 events — show timeline
- 2026-05-29 Listed $795,000 MREIS
- 2026-01-01 Delisted — MREIS
- 2026-01-01 Delisted — MREIS
- 2025-11-19 Price Changed $795,000 MREIS
- 2025-11-19 Listed $795,000 MREIS
- 2025-10-09 Price Changed $825,000 MREIS
- 2025-08-14 Listed $875,000 MREIS
- 2024-07-01 Delisted — MREIS
- 2024-06-28 Sold (MLS) $755,000 MREIS
- 2024-05-11 Pending — MREIS
- 2024-04-27 Contingent — MREIS
- 2024-04-27 Contingent — MREIS
- 2024-02-25 Price Changed $839,000 MREIS
- 2024-02-25 Price Changed $839,000 MREIS
- 2024-02-04 Price Changed $899,000 MREIS
- 2024-02-04 Price Changed $899,000 MREIS
- 2024-01-09 Price Changed $949,000 MREIS
- 2024-01-09 Price Changed $949,000 MREIS
- 2023-10-29 Listed $985,000 MREIS
- 2023-10-29 Listed $985,000 MREIS
- 2023-09-30 Delisted — MREIS
- 2023-09-29 Delisted — MREIS
- 2023-09-01 Price Changed $1,043,000 MREIS
- 2023-09-01 Price Changed $1,043,000 MREIS
- 2023-08-24 Listed $1,143,000 MREIS
- 2023-08-17 Price Changed $1,143,000 MREIS
- 2023-06-06 Listed $1,293,000 MREIS
Property tax history
+2.7%/yrLatest (2025): $4,253 · +6.2% YoY. Source: county tax records.
Cash-flow waterfall
monthlySold comps — $/sqft
last 12 mo · ≤1 miLoading sold comps…