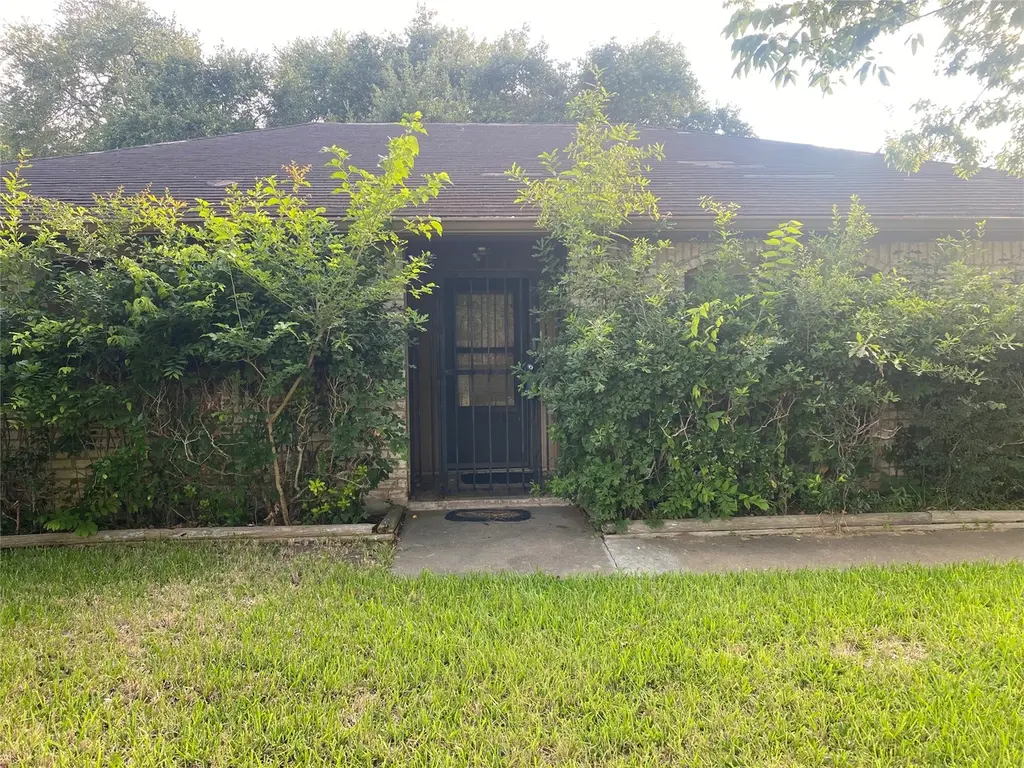
15814 Ridgerock Rd · Houston, TX
Flood risk 6/10 · Moderate
- FEMA flood zone
- X (unshaded)
- Chance of flooding over 30 yrs
- 0.68%
- Est. flood insurance / yr
- $507 – $1,088
Fire risk 3/10 · Minor
- Est. fire insurance / yr
- $1,222 – $2,270
Heat risk 9/10 · Severe
- Hot days now (above 110°F)
- 7 days/yr
- Hot days in 30 yrs
- 23 days/yr
Wind risk 9/10 · Severe
- Chance of severe wind over 30 yrs
- 99.0%
Air-quality risk 3/10 · Minor
- Unhealthy air days now
- 2 days/yr
- Unhealthy air days in 30 yrs
- 3 days/yr
Risk factors via First Street. Map © Google.
Why this score? — see what drove the B grade
The composite is a weighted blend of 9 inputs, each scored 0–100. Each bar is that input's sub-score; the figure is the points it added to the 100-point composite (weight × sub-score).
- Cash flow +25.1/30.0
- ARV discount +15.0/15.0
- 1% rule +8.6/10.0
- DSCR +8.2/10.0
- Appreciation +4.7/10.0
- Schools +4.5/10.0
- Livability +3.7/5.0
- Rent growth +2.6/5.0
- Condition / age +2.5/5.0
$140,000
🖨 Deal sheet 📄 Offer letter ✓ Due diligence
Listing remarks
Investor opportunity in Missouri City! This 3-bedroom home is located in an established neighborhood and features a spacious layout, cozy fireplace, and large lot with a huge backyard offering great potential for entertaining or future improvements. Property is being sold AS-IS and will require updates and repairs. Ideal for investors, flippers, or buyers looking for a project. Buyer to independently verify room dimensions, schools, and all property information.
Key facts
- Large lot
- Huge backyard
- Cozy fireplace
Tags
Property features AI
Finance
- Other: Lease not considered
- HOA & community: Community Improvement Association with $150 annual fee
Exterior
- Parking: Detached garage (2 spaces)
- Utilities: Public water; Public sewer
- Home design: Residential property; Built in 1978; Single-story (1,680 living area); Slab foundation
- Construction: Brick construction
- Exterior features: Located in a subdivision
Interior
- Kitchen: Dishwasher; Disposal; Microwave
- Bathrooms: 2 full bathrooms
- Heating & cooling: Central heating (gas); Central electric air conditioning
- Interior features: Wood-burning fireplace (1)
Neighborhood map
What this means for you Summary
Snapshot
- This is a 3-bed/2.0-bath single-family listed at $140k.
Deal economics
- At list price, monthly cash flow is $311 ($4k/yr) — positive.
- The deal already cash-flows at list — no discount required.
- Meets the 1% rule at list price ($2k rent vs $140k).
- Cap rate 9.0% vs local median 3.2% in Houston — top-decile yield for the area; either an underpriced asset or a hidden risk that comps aren't pricing in. Stress-test before assuming the spread holds.
Location & tenants
- Location reads 74/100 on livability (#184 in TX, #4,771 nationally) — a middle-class / working-renter tenant base. Strengths: amenities A+, cost of living A+, housing A+; Watch: crime F.
- Fort Bend ISD (suburban): math 44% / reading 53% proficiency, ranked #140 of 826 in TX (top 17%) — families likely to look elsewhere, expect single-tenant / working-renter base with shorter leases.
- Zoned schools: Blue Ridge El (math 8% / reading 17%, grade F, #4,180 of 4,322 statewide, top 97%, 263 students, 89% FRL); Christa Mcauliffe Middle (math 9% / reading 20%, grade F, #1,583 of 1,662 statewide, top 96%, 835 students, 94% FRL); Willowridge H S (math 12% / reading 29%, grade F, #1,389 of 1,632 statewide, top 86%, 1,319 students, 87% FRL) — zoned schools average 90% FRL vs 35% district-wide (55 pts higher); higher-poverty schools than district average — tighter screening recommended.
- Zoned-school proficiency averages 16% at this address vs 48% district-wide (-33 pts) — the specific schools serving this property underperform the Fort Bend ISD average; the district grade overstates school quality for this exact location.
- Market conditions: Rents flat; 186 active listings in the ZIP; 11 comparable units currently listed for rent nearby; rentals at typical pace (median 15d on market — plan ~3-4 weeks tenant-placement turnaround); 12,093 units permitted in Fort Bend County in 2024 (815 in 5+ unit buildings).
- This rent runs 31% of the median local income ($75k/yr) — at the standard rent-burdened threshold; future hikes will face affordability resistance.
Forward outlook
- In year one you build about $196 of equity ($968 loan paydown + $-772 appreciation (-0.6% local appreciation)).
- Fort Bend County population projected at +75% by 2050 — long-run rental-demand tailwind backs the buy-and-hold thesis.
- At projected returns (-0.6% appreciation + 0.3% rent growth), your $39k cash investment doubles in ~10 years — after that, you're playing with house money.
Negotiation context
- Only 8 days on market — expect competitive offers; lowballing is unlikely to land.
Risks & watch-outs
- Watch-outs: property tax is 3.3% of price.
- Climate carrying-cost: major flood risk; severe wind risk, 99% chance of damaging wind over 30y; extreme-heat days projected 7→23/yr by 2055 (HVAC capex compounding) — expect insurance premiums to compound above CPI over the hold.
Questions for the listing agent
- Built in 1978 — when were the roof, HVAC, electrical panel, plumbing, and water heater last replaced?
- Property tax is high relative to price — has the assessment been appealed recently, and will the sale trigger a re-assessment?
- What does the HOA fee cover, when was the last increase, and are there any pending special assessments or reserve-fund shortfalls?
- Is there a deadline driving the sale (1031 exchange, divorce, estate, relocation)? That informs how much negotiation room exists.
- Schools are D-rated, which usually means shorter tenancies and higher turnover. Who's the typical renter profile here, and what's been the actual vacancy rate?
- Crime grade is F in this area — have there been break-ins, vandalism, or insurance claims at this property in the last 3 years? What carrier currently insures it and at what premium?
- What's the average days-on-market for RENTAL listings here right now (not sales)? A rising rental-DOM trend means longer vacancies and softer asking-rent achievability than the comps imply.
- What's the recent tenant-quality profile in this submarket — average credit score on applications, eviction rate, late-payment / NSF rate, and stable-employment percentage? A property-management company in the area should have these aggregated.
- How much new for-sale + rental construction is in the pipeline within 1–3 miles? Heavy new supply typically softens prices + rents 12–24 months out; constrained supply supports both.
Investment metrics
- 1% rule
- 1.36% ✓
- Cap rate
- 8.96%
- Cash-on-cash
- 9.53%
- DSCR
- 1.42
- GRM
- 6.1
CMA / ARV
- ARV (median comp)
- $200,309
- List price
- $140,000
- Delta
- -30.11%
- Verdict
- UNDERPRICED
- Comps
- 20 within 1.0 mi
Show comp detail 12 sales within ~0.75 mi
| Address | Dist | Beds/Ba | Sqft | Sold | Price | $/sf | Match |
|---|---|---|---|---|---|---|---|
| 15814 Ridgerock Rd | 0.00mi | 3/2.0 | 1,680 (0%) | 1mo | $140,000 | $83 | 99 |
| 15610 Briar Spring Ct | 0.44mi | 3/2.0 | 1,719 (+2%) | 3mo | $220,000 | $128 | 73 |
| 6614 Villarreal Dr | 0.18mi | 3/2.0 | 1,524 (-9%) | 4mo | $69,900 | $46 | 73 |
| 6407 Bazel Brook Dr | 0.50mi | 3/2.0 | 1,644 (-2%) | 1mo | $259,900 | $158 | 72 |
| 15626 Briargate Ct | 0.31mi | 3/2.0 | 1,572 (-6%) | 4mo | $220,000 | $140 | 71 |
| 6802 Jadwin Ct | 0.10mi | 4/3.5 (+1) | 1,860 (+11%) | 1mo | $199,000 | $107 | 66 |
| 7023 Maczali Dr | 0.36mi | 3/2.0 | 1,472 (-12%) | 1mo | $189,000 | $128 | 62 |
| 16326 Napa Vine Dr | 0.65mi | 4/2.5 (+1) | 1,670 (-1%) | 1mo | $260,000 | $156 | 61 |
| 6618 Castleview Ln | 0.29mi | 4/2.0 (+1) | 1,458 (-13%) | 1mo | $260,000 | $178 | 58 |
| 15903 Kenbrook Dr | 0.46mi | 3/2.0 | 1,487 (-12%) | 1mo | $245,000 | $165 | 58 |
| 15403 Blueridge Rd | 0.51mi | 4/2.0 (+1) | 1,833 (+9%) | 0mo | $249,999 | $136 | 56 |
| 7423 Maczali Dr | 0.74mi | 3/2.0 | 1,475 (-12%) | 4mo | $239,999 | $163 | 42 |
Match score weights: distance 35% · size 25% · config 20% · recency 20%. Top-matched comps best support the ARV.
Projected returns pro-forma
-0.55% appreciation · 0.34% rent growth · sell at horizon
- IRR
- 4.2%
- Equity multiple
- 1.19×
- Total profit
- $7,348
- Equity at exit
- $36,836
- IRR
- 7.7%
- Equity multiple
- 1.71×
- Total profit
- $27,727
- Equity at exit
- $41,338
Cash invested: $39,200 (down + closing). Projections, not guarantees.
Landlord ↔ Tenant lean methodology
- Overall (STATE)
- 87 Strongly Landlord-Friendly
- State Texas
- 87 Strongly Landlord-Friendly · R+5
- County
- — inherits STATE
- City
- — inherits STATE
ZIP-level market 77489
- Home prices YoY
- -0.2%
- Rents YoY
- 0.3%
- Active inventory
- 186
- Price-to-rent
- 6.1×
Monthly cashflow live
- Estimated rent
- $1,901 high interval (Pro) →
- Mortgage (P&I)
- −$734
- Tax from tax record
- −$385 /mo · $4,617/yr
- Insurance
- −$58
- HOA
- −$13
- Vacancy / Maint / Mgmt
- −$399
- Net cashflow
- $311
Break-even live
UW: 25.0% down · 7.5% · 30yr · 1.5% tax · 5.0% vac · 8.0% maint · 8.0% mgmt
Financing live
Cash to close
- Down payment
- $35,000
- Closing costs
- $4,200
- Reserves months
- —
- Total cash needed
- —
Loan-product check · same deal, 3 products live
Conventional
25% down · 7.5% · 30yr
- Down + closing
- —
- Monthly P&I
- —
- Monthly cashflow
- —
- DSCR
- —
- Eligible?
- —
Personal DTI + credit; lowest rate.
DSCR
20% down · 8.5% · 30yr
- Down + closing
- —
- Monthly P&I
- —
- Monthly cashflow
- —
- DSCR
- —
- Eligible?
- —
No personal income docs; deal must DSCR.
Hard money
10% down · 12.0% · 12mo
- Down + closing
- —
- Monthly P&I
- —
- Monthly cashflow
- —
- DSCR
- —
- Eligible?
- —
Short-term bridge; refi at stabilization.
Rent comps 11 comps
| Address | Beds | Baths | Sqft | Rent | $/sqft | DOM | Units | Dist |
|---|---|---|---|---|---|---|---|---|
| 6610 Rowell Ct Missouri City, TX | 3.0 | 2.0 | 1753 | $2,056 | $1.17 | 5d | 1 | 0.36mi |
| 6406 Summer Ridge Dr Missouri City, TX | 3.0 | 2.0 | 1624 | $1,958 | $1.21 | 2d | 1 | 0.45mi |
| 16211 Corsair Rd Houston, TX | 3.0 | 2.0 | 1139 | $1,813 | $1.59 | 24d | 1 | 0.47mi |
| 16322 Petaluma Dr Houston, TX | 3.0 | 2.5 | 1876 | $1,770 | $0.94 | 15d | 1 | 0.56mi |
| 16432 Chimney Rock Rd Unit 3174 Houston, TX | 3.0 | 2.0 | 1349 | $1,513 | $1.12 | 10d | 1 | 0.71mi |
| 16432 Chimney Rock Rd Unit 3112 Houston, TX | 3.0 | 2.0 | 1349 | $1,481 | $1.10 | 2d | 1 | 0.71mi |
| 16432 Chimney Rock Rd Unit 16465 Houston, TX | 3.0 | 2.0 | 1349 | $1,524 | $1.13 | 43d | 1 | 0.71mi |
| 5721 Melanite Ave Houston, TX | 3.0 | 1.5 | 1634 | $1,481 | $0.91 | 19d | 1 | 0.93mi |
| 15703 Baybriar Dr Missouri City, TX | 3.0 | 2.0 | 1252 | $1,615 | $1.29 | 19d | 1 | 0.96mi |
| 15823 Baybriar Dr Missouri City, TX | 3.0 | 2.0 | 1335 | $1,641 | $1.23 | 5d | 1 | 1.03mi |
| 16603 Sentinel Dr Houston, TX | 3.0 | 2.0 | 1296 | $1,799 | $1.39 | 16d | 1 | 1.19mi |
HOA detail
- Monthly dues
- $13 · $156/yr
Listing history 3 events
-
2026-05-18status Pending 466-char remark
-
2026-05-18status Pending 466-char remark
-
2026-05-12$140,000 Active 466-char remark
ⓘ Source: listings_history table (triggers on properties + properties_extension) + one-shot
backfill from property_details.listing_events for pre-trigger history.
Tax reassessment forecast TX · Resets to sale price
- Current annual tax
- $4,617 · $385/mo
- Projected year-2 tax
- $4,617 · $385/mo
- Expected delta
- $0/yr ($0/mo · 0.0%)
ⓘ Screening estimate from a state-policy table — verify with the county assessor before closing.
Climate risk First Street
- Flood 6/10 Major FEMA zone X (unshaded) · 68% chance over 30 yrs
- Wildfire 3/10 Moderate
- Heat 9/10 Extreme 7 d/yr ≥110°F today · 23 d/yr by 30 yrs out
- Wind 9/10 Extreme 99% chance of damaging wind over 30 yrs
- Air quality 3/10 Moderate 2 unhealthy d/yr today · 3 by 30 yrs out
Nearby sold comps map
Loading sold comps map…
Walkable amenities ~0.75 mi
Loading nearby amenities…
Taxation est. · year 1
- Rental income
- $22,807
- − Mortgage interest
- −$7,842
- − Property taxes
- −$4,617
- − Insurance
- −$700
- − Repairs & maintenance
- −$1,825
- − Management
- −$1,825
- − HOA
- −$156
- − Depreciation
- −$4,073
- Taxable income
- $1,770
- Est. tax owed @ 24.0%
- −$425
- After-tax cash flow
- $3,309/yr
For passive investors: Depreciation is non-cash, so a rental often shows a tax loss while cash-flowing — sheltering income. Rental losses are passive: they offset passive income freely, and up to $25,000/yr can offset ordinary (W-2) income if you actively participate and your MAGI is under $100k (phasing out to $0 by $150k); unused losses carry forward. On sale, claimed depreciation is recaptured at up to 25%, and gains may owe capital-gains tax (a 1031 exchange can defer both). Figures are a year-1 estimate at your 24.0% rate — not tax advice; consult a CPA.
Schools (NCES district)
- District
- Fort Bend ISD
- NCES district ID
- 4819650
- Math proficiency
- 44% ▼ -15.00%
- Reading proficiency
- 53% ▼ -4.00%
- Median HH income
- $82,360
- Composite
- 44.61/100
- National rank
- #2779
- State rank
- #140 of 826 in TX
Livability — Houston
- Score
- 74/100
- State rank
- #184
- US rank
- #4771
Category grades
Schools grade is shown separately in the Schools card above.
Census & demographics
- Census place
- Houston, TX
- County
- Fort Bend County · 836,777 people
- City population
- 3,226,434
- Metro
- Houston-The Woodlands-Sugar Land, TX
- Population (ZIP)
- 39,292
- Household income
- $74,689
- Rent vs Own
- Severe rent burden
- 1121.0
Population outlook (Fort Bend County) Hauer SSP2
- Today (2025)
- 1,004,526 people
- By 2030
- 1,153,104 · +14.8%
- By 2040
- 1,453,718 · +44.7%
- By 2050
- 1,753,781 · +74.6%
- By 2075
- 2,455,772 · +144.5%
- By 2100
- 2,930,528 · +191.7%
Race, ethnicity, and origin ACS 2023
- Neighborhood character
- Majority Black (60%)
- Race & ethnicity
- Black 60% Hispanic / Latino 29% Two or more races 13% White 4% Asian 3%
- Hispanic origin (detail)
- Mexican 17%
- Foreign-born
- 16% · Canada, Vietnam
- Languages at home
- 73% English-only · Spanish 22% Vietnamese 1% Other Asian/Pacific 1%
Political lean MEDSL · Fort Bend
- 2024 margin
- Toss-up / Even · D 49.5% · R 47.9% · Other 2.6%
- 2008→2024 swing
- +4.0pp toward D · 2008: -2.4pp · 2024: 1.6pp
- All cycles
- 2024: D+1.6 2020: D+10.6 2016: D+6.6 2012: R+6.8 2008: R+2.4
Not yet ingested
- Civics
- —
Market trends
- HPI YoY
- ▼ -0.55%
- Current HPI
- 288.1306
- Rent YoY
- ▲ 0.34%
- Metro
- Houston-The Woodlands-Sugar Land, TX
- State GDP YoY
- ▲ 3.95%
- F500 in state
- 110
Industry mix (Fortune 500 HQ in TX)
| Industry | F500 HQs | Revenue |
|---|---|---|
| Energy | 16 | $1,198B |
|
||
| Technology | 5 | $198B |
|
||
| Engineering / Construction | 4 | $72B |
|
||
| Energy Services | 3 | $60B |
|
||
| Utilities | 3 | $41B |
|
||
| Healthcare | 2 | $330B |
|
||
Price history
6 events — show timeline
- 2026-05-29 Sold (Public Records) — Public Records
- 2026-05-28 Sold (MLS) — HARMLS
- 2026-05-22 Pending — HARMLS
- 2026-05-18 Pending — HARMLS
- 2026-05-18 Pending — HARMLS
- 2026-05-12 Listed $140,000 HARMLS
Property tax history
+4.7%/yrLatest (2025): $4,617 · -1.5% YoY. Source: county tax records.
Cash-flow waterfall
monthlySold comps — $/sqft
last 12 mo · ≤1 miLoading sold comps…